Introduction
Forage grasses can be classified into functional groups based on their ability to acquire resources (Cruz et al., Reference Cruz, Goudet and André2002). According to this classification, more competitive species (also known as exploitative or fast-growing) exhibit greater capacity of resource capture and utilization, along with higher tissue renewal rates than those classified as conservative species. This is because, exploitative species have a greater number of axillary buds capable of generating new tillers as light penetration into the canopy increases (Davies, Reference Davies1974). Conversely, conservative species are characterized by slower growth, smaller specific leaf area and longer leaf lifespan, making them more stress-tolerant (Cruz et al., Reference Cruz, Goudet and André2002). Several studies have reported both exploitative and conservative species coexisting in fertile environments (Gross et al., Reference Gross, Suding, Lavorel and Roumet2007; Medeiros-Neto et al., Reference Medeiros-Neto, Barbosa, Schmitt, Miqueloto, Da Silva and Sbrissia2023). These distinct traits within the plant community can result in spatial and temporal variations in resource capture, thus providing greater efficiency of resource utilization both above- and below-ground. This synergy between conservative and exploitative species ultimately results in yield stability (Duchini et al., Reference Duchini, Guzatti, Echeverria, Américo and Sbrissia2019), greater stock of soil organic carbon (Bai and Cotrufo, Reference Bai and Cotrufo2022), increased animal productivity (Maxwell et al., Reference Maxwell, Cartwright, Meyer and Al-Marashdeh2023) and numerous ecosystem services (Bengtsson et al., Reference Bengtsson, Bullock, Egoh, Everson, Everson, O’Connor, O’Farrell, Smith and Lindborg2019). These benefits, however, are poorly quantified in tropical climates.
According to Tilman et al. (Reference Tilman, Reich and Knops2006) and Hector et al. (Reference Hector, Hautier, Saner, Wacker, Bagchi, Joshi, Scherer-Lorenzen, Spehn, Bazeley-White, Weilenmann, Caldeira, Dimitrakopoulos, Finn, Huss-Danell, Jumpponen, Mulder, Palmborg, Pereira, Siamantziouras, Terry, Troumbis, Schimid and Loreau2010), biodiversity increases temporal fluctuations in individual primary production and species populations and decreases variability at the community level. This occurs through asynchronous population fluctuations and overyielding of certain species, potentially contributing to a more uniform forage yield throughout the year (Tilman et al., Reference Tilman, Reich and Knops2006). However, forage production depends not only on the quantity, but also on the stability of plant populations, which may be affected by intra- and interspecific competition, affecting the balance of tiller populations within the plant community (Da Siva et al., 2021). Thus, tillering dynamics is a key aspect for evaluating the persistence and adaptation of a grass community, as it is linked to the pasture’s ability to replace dead tillers, maintain stable populations over time and sustain or recover its leaf area index (LAI). Forage grasses exhibit contrasting persistence strategies among different species, as reported by Matthew et al. (Reference Matthew, Agnusdei, Assuero, Sbrissia, Scheneiter, Da Silva, Michalk, Millar, Badgery and Broadfoot2013). According to the authors, some species present seasonal tillering, influenced by flowering and/or climatic conditions, whereas others adopt a vegetative persistence pathway, with continuous and more evenly distributed tillering throughout the year. In addition, each individual tiller has a limited lifespan, with its phytomer production being genetically determined (Valentine and Matthew, Reference Valentine, Matthew, White and Hodgson1999). Therefore, for a pasture to remain stable, each tiller must, on average, produce at least one new tiller during its lifespan to ensure population stability and persistence (Parsons and Chapman, Reference Parsons, Chapman and Hopkins2000). This is particularly important across different seasons, as the availability of factors such as light, water, temperature and nutrients significantly influence tillering dynamics (Langer, Reference Langer1963).
Matthew and Hamilton (Reference Matthew and Hamilton2011) emphasized that studies on tillering dynamics should not be restricted to assessments of tiller population density (TPD) alone, but must also include parameters such as tiller appearance and mortality rates, population stability, tiller demography and hierarchical structure. These metrics provide insights into management goals by identifying seasonal changes, the most numerous and long-lived tiller generations, and periods of instability. Such evaluations are even more critical in multispecific pastures, where contrasting persistence pathways may exist among forage grass species (Duchini et al., Reference Duchini, Guzatti, Echeverria, Américo and Sbrissia2018). While some species maintain relatively constant tillering throughout the year, others may display seasonal tillering as affected by weather conditions (Matthew et al., Reference Matthew, Agnusdei, Assuero, Sbrissia, Scheneiter, Da Silva, Michalk, Millar, Badgery and Broadfoot2013). Understanding whether these patterns change in multispecific swards can guide both species selection and management strategies.
Weigelt et al. (Reference Weigelt, Weisser, Buchmann and Scherer-Lorenzen2009) reported a positive relationship between biodiversity and the multifunctionality of grazing ecosystems. However, studies have suggested that using two or three species with complementary growth strategies may be more efficient than implementing a complex mixture with numerous species randomly combined, provided the selected species are well-adapted to the environmental conditions and management practices (Tracy and Sanderson, Reference Tracy and Sanderson2004). Based on that, it was hypothesized that the well adapted and contrasting resource-use strategies of Planaltina gambagrass (Andropogon gayanus Kunth cv. Planaltina) and Massai guineagrass (Megathyrsus maximus (Jacq.) B.K. Simon & S.W.L. Jacobs cv. Massai) might be good candidates for composing stable and perennial mixtures with Piatã palisadegrass [Urochloa brizantha (Hochst. ex A. Rich.) R. Webster cv. BRS Piatã], a cultivar belonging to the most widespread pasture species in the tropics. Furthermore, it was investigated whether the persistence pathways of these three grass species are coupled with their growth strategy, regardless of whether they are cultivated as pure or mixed stands. Therefore, this study aimed to identify whether the three above-mentioned grasses maintain their tillering patterns when grown as a mixture and, therefore, can be candidates for establishing stable and persistent tropical mixed canopies when subjected to frequent and non-severe defoliation management.
Materials and methods
Study site, treatments and experimental design
The study was conducted in Piracicaba, SP, Brazil (22º42’35” S, 47º38’24” W and 546 m a.s.l.) at the Luiz de Queiroz College of Agriculture, University of São Paulo (ESALQ/USP), from February 2020 to March 2022. According to the Köppen classification, the local climate is Cwa, which is humid subtropical with dry winters and hot summers (Alvares et al., Reference Alvares, Stape, Sentelhas, Gonçalves and Sparovek2013). The rainy and dry seasons are usually observed from October to March and from April to September, with a historical accumulated rainfall of 992 and 282 mm, respectively (1917-2023 average). Climate and weather data were retrieved from a meteorological station located 1.9 km from the study site (Figure 1).
Monthly maximum, average, and minimum air temperatures (°C) and total monthly rainfall (mm) from February 2020 to March 2022, Piracicaba, SP, Brazil.

The soil is classified as Eutroferric Red Nitossol (Santos et al., Reference Santos, Jacomine, Anjos, Oliveira, Oliveira, Coelho, Lumbreras and Cunha2018) with the following physical and chemical characteristics (0–20 cm layer) prior to the implementation of the experiment: clay = 446 g/kg; sand = 358 g/kg; silt = 196 g/kg; pH (CaCl2) = 4.50; organic matter = 33.8 g/dm3; P = 49.5 mg/dm3; K = 3.45 mmolc/dm3; Ca = 30.3 mmolc/dm3; Mg = 12.5 mmolc/dm3; S = 25.8 mg/dm3; Al = 1.50 mmolc/dm3; H + Al = 72.5 mmolc/dm3; sum of bases = 46.0 mmolc/dm3; cation exchange capacity = 119 mmolc/dm3; base saturation = 39.0%; aluminum saturation = 3.50%; Fe = 176 mg/dm3; Mn = 35.2 mg/dm3; Zn = 5.54 mg/dm3; Cu = 4.51 mg/dm3; and B = 0.26 mg/dm3. Dolomitic limestone was used to increase the soil base saturation to 70% (Cantarella et al., Reference Cantarella, Quaggio, Mattos, Boaretto and Van Raij2022) in late winter 2019, before the establishment of the experimental plots in January 2020.
The four treatments were to three perennial tropical forage grasses: Andropogon gayanus Kunth cv. Planaltina (Planaltina gambagrass, PG), Megathyrsus maximus (Jacq.) B.K. Simon & S.W.L. Jacobs cv. Massai (Massai guineagrass, MG) and Urochloa brizantha (Hochst. ex A. Rich.) R. Webster cv. BRS Piatã (Piata palisadegrass, PP), cultivated as monocultures and a mixed stand comprising all three species. The experiment was arranged in a randomized complete block design comprising four replicates, totaling 16 plots of 180 m2 each (12 × 15 m). The slope of the experimental area was chosen as the blocking criterion.
The forage grass species were chosen based on their contrasting architecture, growth habits (Loreau and Hector, Reference Loreau and Hector2001; Pontes et al., Reference Pontes, Maire, Louault, Soussana and Carrère2012) and strategies of resource use (i.e., capture or conservation; Tilman, 1999), similar to the protocol detailed by Otaviano et al. (Reference Otaviano, Mammana, Gomes, Silva, Garcia-Carvalho, Sbrissia, Barbosa, Sollenberger and Da Silva2024). Briefly, PG, a tall, tufted, tussock-forming grass was selected as the most conservative species (Sousa et al., Reference Sousa, Nascimento Júnior, Da Silva, Monteiro, Rodrigues, Fonseca, Silveira and Sbrissia2010), whereas PP was the most competitive species in capturing resources (Silveira et al., Reference Silveira, Nascimento Júnior, Da Silva, Euclides, Montagner, Sbrissia, Rodrigues, Sousa, Pena and Vilela2010). Massai guineagrass was chosen as the intermediate species, with a semi-upright growth habit and moderate resource capture and use (Martuscello et al., Reference Martuscello, Silva, Cunha, Batista, Braz and Ferreira2015).
Sward establishment and management
The experimental units were sown manually in January 2020, using a rate equivalent to 300 pure-viable seeds/m2 (1/3 for each grass species in the mixed stand plots), followed by immediate compaction with a 100 kg roller. Plots were then fertilized 21 days after sowing with an equivalent of 40 kg N/ha using ammonium nitrate as source. Standardization clipping was performed at the end of February 2020 at 17.5 cm of stubble height when the canopies reached a height of 35 cm. This forage clipping as well as the later ones were performed using a brush cutter equipped with a harness model FS 161 (Stihl, São Leopoldo, RS, Brazil), and the material removed from the plots using a rake.
All treatments were subjected to the same defoliation management protocol. The pre-harvest condition was determined by the critical LAI, corresponding to 95% of canopy light interception during regrowth under rotational stocking (Da Silva et al., Reference Da Silva, Sbrissia and Pereira2015). Canopy light interception was measured along with canopy height using a LAI-2000 analyzer (LI-COR, Lincoln, NE, USA). Measurements were taken at dawn or dusk from eight representative points per paddock. At each point, one reference reading above the canopy and five at ground level were collected, totaling 8 above-canopy and 40 ground-level readings per paddock (Silva et al., Reference Silva, Da Silva, Otaviano, Gomes, Mammana, Garcia-Carvalho, Sbrissia, Frak and Louarn2025). Based on this criterion, the recommended pre-harvest heights are approximately 35 cm for PP (Crestani et al., Reference Crestani, Mascheroni, Geremia, Carnevalli, Mourão and Da Silva2017), 50 cm for PG (Sousa et al., Reference Sousa, Nascimento Júnior, Da Silva, Monteiro, Rodrigues, Fonseca, Silveira and Sbrissia2010) and 55 cm for MG (Barbosa et al., Reference Barbosa, Rosa and Lima2010). However, subsequent studies demonstrated that reducing up to 40% of the canopy height associated with 95% light interception does not compromise herbage accumulation, thus defining a ‘flexibility range’ in which forage production remains stable (Sbrissia et al., Reference Sbrissia, Duchini, Zanini, Santos, Padilha and Schmitt2018). Within this range, PG and MG could be defoliated at shorter canopy heights, close to 30 and 33 cm, respectively. Considering this evidence, we adopted a common pre-harvest height of 35 cm for all three species, which fell within the reported range of stability. The post-harvest height corresponded to 50% of the pre-harvest value (17.5 cm), allowing frequent but non-severe defoliations, maintaining adequate residual LAI (Giacomini et al., Reference Giacomini, Da Silva, Sarmento, Zeferino, Trindade, Souza Júnior, Guarda, Sbrissia and Nascimento Júnior2009) and minimizing stress (e.g., light availability) and disturbance (e.g., grazing/harvest intensity). Further information regarding monitoring and control of the experimental conditions (i.e., pre- and post-harvest heights, canopy light interception) was detailed in Garcia-Carvalho et al. (Reference Garcia-Carvalho, Congio, Barro, Silva, Otaviano, Gomes, Mammana, Sbrissia, Duchini, Barbosa, Dias and Da Silva2025).
Ammonium nitrate (32% N) was used as nitrogen source for nutrient management. An equivalent of 200 kg N/ha was split-applied from October to March (i.e., warm and rainy season) each year, always at post-harvest. The amount applied after each growth cycle was calculated considering a daily rate of 1.7 kg N/ha multiplied by the harvest interval (days), ensuring equal amounts of the nutrient to be applied in all plots at the end of each rainy season (Congio et al., Reference Congio, Chiavegato, Batalha, Oliveira, Maxwell, Gregorini and Da Silva2019).
Samplings and calculations
TPD assessments were performed pre-harvest once every season of the year. Two herbage samples per plot were clipped at ground level using 100 × 25 cm frames randomly allocated to areas that represented the average canopy condition at the time of sampling (Montagner et al., Reference Montagner, Nascimento Junior, Vilela, Sousa, Euclides, Da Silva and Carloto2012). Herbage samples were then taken to the laboratory to determine TPD. For the mixture plots, a botanical separation of the tillers by species was first performed, followed by counting the number of tillers (Duchini et al., Reference Duchini, Guzatti, Echeverria, Américo and Sbrissia2018). When counting, tillers were classified as basal (i.e., rooted that originated from basal buds) or aerial (i.e. non-rooted that originated from axillary buds) (Da Silva et al., Reference Da Silva, Uebele, Congio, Carnevalli and Sbrissia2021). The total TPD was represented by the sum of both basal and aerial tillers. All tillers, excluding dead material, were dried at 65 °C in a forced-air oven until a constant weight was reached, and the data were used to calculate the average tiller weight (Crestani et al., Reference Crestani, Congio, Mascheroni, Geremia, Carnevalli, Mourão and Da Silva2022).
The dynamics of the tiller population were always assessed post-harvest in all regrowth cycles during the entire experimental period. At the first sampling, two 30-cm-diameter PVC circular rings were randomly fixed to the soil in each plot and remained the same throughout the measurement period (Carvalho et al., Reference Carvalho, Da Silva, Sbrissia, Pinto, Carnevalli, Fagundes and Pedreira2000). All tillers within the rings were counted and tagged with distinct colorful plastic-coated wires for each species and referred to as the base tiller generation. In subsequent samplings, dead tillers were counted and their tags were taken; the remaining live tillers were counted, classified according to their generation (i.e., color tag) and tagged with new colored wires. Tillers were considered dead when they were brown, withered and had no live leaves inside the sheath (Da Silva et al., Reference Da Silva, Chiavegato, Pena, Silveira, Barbero, Souza, Rodrigues, Limão and Pereira2017). These data were then used to calculate the rates of tiller appearance (TAR), tiller death (TDR) and tiller survival (TSR) for each species in the monoculture and mixture.
TAR was calculated as the number of emerged tillers between two subsequent samplings divided by TPD in the previous sampling. TDR and TSR were calculated similarly but using the number of tillers that died and remained alive during the same period, respectively (Difante et al., Reference Difante, Nascimento Júnior, Da Silva, Euclides, Zanine and Adese2008). The rates of tiller appearance, death and survival in the mixture were calculated by summing the tillers that appeared and died from each of the three species (Duchini et al., Reference Duchini, Guzatti, Echeverria, Américo and Sbrissia2018). As the harvest intervals varied throughout the experimental period among treatments and replications because of the way defoliation management was defined, the rates were adjusted to 30-day period using simple linear interpolation assuming a constant daily survival rate over the interval, as described by Bahmani et al. (Reference Bahmani, Thom, Matthew, Hooper and Lemaire2003).
The tiller population stability index (SI) was calculated based on the appearance and survival rates using the equation adapted from Matthew and Hamilton (Reference Matthew and Hamilton2011):
 $${P_1}/{P_0} = TAR + TSR$$
where
 ${P_1}/{P_0}$
represents the SI as the proportion of the tiller population at the current sampling and the previous one, and
 $TAR$
and
 $TSR$
are the corresponding tiller appearance and survival rates, respectively. Tiller population was considered stable when SI = 1, decreasing when SI < 1, and increasing when SI > 1.
The half-life of tillers in each generation was calculated as described by Korte (Reference Korte1986):
 $${t_{1/2}} = \ln 2/b$$
where
 ${t_{1/2}}$
is the half-life of a generation of tillers and
 $b$
is the regression coefficient for exponential regression resulting from a reduction in the number of tillers of this generation over time. The half-life for each generation was used to calculate the average half-life of tiller generations that emerged in each season, weighted by the number of tillers in each generation.
Statistical analysis
All collected variables were pooled by season of the year to allow for comparisons under the same weather conditions. Therefore, the experimental period was divided as follows: summer I (February and March 2020), autumn, winter and early spring I (April to October 2020), late spring I (November and December 2020), summer II (January to March 2021), autumn, winter and early spring II (April to October 2021), late spring II (November and December 2021) and summer III (January to March 2022). Subsequently, the averages for each season were calculated across years, and the data were analyzed according to three seasons as follows: Late Spring; Summer; and Autumn, Winter and Early Spring. Data were subjected to analysis of variance using the MIXED procedure of the SAS® statistical package (version 9.3; SAS Institute Inc., Cary, NC, USA). The Akaike information criterion was used to select the covariance matrix that best fit the datasets. The analysis was performed considering treatments, seasons of the year and their interactions as fixed effects and blocks as random effects (Littell et al., Reference Littell, Pendergast and Natarajan2000). The seasons were treated as repeated measurements. The treatment means were estimated using the ‘LSMEANS’ command, and the comparisons between them, when appropriate, were performed using the probability of difference (PDIFF), with the ‘Student’ t-test at P < 0.050. Comparisons of variations in tiller appearance, mortality and survival rates, as well as the half-life of tillers between the species in association versus their respective monocultures, were performed using orthogonal contrasts at P < 0.050.
Results
TPD and tiller weight
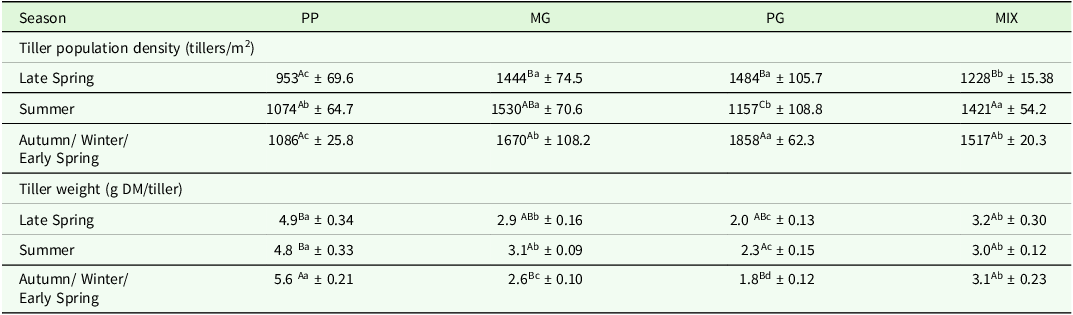
TPD varied with treatment (P < 0.001), season of the year (P < 0.001) and treatment × season of the year interaction (P < 0.001). Overall, greater values were recorded in autumn/winter/early spring (Table 1). No differences were observed among seasons for PP, whose values were smaller than those of the other treatments. The mixture showed intermediate TPD, with the greatest values recorded in summer. Massai guineagrass and PG presented the greatest TPD, both recorded in autumn/winter/early spring; however, the smallest values for MG were recorded in late spring and for PG in summer. Weight per tiller varied with treatment (P < 0.001) and treatment × season interaction (P < 0.001). Generally, PP had the heaviest tillers, PG was the lightest, and MG and the mixture had intermediate values (Table 1).
Tiller population density and average tiller weight for Piatã palisadegrass (PP), Massai guineagrass (MG) and Planaltina gambagrass (PG) cultivated as monocultures or as a mixture (MIX) from February 2020 to March 2022, Piracicaba, SP, Brazil. Means with a common uppercase letter in the columns or lowercase letters in the rows are not different (P >0.050). Values represent mean ± standard error (SE), with degrees of freedom (DF = 6)

Tiller appearance, death and survival rates
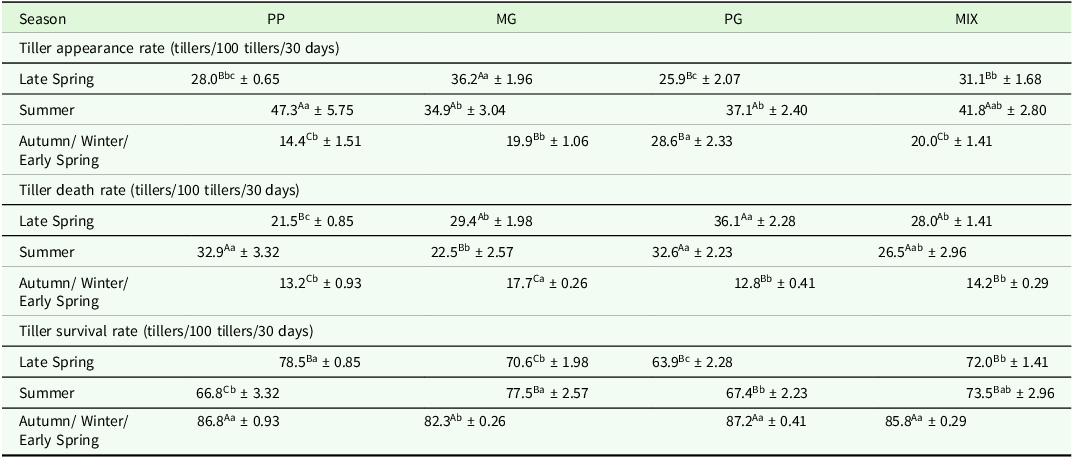
TAR varied with the season of the year (P < 0.001) and treatment × season interaction (P < 0.001). Overall, higher and lower rates were recorded during summer and autumn/winter/early spring, respectively (Table 2). Piatã palisadegrass showed the greatest variation throughout the year, with its TAR being three-fold higher in summer than in autumn/winter/early spring. In contrast, PG presented a small variation and the highest TAR in autumn/winter/early spring compared to the other treatments. Massai guineagrass showed a reduction in TAR only in autumn/winter/early spring, whereas the mixture had higher TAR in summer and lower in autumn/winter/early spring.
Tiller appearance, death and survival rates for Piatã palisadegrass (PP), Massai guineagrass (MG) and Planaltina gambagrass (PG) cultivated as monocultures or as a mixture (MIX) from February 2020 to March 2022, Piracicaba, SP, Brazil. Means with a common uppercase letter in the columns or lowercase letters in the rows are not different (P >0.050). Values represent mean ± standard error (SE), with degrees of freedom (DF = 6)

Both TDR and TSR varied with treatment (P < 0.050), season of the year (P < 0.001) and treatment × season interaction (P < 0.001). Overall, PG had the highest TDR, whereas TDR of all treatments was the lowest during autumn/winter/early spring (Table 2). Piatã palisadegrass had higher values in summer and lower values in autumn/winter/early spring, whereas MG had higher values in late spring and lower in autumn/winter/early spring. Both PG and the mixture had lower values in autumn/winter/early spring, with no difference between late spring and summer. Planaltina gambagrass presented the lowest TSR, with highest values recorded in autumn/winter/early spring (Table 2). Piatã palisadegrass and MG had lowest TSR in summer and late spring, respectively, whereas PG and the mixture showed no differences between late spring and summer.
Half-life of tillers
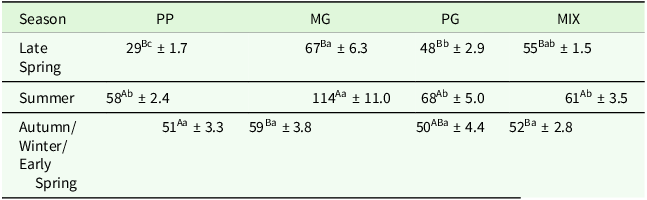
Tiller half-life varied with treatment (P < 0.010), season of the year (P < 0.001) and treatment × season interaction (P < 0.001). In general, MG had the longest-lived tillers among treatments (Table 3). Tillers that appeared during summer had greater longevity than those that appeared during other seasons of the year. Piatã palisadegrass had the shortest half-life, especially for tillers that appeared in late spring (the lowest value recorded throughout the experimental period). In the mixture, the half-life of tillers that appeared throughout the seasons was less variable.
Half-life of tillers (days) for Piatã palisadegrass (PP), Massai guineagrass (MG) and Planaltina gambagrass (PG) cultivated as monocultures or as a mixture (MIX) from February 2020 to March 2022, Piracicaba, SP, Brazil. Means with a common uppercase letter in the columns or lowercase letters in the rows are not different (P > 0.050). Values represent mean ± standard error (SE), with degrees of freedom (DF = 6)

Mixture versus their respective monocultures
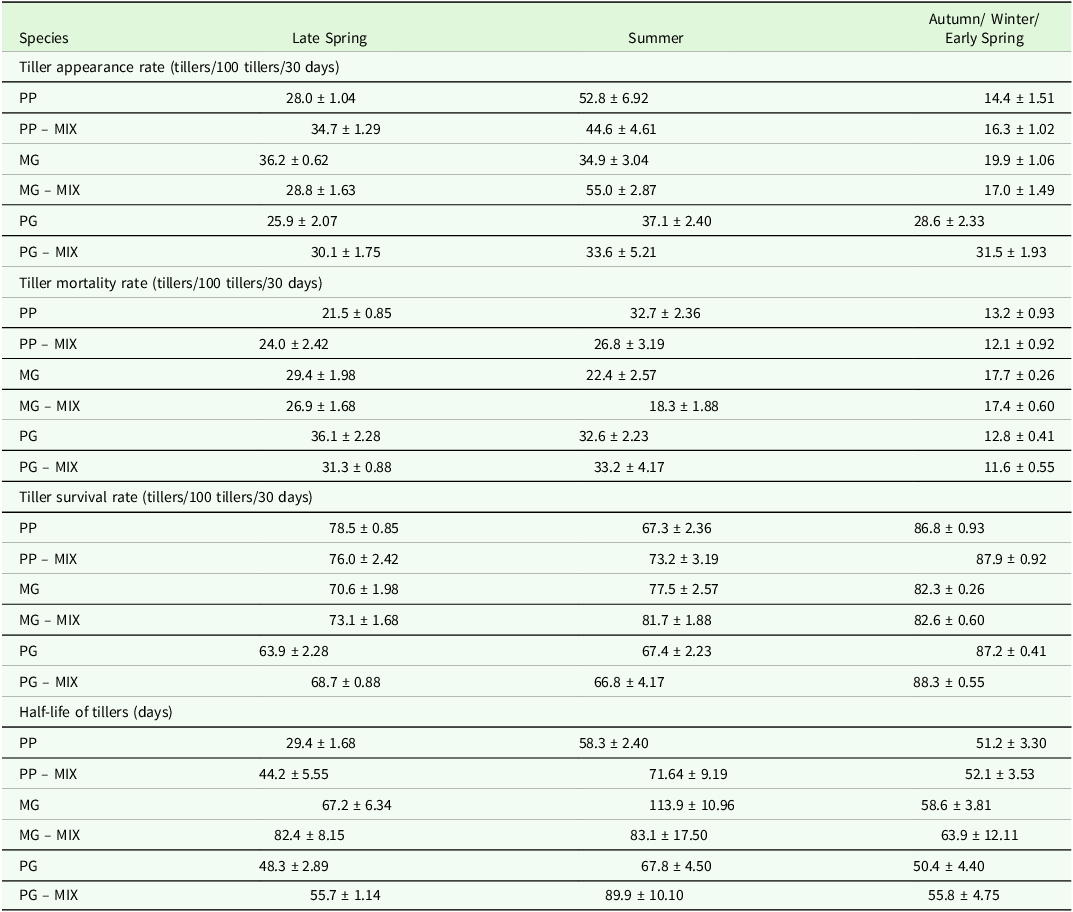
Considering the species when grown in mixture compared to their monocultures, PP showed a higher TAR in late spring (+6.7 tillers/100 tillers/30 days; P = 0.005). In contrast, MG had a lower TAR in late spring (−7.4 tillers/100 tillers/30 days; P = 0.002) and a higher TAR in summer (+20.1 tillers/100 tillers/30 days; P = 0.005) (Table 4). No differences were observed in TDR and TSR for the three species when comparing their growth in mixtures and monocultures. Massai guineagrass had longer-lived tillers in late spring (+15.2 days; P = 0.042) and shorter-lived tillers during summer (−30.8 days; P = 0.039). Still, PG had longer-lived tillers only in late spring (+7.4 days; P = 0.048) while TSR for PP was the same regardless of cultivation method.
Tiller appearance, death and survival rates, and half-life of tillers for Piatã palisadegrass (PP), Massai guineagrass (MG) and Planaltina gambagrass (PG) cultivated as monocultures or as a mixture (MIX) from February 2020 to March 2022, Piracicaba, SP, Brazil. Values represent mean ± standard error (SE), with degrees of freedom (DF = 10)

Tiller population SI
Tiller population SI varied according to treatment (P < 0.010), season of the year (P < 0.001) and treatment × season of the year interaction (P < 0.001). Overall, all treatments showed SI greater than 1. Planaltina gambagrass presented the smallest value in autumn/winter/early spring, although it was still greater than 1 (Table 5). Piatã palisadegrass had greater SI in summer, with no difference between late spring and autumn/winter/early spring. Massai guineagrass had smaller SI in autumn/winter/early spring. Planaltina gambagrass was the only treatment having a SI smaller than 1 (0.89 in late spring). The mixture showed greatest SI in summer, with no difference between autumn/winter/early spring and late spring (Table 5).
Tiller population stability index for Piatã palisadegrass (PP), Massai guineagrass (MG) and Planaltina gambagrass (PG) cultivated as monocultures or as a mixture (MIX) from February 2020 to March 2022, Piracicaba, SP, Brazil. Means with a common uppercase letter in the columns or lowercase letters in the rows are not different (P > 0.050). Values represent mean ± standard error (SE), with degrees of freedom (DF = 6)

When each species in the mixture was compared to its respective monoculture, no contrasting responses were observed compared with those described for the monoculture conditions (Figure 2). The dashed parallel diagonal lines in Figure 2 indicate the tiller population SI. Tiller population was considered stable when SI = 1, decreasing when SI < 1 and increasing when SI > 1. Overall, PP maintained an increasing population during late spring and summer, whereas MG remained relatively stable in late spring before increasing in summer. In contrast, PG tended toward population stability throughout both late spring and summer, except in the monoculture, where it decreased during late spring. In addition, MG showed a more pronounced increase in tiller population during summer when grown in mixture compared to monoculture (Figure 2B).
Population stability diagrams for (A) Piatã palisadegrass (PP), (B) Massai guineagrass (MG) and (C) Planaltina gambagrass (PG) populations cultivated as a monoculture (solid line) or as a mixture (dotted line) throughout the seasons of the year. The dashed parallel diagonal lines indicate the tiller population stability index (TPSI) as a result of combinations between tiller survival rates (TSR) and tiller appearance rates (TAR) according to the following equation: TPSI = TSR + TAR (Adapted from Matthew and Hamilton, Reference Matthew and Hamilton2011).

Discussion
Plant communities in pastures adapt to different frequencies and severities of defoliation to which they are subjected through mechanisms that aim to ensure their longevity and photosynthetic efficiency, with TPD being the structural characteristic that allows for greater flexibility in adjusting canopy LAI by the plant community (Matthew et al., Reference Matthew, Assuero, Black and Hamilton2000). In this context, under the same management conditions, PP presented a greater herbage mass composed of fewer but larger tillers, whereas PG and MG showed greater TPD with lighter tillers and, consequently, smaller herbage mass (Garcia-Carvalho et al., Reference Garcia-Carvalho, Congio, Barro, Silva, Otaviano, Gomes, Mammana, Sbrissia, Duchini, Barbosa, Dias and Da Silva2025). Further, in a concomitant study, Silva et al. (Reference Silva, Da Silva, Otaviano, Gomes, Mammana, Garcia-Carvalho, Sbrissia, Frak and Louarn2025) reported foliage angle as an important trait that distinguished how these grass species were growing. The author observed that MG exhibited a more vertical leaf structure characterized by greater foliage angle, while both PP and PG had smaller foliage angle (more horizontal architecture), allowing for better soil coverage.
Growing in monocultures, PP and MG showed higher TAR and TDR in late spring and summer (because of the greater availability of abiotic growth factors) and lower rates in autumn/winter/early spring, which is consistent with the strategy of capturing more resources during periods of great availability to gain competitive advantage (Cruz et al., Reference Cruz, Goudet and André2002). Conversely, PG exhibited relatively stable TAR throughout the year coupled with lower TDR in autumn/winter/early spring, which resulted in a high TSR. This reflects a resource conservative strategy to gain competitive advantage during less favorable growing periods (Cruz et al., Reference Cruz, Goudet and André2002). Contrasting persistence strategies among different forage grass species were discussed by Matthew et al. (Reference Matthew, Agnusdei, Assuero, Sbrissia, Scheneiter, Da Silva, Michalk, Millar, Badgery and Broadfoot2013). According to the authors, some species display seasonal tillering, influenced by flowering and/or climatic conditions (such as PP and MG in our study), while others exhibit a more vegetative persistence strategy, with continuous tillering more evenly distributed throughout the year, similar to PG in the current study.
All grass species oscillated between higher tiller turnover during the rainy season and higher tiller survival during the dry season when grown in the mixture. The timing of the transition from one strategy to another, especially during spring and autumn, seemed to differ among species, providing evidence of complementarity. Grime (Reference Grime1974) described that, although plants have distinct functionalities, it is unlikely that any plant exhibits characteristics exclusive to a functional group, meaning that a species generally displays intermediate characteristics between groups (Grime, Reference Grime1977). Thus, most forage species can transition between functionalities, at times acting as competitors and/or stress-tolerant, as observed in our study. Additionally, the vertical distribution of species in the sward canopy seemed to favor both PP and PG, especially in late spring and MG during summer, when their TAR was higher relative to their monocultures. When a pasture is composed of different species, the plants in this mixed sward are surrounded by individuals with characteristics different from those in a monoculture, potentially improving the three-dimensional occupation above-ground (Naeem et al., Reference Naeem, Thompson, Lawler, Lawton and Woodfin1994). This indicates architectural complementarity among plant species, as described by Spehn et al. (Reference Spehn, Joshi, Schmid, Diemer and Körner2000). However, botanical heterogeneity can also increase shading for slow-growing and/or shorter species, intensifying light competition. Thus, as the pastures were still recovering in late spring and consequently had fewer dense tillers (more light reaching the canopy base), PP and PG thrived. However, after full recovery during summer, MG, which has a greater leaf angle and a higher leaf elongation rate (Silva et al., Reference Silva, Da Silva, Otaviano, Gomes, Mammana, Garcia-Carvalho, Sbrissia, Frak and Louarn2025), was competitively favored for capturing and utilizing resources.
When plant nutrient demands are met, competition for light becomes the main growth-limiting factor, as light not only provides energy for photosynthesis, but also regulates plant development and growth through receptors sensitive to different light intensities and spectral wavelengths. Thus, changes in light characteristics due to shading influence plant physiology and modify its functional aspects (Sbrissia et al., Reference Sbrissia, Duchini, Zanini, Santos, Padilha and Schmitt2018). In the present study, although nutrient availability was not limiting, competition for light at the individual tiller level did not seem to be intense enough to affect tillering dynamics of grass species, as those cultivated in the mixture exhibited dynamics similar to those cultivated as monocultures. However, it appeared to be sufficient to generate differences in growth and perennation pathways among species, as discussed above.
Biodiversity increases the temporal fluctuations and primary production of each species in a mixture but reduces these variabilities in the plant community (Tilman et al., Reference Tilman, Reich and Knops2006; Hector et al., Reference Hector, Hautier, Saner, Wacker, Bagchi, Joshi, Scherer-Lorenzen, Spehn, Bazeley-White, Weilenmann, Caldeira, Dimitrakopoulos, Finn, Huss-Danell, Jumpponen, Mulder, Palmborg, Pereira, Siamantziouras, Terry, Troumbis, Schimid and Loreau2010). Seasonal variations in the PP and MG populations between late spring and summer resulted in small temporal fluctuations in the mixture. In addition, the relatively stable tillering of PG and the high TSR for all species during less favorable growth periods reduced tillering rate variations, allowing greater species population stability. However, they are not sufficient to generate greater productive stability (i.e., less intra-annual variation), as reported in a concomitant study (Garcia-Carvalho et al., Reference Garcia-Carvalho, Congio, Barro, Silva, Otaviano, Gomes, Mammana, Sbrissia, Duchini, Barbosa, Dias and Da Silva2025). Nevertheless, the plant population showed less variation in the tiller age range. In addition to the responses discussed above, no variations were observed in TSR and TDR in the mixture compared to their respective monocultures. For all species in the mixture, the highest TSR was recorded in autumn/winter/early spring, which ensured population stability during this period. According to Matthew et al. (Reference Matthew, Assuero, Black and Hamilton2000), tiller population stability and pasture persistence can occur through two main pathways: high TAR and/or high TSR. Our results showed that grass species alternated between these main pathways depending on the growth conditions (i.e., weather and nutrient supply). Under less favorable conditions, such as those experienced during autumn/winter/early spring, the strategy of resource conservation by maintaining a higher TSR was predominantly used as the main adaptive mechanism to compensate for the lower TAR. For temperate grass species grown in monocultures or mixed swards, Duchini et al. (Reference Duchini, Guzatti, Echeverria, Américo and Sbrissia2018) reported that the cultivation method did not affect the population stability of Arrhenatherum elatius L., Dactylis glomerata L., or Festuca arundinacea Schreb., as all three exhibited the same tillering dynamics regardless of whether they were grown in monoculture or mixture.
Conclusions
The association among PG, MG and PP in a mixture, cultivated in a nutrient-rich soil under frequent and non-severe defoliation management, allows for stable populations and tillering dynamics, similar to their monocultures. During autumn/winter/early spring, when resource availability is limited by abiotic factors, pasture population stability was due to the conservation strategy of all species, primarily through the survival of existing tillers. However, when growing resources were no longer limiting factors in late spring and summer, the capture strategy was prioritized for greater species turnover, with pasture stability ensured through high TAR to compensate for the high TDR. Nevertheless, particularly in the mixture, the different timings of transition from one strategy to another resulted in small seasonal variations, where small fluctuations among the species promoted greater population stability, with a less variable TAR and TPD throughout the year.
Acknowledgments
The authors are grateful to Fundação de Amparo à Pesquisa do Estado de São Paulo (FAPESP), Coordenação de Aperfeiçoamento de Pessoal de Nível Superior (CAPES) and University of São Paulo, ‘Luiz de Queiroz’ College of Agriculture (USP/ESALQ) for the support and structure that made this research possible. This paper is a chapter of the DSc thesis of L.F. Garcia-Carvalho (2023): Association of perennial tropical forage grasses: herbage production and stability and dynamics of tiller population. DSc Thesis, University of São Paulo, Brazil. (Available in Portuguese at: https://doi.org/10.11606/T.11.2023.tde-01112023-174325).
Author contributions
LFGC contributed to the conceptualization, methodology, formal analysis, investigation, data curation, writing – original draft, writing – review and editing and visualization. GFSC contributed to the conceptualization, writing – original draft and writing – review and editing. GCB contributed to the investigation. AMSS, EKSO, CMG and AFM contributed to the methodology and investigation. AFS contributed to the conceptualization, methodology, supervision and writing – review and editing. RAB contributed to the conceptualization, methodology and supervision. PGD and CTSD contributed to the formal analysis. SCS contributed to the conceptualization, methodology, formal analysis, investigation, resources, writing – review and editing, supervision, project administration and funding acquisition.
Funding statement
This study was supported by the São Paulo Research Foundation (scholarships 2019/27582-6 and 2021/01848-0; and grant 2020/06644-0) and Coordination for the Improvement of Higher Education Personnel (finance code 001). The funding agencies had no role in the design, analysis, or writing of this article.
Competing interests
The authors declare there are no conflicts of interest.
Ethical standards
Not applicable.