1 Introduction
Sediment transport remains one of the unresolved problems in hydraulic engineering, due to the difficulties in relating the physics of macroscopic events to the description of particle motion at the grain scale. Its understanding is pivotal for tackling remaining issues in environmental engineering such as morphological evolution, reservoir sedimentation and pollutant dispersion. In recent years, there has been a growing effort towards understanding the physics of grain–fluid mixtures where the number of particles is large enough to trigger collective effects on the grains (Leonardi et al. Reference Leonardi, Cabrera, Wittel, Kaitna, Mendoza, Wu and Herrmann2015, Reference Leonardi, Wittel, Mendoza, Vetter and Herrmann2016). This has been done both in simulations (Singh, Sandham & Williams Reference Singh, Sandham and Williams2007; Leonardi et al. Reference Leonardi, Wittel, Mendoza and Herrmann2014; Schmeeckle Reference Schmeeckle2014; Vowinckel et al. Reference Vowinckel, Jain, Kempe and Fröhlich2016) and experiments (Blois et al. Reference Blois, Best, Christensen, Hardy and Smith2013). However, the research at the grain-scale level has been hampered by the difficulties in resolving the fluid flow in the small spaces between adjacent particles (Breugem & Boersma Reference Breugem and Boersma2005).
There is now ample evidence that porosity plays an important role in the development of wall-bounded turbulence (Zagni & Smith Reference Zagni and Smith1976; Suga et al. Reference Suga, Matsumura, Ashitaka, Tominaga and Kaneda2010). In many channel-flow applications, the bottom boundary of the flow is classically represented as an impermeable wall with prescribed roughness. However, the law of the wall for an impermeable rough surface has limited applicability if the porosity of the bed exceeds a critical value (Zippe & Graf Reference Zippe and Graf1983; Breugem, Boersma & Uittenbogaard Reference Breugem, Boersma and Uittenbogaard2006). The otherwise ubiquitous high- and low-speed streaks close to the bed also disappear when porosity becomes important. Less clear is the contribution of the flow in the pores to the development of the lift and drag forces that are the primary responsible factors for the triggering of transport events. Surface flow has been shown in the past to induce perturbation to the subsurface flow within a highly permeable bed (Pokrajac & Manes Reference Pokrajac and Manes2009). At a much larger scale, pressures fluctuations inside the bed are known to be able to dislodge large concrete elements at the base of dam spillways (Armenio, Toscano & Fiorotto Reference Armenio, Toscano and Fiorotto2000). However, at a microscopic level an exact quantification of subsurface turbulent events, and a correlation with the forces experienced by the bed particle, is still missing. It is at this point unclear whether and to which extent the subsurface flow contributes to the build-up of the conditions that lead to grain dislodgement. Since an in-depth reconstruction of the bed is with very few exceptions (Ji et al. Reference Ji, Munjiza, Avital, Xu and Williams2014; Kidanemariam & Uhlmann Reference Kidanemariam and Uhlmann2014; Vowinckel, Kempe & Fröhlich Reference Vowinckel, Kempe and Fröhlich2014) neglected in current modelling techniques, clarifying the role of the fluid within the pores is of vital importance.
In this work we use large eddy simulation (LES) to simulate the flow above and inside a particle bed composed of spherical beads. The spheres are fully resolved and are arranged in a cubic pattern, a choice that aims at mimicking the porous nature of a loose granular bed, while at the same time artificially maximizing the communication between the pores. This highly idealized condition and enhanced porosity make the results obtained with this test case not directly generalizable to real granular beds. However, the approach allows us to magnify the interactions between the pores and surface flow, thus providing insight into the mechanism of mutual influence.
The use of LES allows for a complete resolution of the flow both within and outside of the granular bed. A very similar setting has been used in the past for experiments in a laboratory channel by Pokrajac & Manes (Reference Pokrajac and Manes2009), whose results are the basis for the validation of the numerical outcome of this study. The experiments gave information about the flow only at specific locations, and with decreasing accuracy in the region immediately close to the beads due to the limitations of the measurement system. The goal of this work is therefore to obtain a full description of the mean flow around the beads, and a quantification of the turbulent events happening inside the bed. We further extend the experimental findings by measuring the forces acting on the particles, and determining to which extent they are affected by subsurface turbulence.
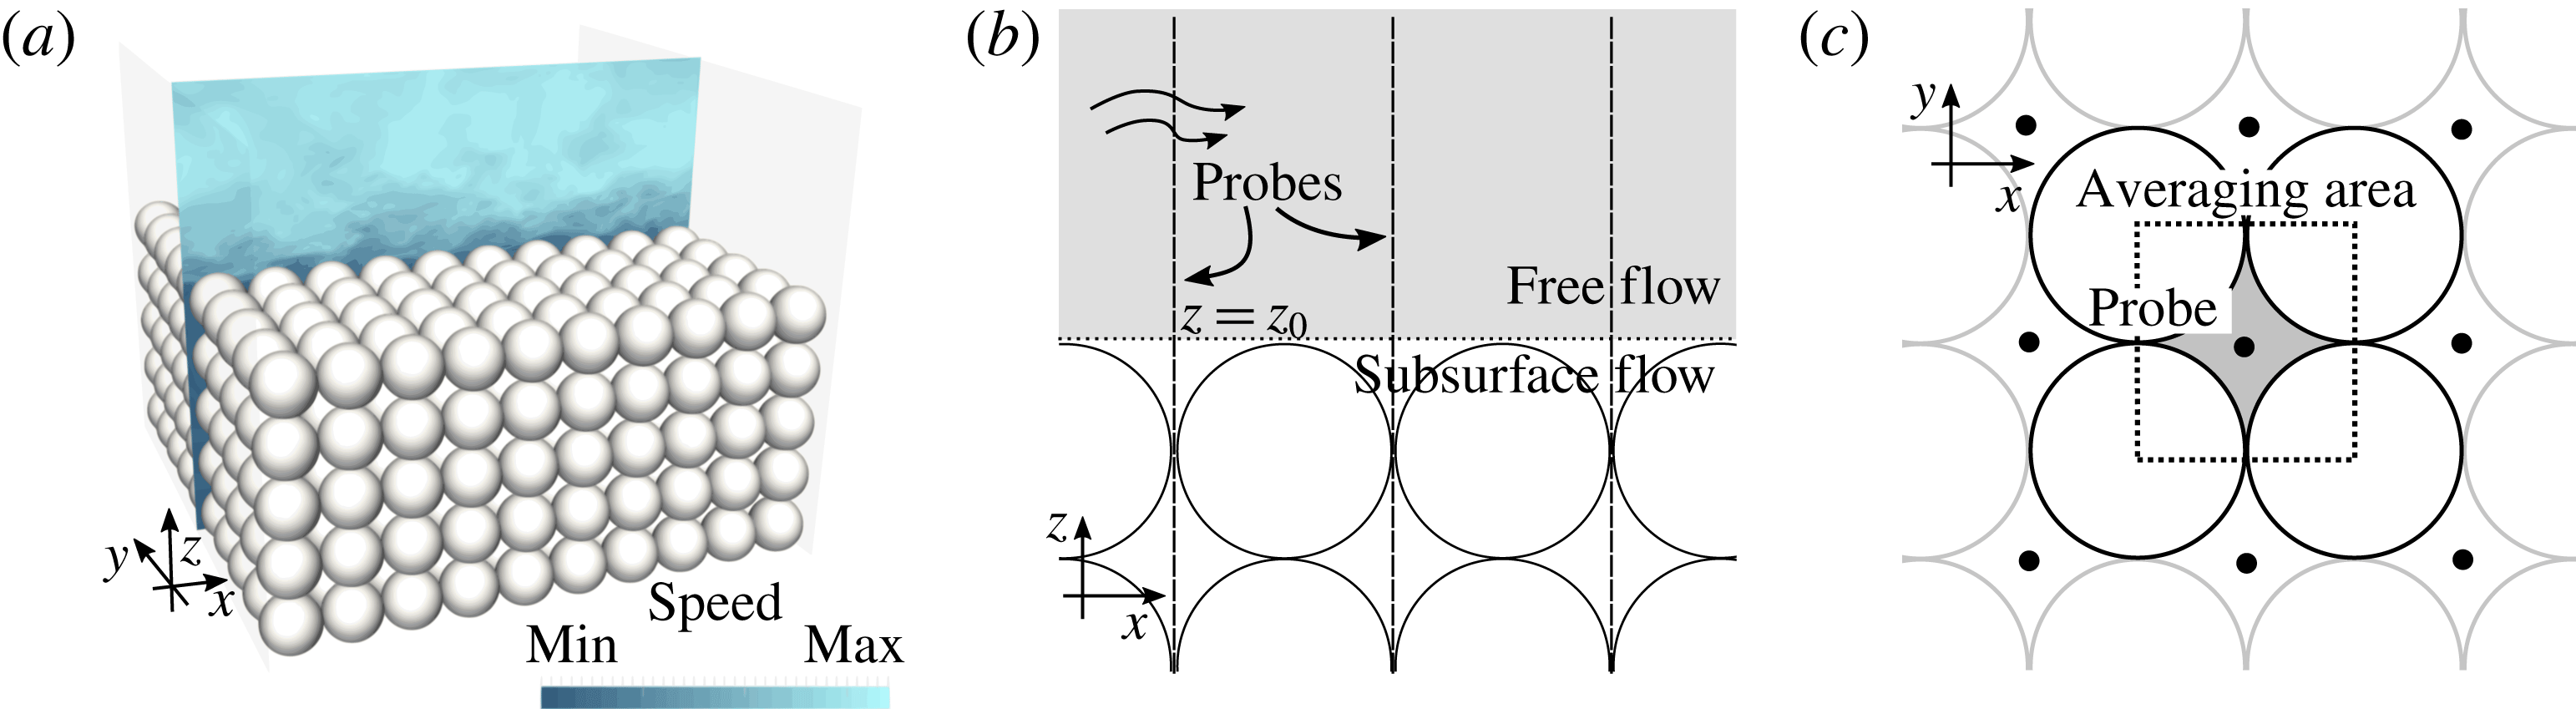
(a) Illustration of the study case. Description of the probe lines and of the averaging area viewed (b) from the side and (c) from the top.

2 Simulation of flow over an array of spheres
The simulation geometry follows as closely as possible the experimental set-up of Pokrajac & Manes (Reference Pokrajac and Manes2009). A porous bed composed of five layers of spherical beads of diameter
 $D=12~\text{mm}$
is topped by a free-flow region of height
 $h=3.5D$
, see figure 1(a). The numerical method is based on LES-COAST, an LES solver which has been extensively validated for wall-bounded turbulence (Falcomer & Armenio Reference Falcomer and Armenio2002; Napoli, Armenio & De Marchis Reference Napoli, Armenio and De Marchis2008), complex geometries (Roman et al.
Reference Roman, Stipcich, Armenio, Inghilesi and Corsini2010) and for sediment transport problems (Dallali & Armenio Reference Dallali and Armenio2015; Kyrousi et al.
Reference Kyrousi, Leonardi, Roman, Armenio, Zanello, Zordan, Juez and Falcomer2018). For this case, the eddy viscosity has been computed using the Lagrangian dynamic procedure described by Armenio & Piomelli (Reference Armenio and Piomelli2000) and based on the dynamic model of Meneveau, Lund & Cabot (Reference Meneveau, Lund and Cabot1996).
The beads are represented as spherical particles through an immersed-boundary technique. A specific description of the employed numerical framework has been detailed by Roman et al. (Reference Roman, Stipcich, Armenio, Inghilesi and Corsini2010) and references therein. This approach prescribes the velocity at the first point off the particle, which is located at distance from the solid surface
 $d$
. Here, the forcing velocity
 $u_{I}$
is computed using a wall function:
 $$\begin{eqnarray}u_{I}=\left\{\begin{array}{@{}ll@{}}\displaystyle u_{\unicode[STIX]{x1D70F}}\left(\frac{1}{\unicode[STIX]{x1D705}}\log \left(\frac{\text{d}u_{\unicode[STIX]{x1D70F}}}{\unicode[STIX]{x1D708}}\right)+B\right) & \displaystyle \text{if }\frac{\text{d}u_{\unicode[STIX]{x1D70F}}}{\unicode[STIX]{x1D708}}\geqslant 11\\ \displaystyle \frac{\text{d}u_{\unicode[STIX]{x1D70F}}^{2}}{\unicode[STIX]{x1D708}} & \displaystyle \text{if }\frac{\text{d}u_{\unicode[STIX]{x1D70F}}}{\unicode[STIX]{x1D708}}<11,\end{array}\right.\end{eqnarray}$$
with
 $\unicode[STIX]{x1D705}$
the von Kármán constant and
 $B=5.0$
. The local friction velocity
 $u_{\unicode[STIX]{x1D70F}}$
is obtained by applying the law of the wall between the particle surface and the closest fluid points. The complete description of this procedure can be found in Roman, Armenio & Frohlich (Reference Roman, Armenio and Frohlich2009). However, the convoluted boundary limits the applicability of the full law of the wall, since porosity and roughness disrupt the analytical assumption under which it is derived. For this reason, the grid resolution has been calibrated in this work to yield everywhere
 $\text{d}u_{\unicode[STIX]{x1D70F}}/\unicode[STIX]{x1D708}<11$
, therefore reducing the wall function to a simple linear interpolation. In fact, everywhere except where the particles are in direct contact with the free flow, the immersed-boundary points are located deep in the laminar sublayer (
 $\text{d}u_{\unicode[STIX]{x1D70F}}/\unicode[STIX]{x1D708}<2$
).
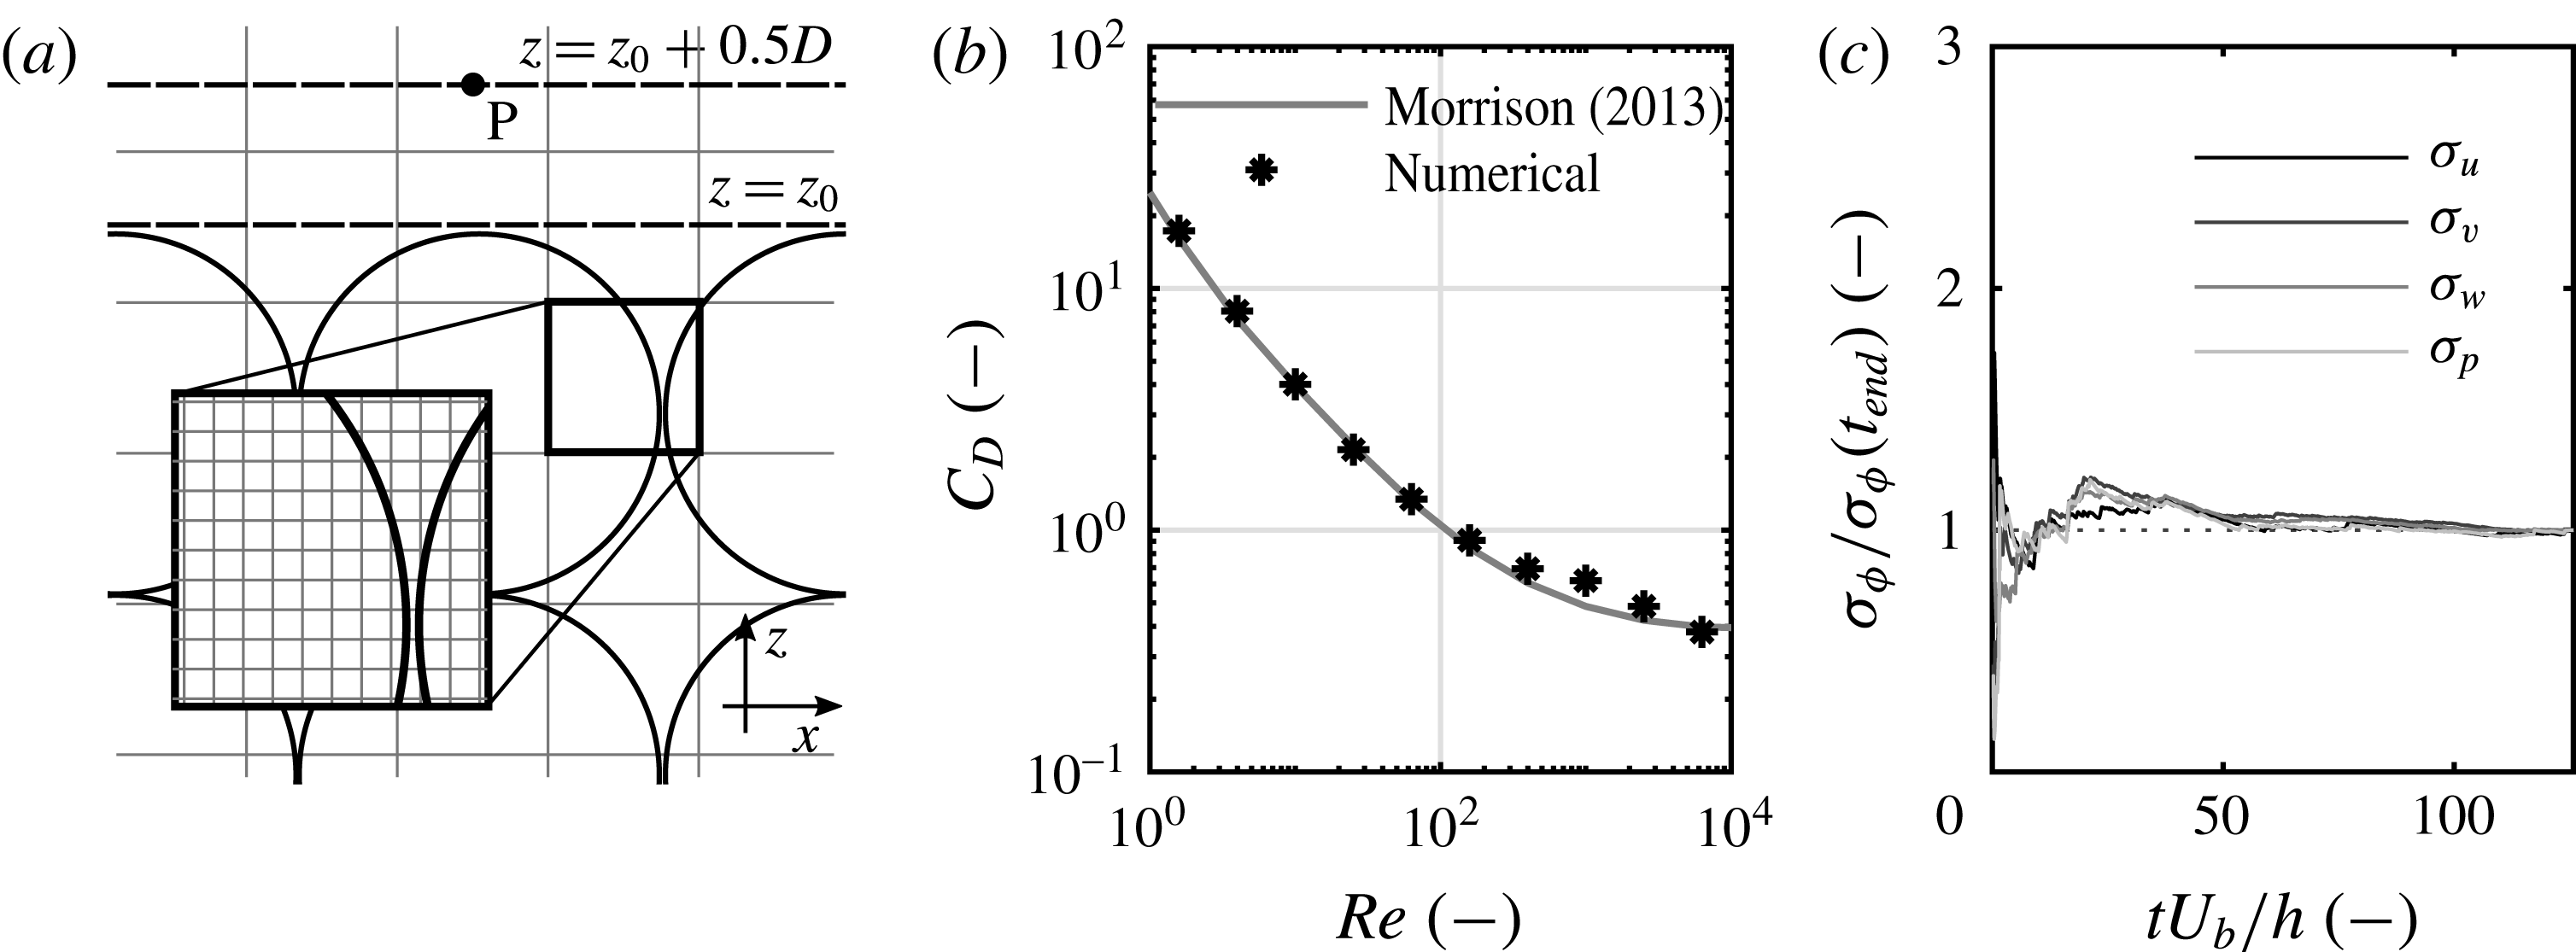
Details of the simulation procedure. (a) The discretization grid, illustrated using
 $10\times 10$
element boxes for clarity. One box is magnified to show the actual grid. (b) Drag coefficients computed using the test simulation with a single particle immersed in a channel flow. (c) Convergence of second moments during the simulation, computed using (3.1) at point P, as shown in (a).

The flow is driven by an imposed pressure gradient in
 $x$
:
 $g_{x}=0.0245~\text{m}~\text{s}^{-2}$
. This yields an average velocity
 $U_{b}=0.37~\text{m}~\text{s}^{-1}$
in the free-flow region, and a Reynolds number
 $Re_{h}=U_{b}h/\unicode[STIX]{x1D708}=14\,800$
. The friction velocity, obtained by analysis of the linear profile of the Reynolds stresses in the free flow, is
 $u^{\ast }=0.026~\text{m}~\text{s}^{-1}$
. The flow can be therefore characterized by
 $Re^{\ast }=u^{\ast }h/\unicode[STIX]{x1D708}=1060$
and, based on the particle diameter, by
 $Re_{D}=U_{b}D/\unicode[STIX]{x1D708}=4400$
and
 $Re_{D}^{\ast }=u^{\ast }D/\unicode[STIX]{x1D708}=317$
. The grid is shown in figure 2(a) and is overall composed of
 $256\times 256\times 208$
elements, which is compatible with the linear interpolation used for the immersed boundaries. The resolution of the spheres is also dependent upon the number of grid points used to describe their surfaces. With this grid, each particle diameter spans
 ${\sim}25$
elements, which is consistent with the standard found in the literature (Balaras Reference Balaras2004).
This is the first application of the code at a grain-scale level, and a subroutine (which will be described in detail in § 4) has been implemented for the calculation of the forces on the particles. The approach has been validated by reproducing the classical benchmark of the flow past a single sphere. The grid used for the test has a similar discretization to the one used for the main simulation, with a ratio between sphere diameter and grid size of about 25. The obtained drag coefficients have been compared to the experimental law described by Morrison (Reference Morrison2013). A good match has been obtained for particle Reynolds numbers up to
 $10^{4}$
, see figure 2(b).
One of the two main differences with the experiments is the use of periodic boundary conditions on the sides, which allows us to reduce the domain to a box with
 $L_{x}=L_{y}=10D=2.9h$
. This corresponds to 3170 wall units in both streamwise and spanwise directions. The domain size in
 $x$
is short compared to those usually employed in this class of simulations, possibly excluding some very large structures. In the literature
 $L_{x}\geqslant 6h$
is recommended (Kim, Moin & Moser Reference Kim, Moin and Moser1987; Fröhlich et al.
Reference Fröhlich, Mellen, Rodi, Temmerman and Leschziner2005), which could not be reached with the available computational resources. It is however true that good results have been obtained for plane channel flows also with sub-optimal grids. For example, Fureby et al. (Reference Fureby, Gosman, Tabor, Weller, Sandham and Wolfstein1997) obtained with LES simulations results comparable to direct numerical simulation data using a grid spanning 1580 and 750 wall units, respectively in the streamwise and spanwise directions. For the case described here, as will be discussed in detail in the next section, the simulation well captures the relevant aspects observed experimentally by Pokrajac & Manes (Reference Pokrajac and Manes2009). This is mainly because our domain length is much longer than the mean length of streaks, quantified in the literature as of the order of 2000 wall units (Smith & Metzler Reference Smith and Metzler1983). Also, the flow dynamics in that part of the domain is known to be weakly correlated to that in the outer layer, and more closely linked to the turbulent structures in the buffer layer (Jiménez & Moin Reference Jiménez and Moin1990), which seem to be resolved reasonably well. The second difference from the experiments is the use of a free-slip condition (
 $\unicode[STIX]{x2202}u/\unicode[STIX]{x2202}z=0$
,
 $\unicode[STIX]{x2202}v/\unicode[STIX]{x2202}z=0$
,
 $w=0$
) to reproduce the free surface, an approximation justified by the low Froude number
 $Fr=0.53$
(Ooi, Constantinescu & Weber Reference Ooi, Constantinescu and Weber2009).
3 Surface and subsurface flow
The bed permeability in this setting is very high compared to natural sediment beds (
 $K=2.08\times 10^{-6}~\text{m}^{2}$
). In addition to this, the pores are aligned along every principal direction, enhancing the transfer of momentum between free and subsurface flow. The alignment of the pores in the streamwise direction gives rise to a relatively strong subsurface flow. Each row of aligned pores can be imagined as a pipe, where an essentially one-directional low-
 $Re$
flow develops.
The first step in understanding the role of permeability in the build-up of forces on the particles is to obtain a clear visualization of the flow structure. As stated in the introduction, a very similar setting has been used by Pokrajac & Manes (Reference Pokrajac and Manes2009), who also derived a mathematical model merging the turbulent boundary layer equations and those for a turbulent flow in a porous medium (Pokrajac & De Lemos Reference Pokrajac and De Lemos2015). The precise mechanism of interaction was however not clear due to the limitations of the experimental apparatus, which only gave information on planar slices.
This section has the double goal of validating the numerical approach by comparing with the experimental measurements, and providing a support to the mean flow pattern hypothesized by Pokrajac & Manes (Reference Pokrajac and Manes2009). To do so, once the flow has reached uniform conditions, statistics are assembled, leading to the generation of a mean flow field
 $(\overline{u},\overline{v},\overline{w})$
. To simplify the visualization of results, velocity and pressure are recorded using the probe lines defined in figure 1(b). Statistics for first-order fluctuations are also collected for pressure and velocity. After the collection of
 $2\times 10^{5}$
samples, and averaging over a total time of about
 $t=120~h/U_{b}$
, all statistics have converged. Figure 2(c) shows the convergence of the second statistical moments for all field variables at a point located right above the particles at
 $(z-z_{0})/D=1/2$
(
 $P$
in figure 2
a). The second moment for the streamwise velocity is computed as
 $$\begin{eqnarray}\unicode[STIX]{x1D70E}_{u}(t)=\sqrt{\mathop{\sum }_{t^{\prime }=0}^{t}(u(t^{\prime })-\overline{u})^{2}},\end{eqnarray}$$
and in a similar fashion for all other variables in figure 2(c). In order to make the results comparable to the experimental values, space averages are also computed. The averaging area is a rectangle in the
 $xy$
plane between the centres of four adjacent spheres (figure 1
c). The spatially averaged statistics are indicated here with
 $\langle \overline{u}\rangle (z)$
. The same is done for every variable of interest.
Mean streamwise velocity
 $\overline{u}$
(a) above the bed and (b) inside the first two layers of pores. (c) Scaled Reynolds stresses above the bed, with the linear interpolation used to compute
 $u^{\ast }$
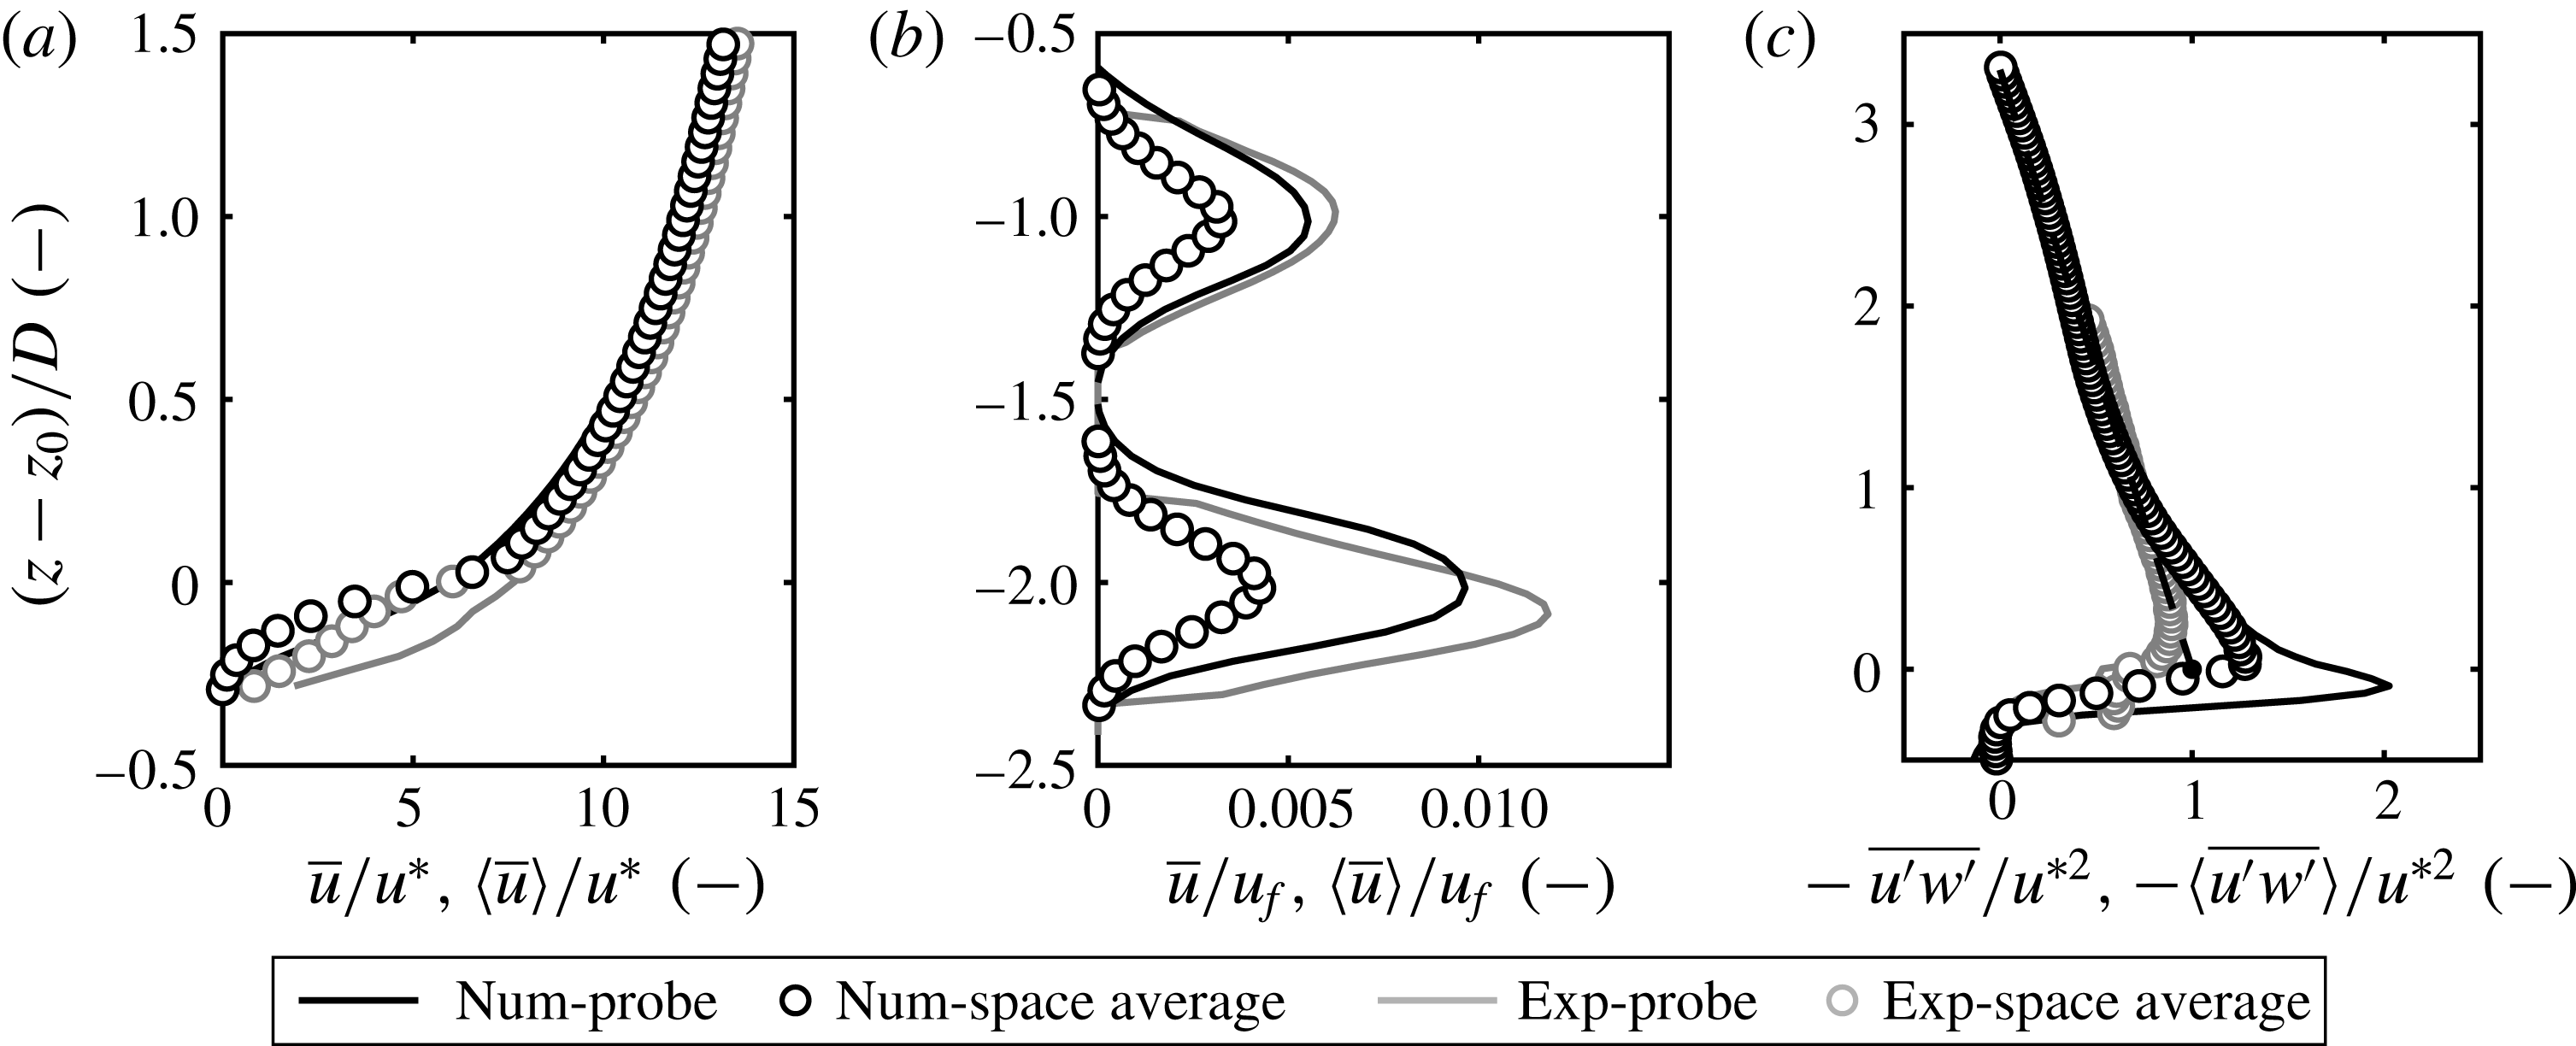
. Black symbols in the plots show the numerical results, whereas grey lines and markers refer to the experiments of Pokrajac & Manes (Reference Pokrajac and Manes2009).

The mean streamwise velocity follows a typical channel-flow profile, at least at a distance from the beads, as shown in figure 3(a). However, the law of the wall for rough surfaces cannot be directly applied, as permeability affects the profile (Manes et al.
Reference Manes, Pokrajac, McEwan and Nikora2009). Close to the beads, form-induced drag alters the profile, which reaches
 $\overline{u}=0$
only below the nominal surface level
 $z_{0}$
.
The results obtained by Pokrajac & Manes (Reference Pokrajac and Manes2009) using particle image velocimetry (PIV) are also shown in the plots. The agreement with experimental data is satisfactory in the free-flow region and in the pore space. At the interface between bed and free flow (around
 $z=z_{0}$
) measuring quantities with precision with PIV becomes difficult due to the high velocity gradients and the vicinity of the solid boundary, a fact that originally motivated the use of numerical tools. Numerical and experimental profiles show here similar trends, but the numerical results exhibit an enhanced peak of
 $\langle \overline{u^{\prime }w^{\prime }}\rangle$
at around
 $z=z_{0}$
, which is a feature observed also by Breugem & Boersma (Reference Breugem and Boersma2005) and Cooper et al. (Reference Cooper, Aberle, Koll and Tait2013) on permeable beds, but not in the reference experiments. The agreement between the two approaches in this area of the flow remains therefore only qualitative.
The profile of
 $\overline{u^{\prime }w^{\prime }}(z)$
, which is shown in figure 3(c), is linear from
 $(z-z_{0})/D=1$
upwards, and shows a peak at around
 $z=z_{0}$
. The extrapolation of the upper part of the profile, where turbulent stresses dominate and the trend is linear, allows to estimate the friction velocity based on
 $\overline{u^{\prime }w^{\prime }}(z)$
with confidence. The extrapolation is shown in (c) with a dashed line.
The flow inside the pores should not be scaled using the friction velocity as the velocity deep inside the bed is independent of the surface flow characteristics. For this reason, in figure 3(b), the flow below the surface is scaled by the reference velocity of a laminar channel flow,
 $u_{f}=g_{x}D^{2}/\unicode[STIX]{x1D708}$
, which is more appropriate. The flow inside the pores exhibits a peculiar profile, with the peak of streamwise velocity in the first pore layer (
 $(z-z_{0})/D=-1$
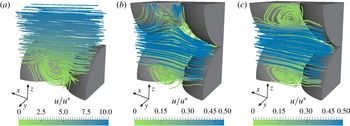
) substantially smaller than in all pores below (Pokrajac, Manes & McEwan Reference Pokrajac, Manes and McEwan2007). Also, the profile in the first pore has a slower convergence to its peak value, which hints at the presence of turbulence at that level. The most straightforward way to explain this profile is by looking at the three-dimensional structure of the flow in the pores, which is illustrated in figure 4. Downstream of the bead top edge the flow detaches, creating a vortex whose size is comparable to that of the pores. The vortex is centred above the pore column, and therefore is able to perturb the flow below, see (a)). The effect of the vortex on the first pore layer is evident from figure 4(b), which shows breaking of symmetry around the
 $xy$
plane, and a sharp deviation of the streamlines towards the positive
 $z$
direction, an effect already hypothesized by Pokrajac & Manes (Reference Pokrajac and Manes2009). The streamlines inside the lower pores show no deviation caused by external interferences (c), and still exhibit a double-symmetric mean flow field, with detachment of small recirculation vortices at all four sides.
Structure of the average flow within and directly above the pores, shown from a section cutting half-way the pore in the
 $xz$
plane. (a) Flow directly above the bed. (b) The first layer of pores, in direct communication with the ambient fluid. Note the streamlines coming in and out of the pore from above. (c) Deep pores.

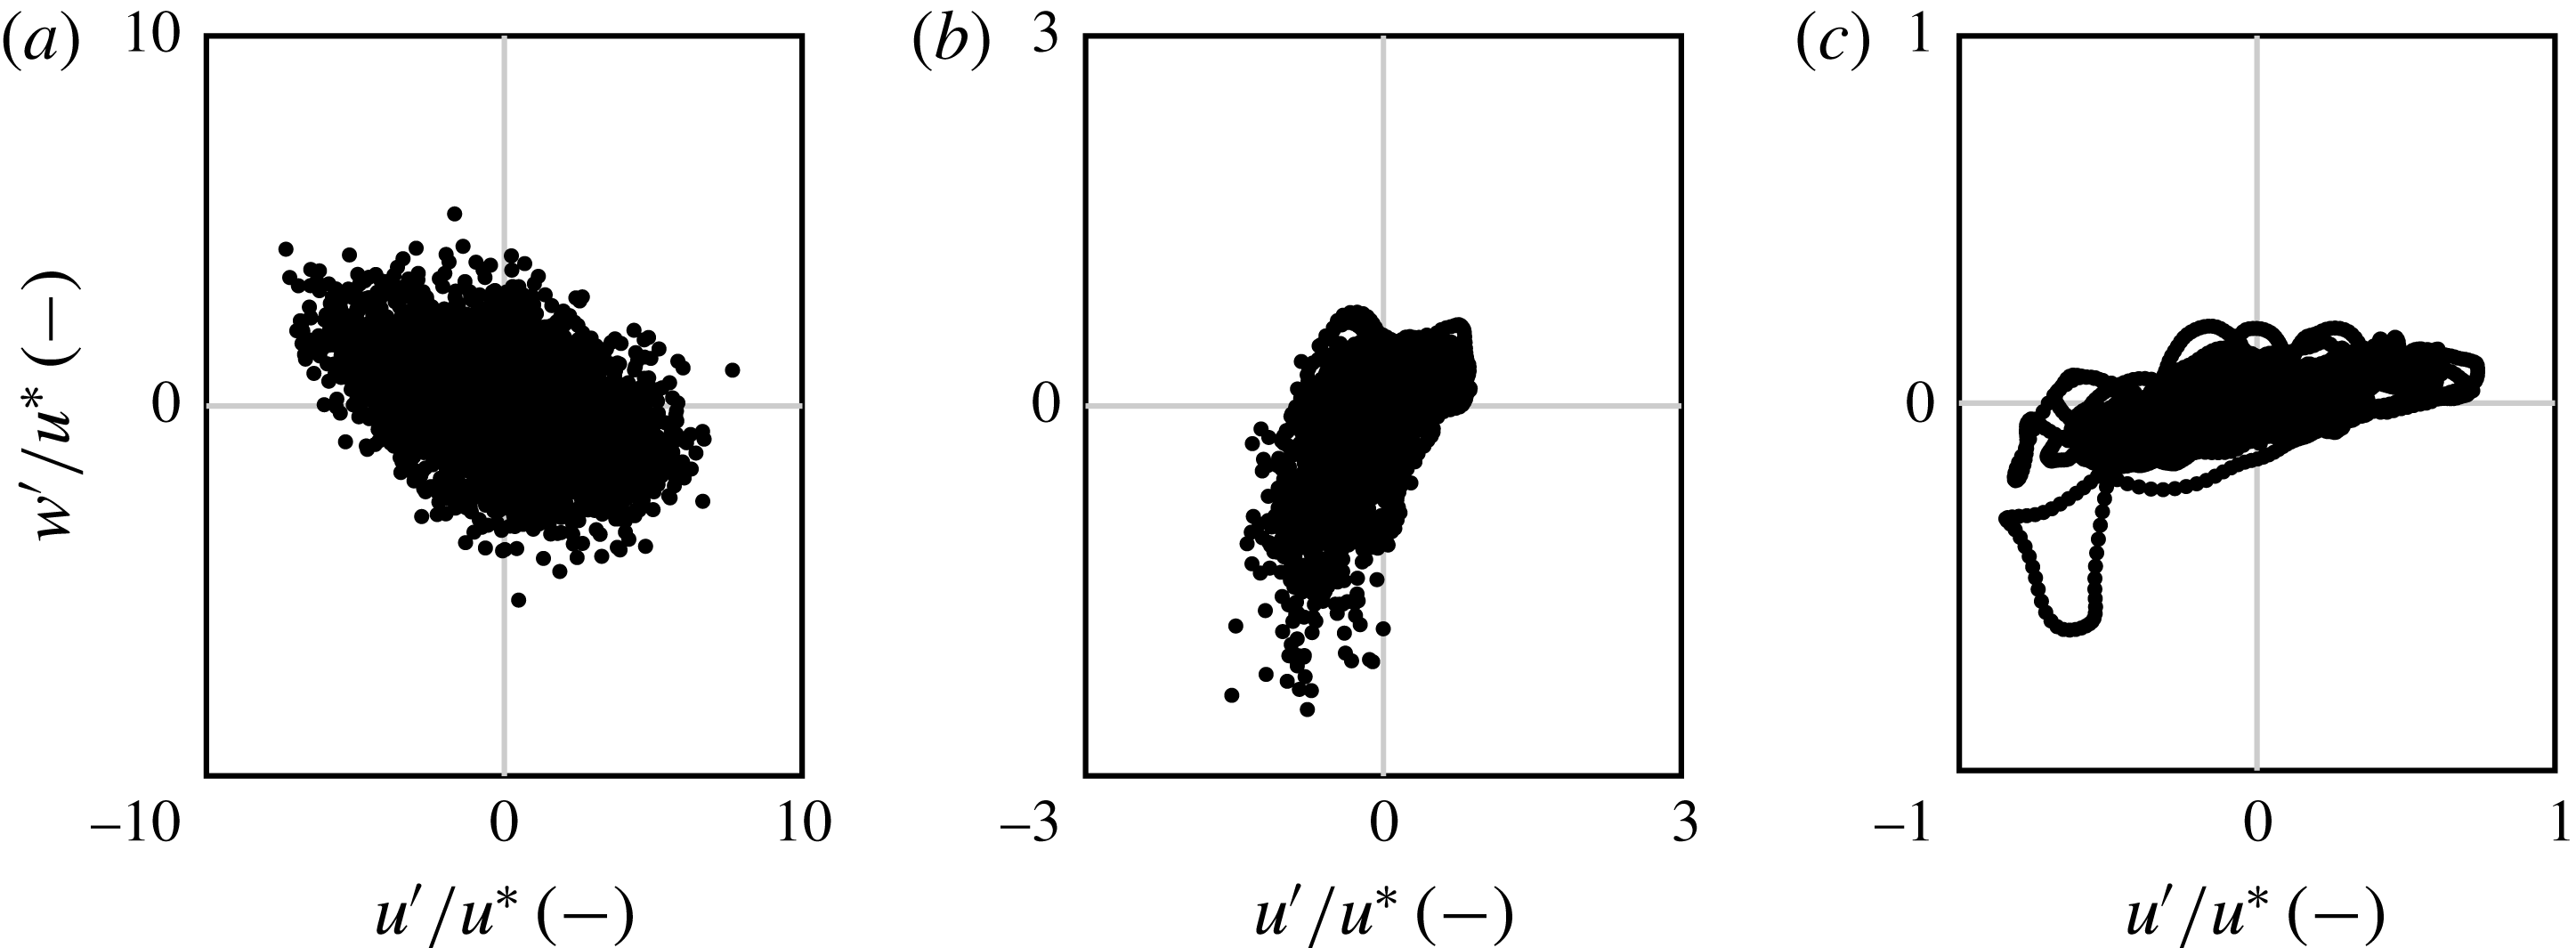
Quadrant analysis of turbulent events recorded (a) at the edge with the surface flow (
 $z=z_{0}$
), (b) at the centre of the first pore (
 $z=z_{0}-D$
) and (c) at the centre of the second layer of pores (
 $z=z_{0}-2D$
). The graphs illustrate the events measured throughout
 $10^{5}$
time steps (
 ${\sim}7~\text{s}$
), but only one point every 200 time steps is shown for clarity.

Because of its link to the free flow, the first pore layer is highly unsteady and experiences events that find their origin in the intensity of the structures that perturb the top vortex. As a consequence, the pore experiences the turbulent events described by the quadrant analysis presented in figure 5(b). The quadrant plot is strikingly dissimilar to those registered in the free flow (a), and in the lower pores (c). It is evident that strong inward currents (
 $w^{\prime }<-u^{\ast }$
) are common in the first pore. The magnitude of such events greatly exceeds the variations in streamwise velocity at the same location. These strong suctions are always associated with a reduction of
 $u$
. This is ultimately the main contribution leading to a lower average flow in the first pore compared to the deeper ones. These events, albeit strong, affect much more weakly the deeper pore layers, where the variations are much smaller and are registered mainly in the streamwise directions, see figure 5(c). In the second layer, the intensity of
 $u^{\prime }$
has already collapsed to less than
 $1/3$
with respect to the first layer.
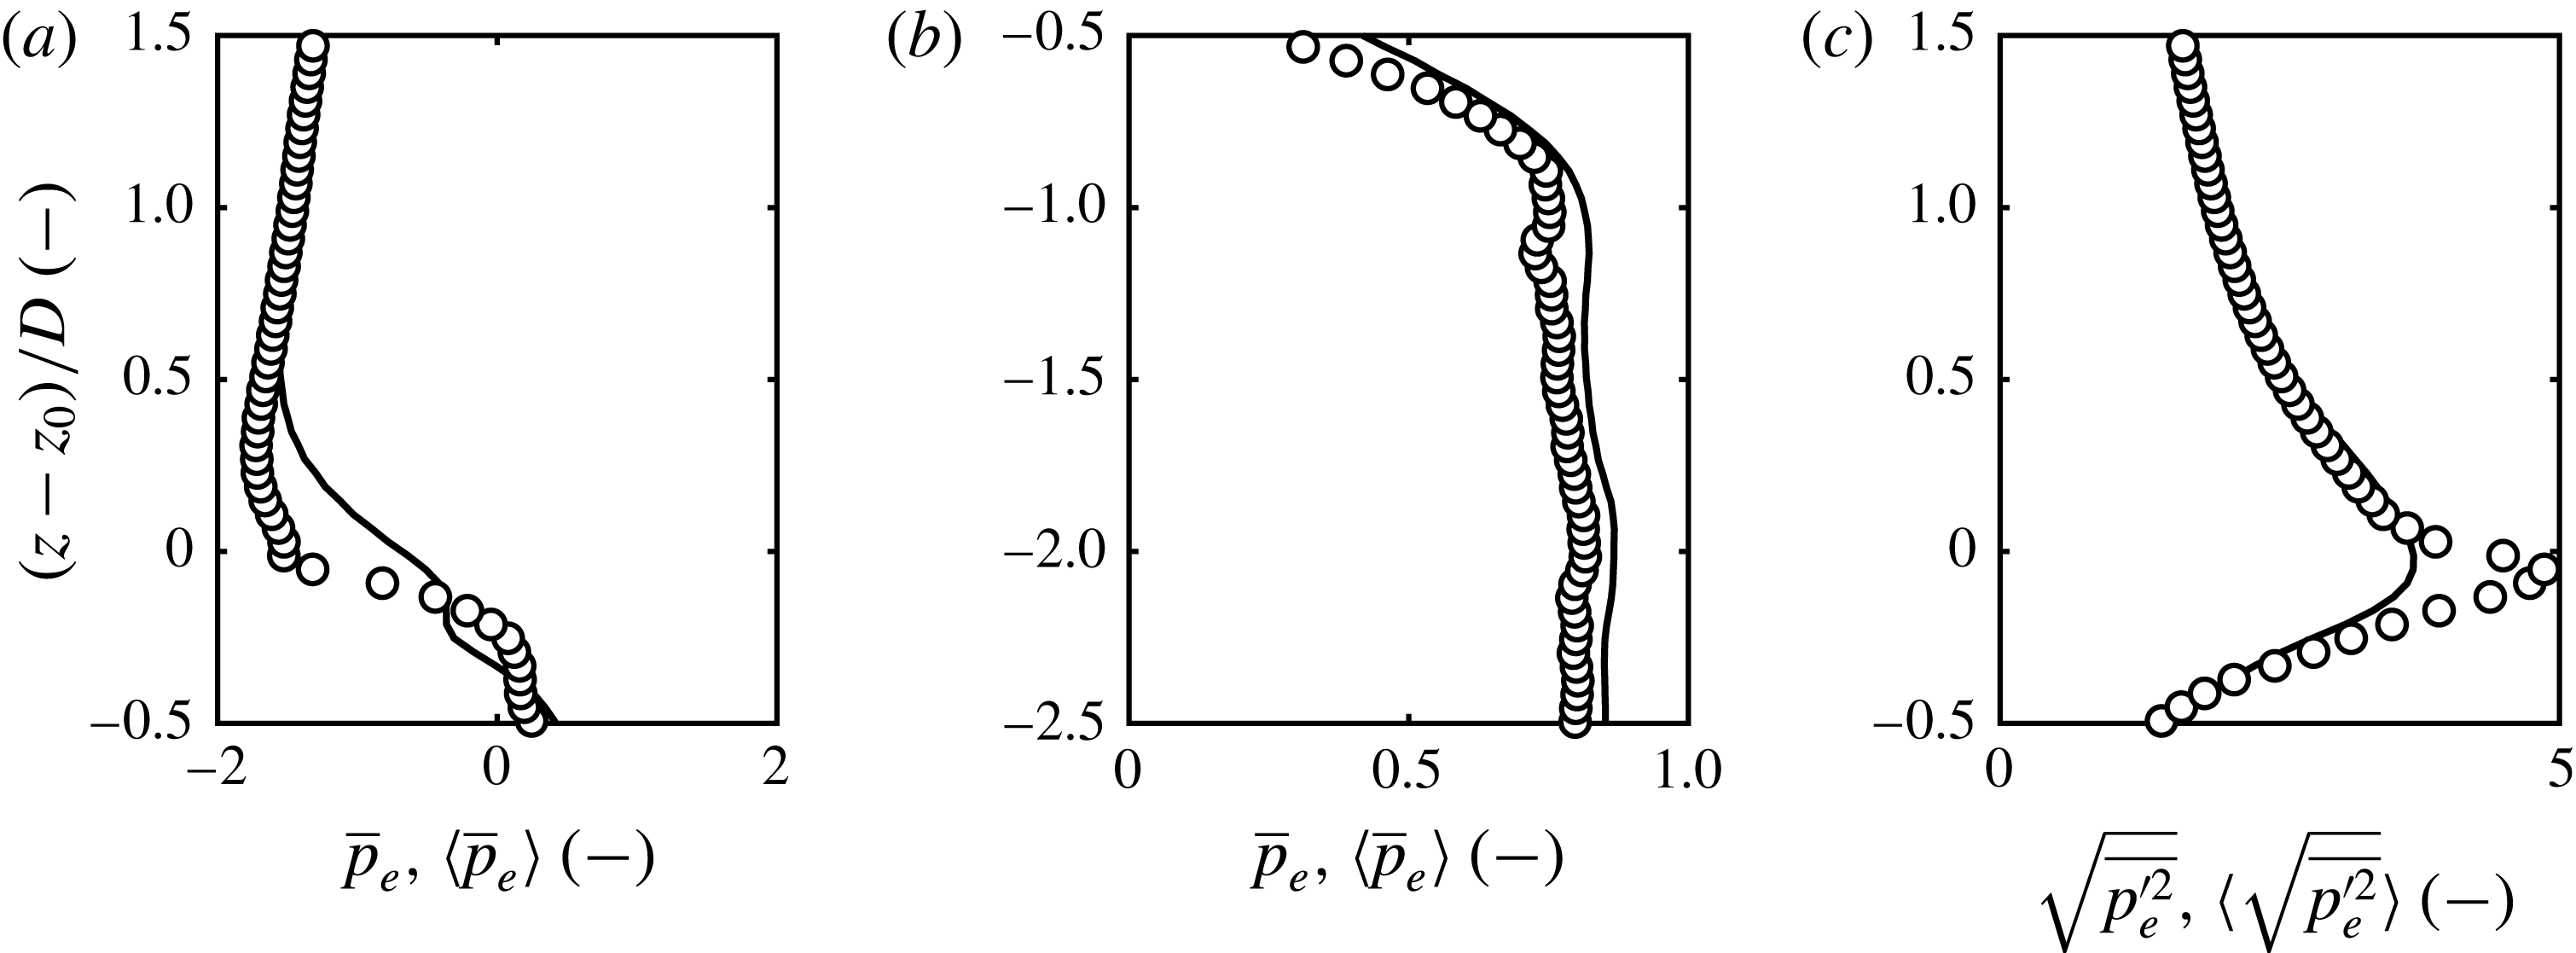
The events registered in the pores must be ultimately linked to instantaneous pressure peaks in order to understand their effect on the particle lift mechanism. Figure 6(a,b) shows the dimensionless excess pressure,
 $$\begin{eqnarray}p_{e}(z)=(p(z)-\unicode[STIX]{x1D70C}_{w}g(h-z))/\unicode[STIX]{x1D70C}_{w}u^{\ast 2},\end{eqnarray}$$
where the hydrostatic component has been removed from the vertical profile
 $p(z)$
in order to make local variations visible. On average, the mean excess pressure is negative above the bed and positive inside, with a sharp drop registered at around
 $z=z_{0}$
. We will show later how this drop equilibrates the mean excess lift force exerted on the top particles. Inside the pores, both double-averaged and probe pressure stabilize quickly to a positive, constant level. The average pressure fluctuations peak at
 $z=z_{0}$
, where they are larger closer to the particle surfaces than on the pore centreline, a fact highlighted by the pore-averaged fluctuations being larger than on the probe. Note that the excess pressure is everywhere quite small compared to the hydrostatic pressure, which is approximately three orders of magnitude larger.
Mean dimensionless excess pressure
 $\overline{p}_{e}$
(a) above the bed and (b) inside the first two layers of pores. (c) Pressure fluctuations at the surface–subsurface interface. Legend as in figure 3.

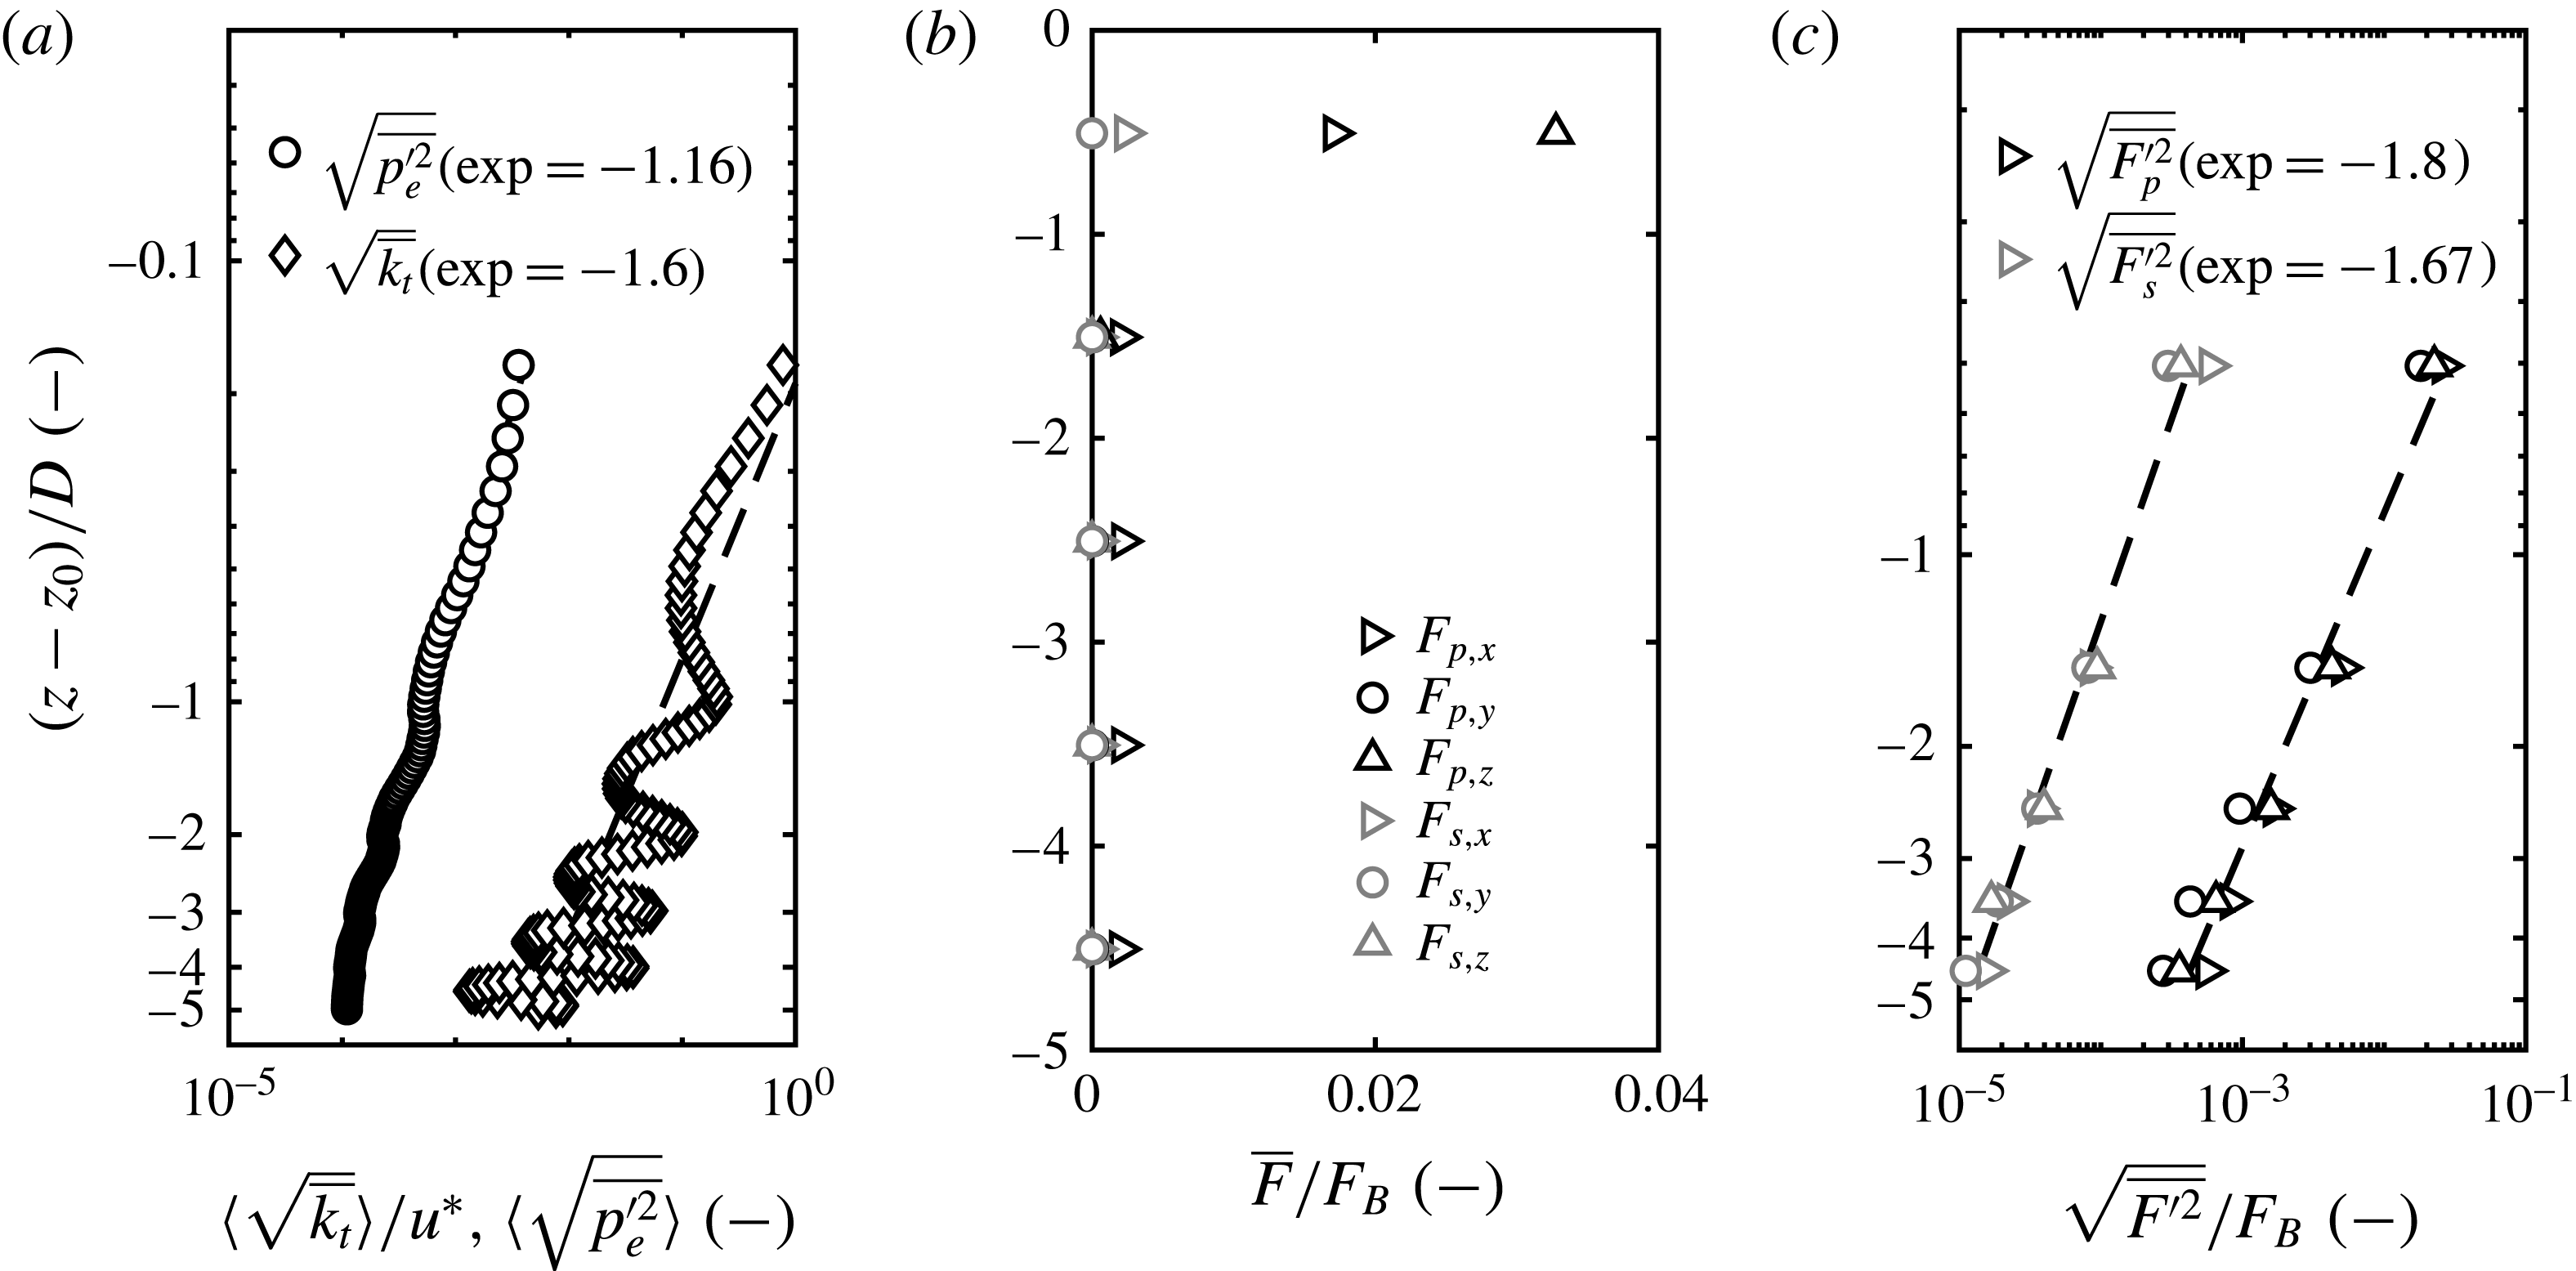
Pressure fluctuations are non-negligible also inside the first pore, as a consequence of the suction/injection events promoted by the free flow. However, they are short lived, as moving deeper inside the bed these fluctuations tend to vanish quickly. This qualitative description can be quantified by analysing the variation of the mean pressure fluctuation
 $\sqrt{p_{e}^{\prime 2}}$
downward from the interface. The simulation shows a clear exponential law with power
 ${\sim}1.16$
for
 $\sqrt{p_{e}^{\prime 2}}(z)$
, see figure 7(a). In this case, pressure fluctuations peak at around
 $z=z_{0}$
, and quickly drop. In fact, pressure fluctuations have been known to decay exponentially inside the bed (Vollmer et al.
Reference Vollmer, de los Santos Ramos, Daebel and Kühn2002), although the variables that control the exponent have not yet been completely defined. This drop is linked to a progressive loss of important turbulent events in the lowest layers. Turbulent kinetic energy,
 $\overline{k}_{t}=(\overline{{u^{\prime }}^{2}}+\overline{{v^{\prime }}^{2}}+\overline{{w^{\prime }}^{2}})/2$
, decays at an even faster rate than
 $\sqrt{p_{e}^{\prime 2}}$
, with
 $\sqrt{\overline{k}_{t}}$
oscillating around a decay law with exponent
 ${\sim}1.6$
. The decay of
 $\overline{k}_{t}$
is spatially less homogeneous due to the peaks registered at every pore layer centreline. The maxima of
 $\overline{k}_{t}$
correspond to the minima of
 $\sqrt{p_{e}^{\prime 2}}$
, but the latter are much less pronounced. Whether or not this is a result of the cubic arrangement of the pores remains unclear, requiring further investigation.
(a) Decay of mean turbulent kinetic energy
 $\overline{k}_{t}$
and mean pressure fluctuations
 $\sqrt{p^{\prime 2}}$
with depth. Both axes are in logarithm scale. (b) Mean shear force
 $\overline{F_{s}}$
and pressure force
 $\overline{F_{p}}$
exerted on the particles, as a function of depth. (c) Shear and pressure force fluctuation intensities on the particles, as a function of depth.

4 The contribution of subsurface flow to drag and lift
The spheres that constitute the porous medium can be imagined as particles resting on a highly idealized river bed. However, the crystalline structure of the bed does not allow a direct comparison with real sediments. Nevertheless, the particles experience hydrodynamic forces of the same nature as those leading to grain dislodgement in sediment transport.
In order to understand whether or not the turbulent events in the pores are able to contribute significantly to the static equilibrium of the particles, it is necessary to compute the forces exerted on the particles at every level. A strong lift force is a necessary condition for a pick-up event to take place, although the temporal sequence of the hydrodynamic interactions seems to play a major role as well (Shih et al. Reference Shih, Diplas, Celik and Dancey2017). Nevertheless, the particles in the current setting are not allowed to move, hence this additional complexity is for the moment not addressed. The Shields number of the system is
 $$\begin{eqnarray}Sh=\frac{\unicode[STIX]{x1D70F}_{w}}{(\unicode[STIX]{x1D70C}_{s}-\unicode[STIX]{x1D70C}_{w})g_{z}D},\end{eqnarray}$$
which, considering a typical density of sediments
 $\unicode[STIX]{x1D70C}_{s}=2400~\text{kg}~\text{m}^{-3}$
, and an average shear at the bottom wall
 $\unicode[STIX]{x1D70F}_{w}=\sqrt{u^{\ast }/\unicode[STIX]{x1D70C}_{w}}$
, yields
 $Sh=0.006$
. For beds composed of uniform particles, the accepted threshold for motion is around
 $Sh=0.06$
(Heald, McEwan & Tait Reference Heald, McEwan and Tait2004; Ferreira et al.
Reference Ferreira, Franca, Leal and Cardoso2012). This identifies the condition as subcritical, and precisely one order of magnitude less than the threshold (Vanoni Reference Vanoni2006). If the spheres were allowed to move, the flow would still not be sufficiently strong to activate transport. Therefore, it is expected that the forces exerted on the particles are consistently lower than their buoyant weight.
The regular packing of the beads allows to estimate the forces on each particle with equal precision. This is done in the LES code easily by integrating the wall shear stress
 $\unicode[STIX]{x1D749}_{w}$
and pressure
 $p_{w}$
across all immersed-boundary points associated with a sphere surface
 $S$
:
 $$\begin{eqnarray}\boldsymbol{F}_{s}=\int _{S}\unicode[STIX]{x1D749}_{w}\,\text{d}A,\quad \boldsymbol{F}_{p}=\int _{S}p_{w}\boldsymbol{n}\,\text{d}A,\end{eqnarray}$$
with
 $\boldsymbol{n}$
the inward-pointing wall normal. The forces are computed as the separate contribution of shear and pressure,
 $F_{s}$
and
 $F_{p}$
, which can be related to form drag and skin friction, respectively. Both forces are scaled by the buoyancy of the beads:
 $$\begin{eqnarray}\boldsymbol{F}_{B}=\frac{\unicode[STIX]{x03C0}}{6}\unicode[STIX]{x1D70C}_{w}D^{3}.\end{eqnarray}$$
The variation of the forces with depth substantiates previous findings in the literature (Liu & Prosperetti Reference Liu and Prosperetti2011). An obvious result is that these forces are much higher for the first layer of spheres than they are for the layers underneath. Figure 7(b) shows the mean forces at every particle layer, divided into vertical and horizontal component, as well as pressure and shear contributions. The forces express the integration over the whole particle surfaces located at a specific level, but are for convenience located in the graph at the centreline of the pertaining layer. The strongest contribution is
 $\overline{F}_{p,z}$
, the lift associated with pressure, which tops at
 ${\sim}0.035F_{B}$
. The lateral component
 $\overline{F}_{y}$
averages zero everywhere. The positive lift equilibrates the pressure drop observed in figure 6(b). Note that a small mean pressure contribution in
 $x$
is still visible for the lower particles, as result of form drag induced by the section variations on the subsurface flow. The force fluctuations are computed in a similar fashion to velocity and pressure, and are shown in figure 7(c). The magnitude of the pressure force fluctuations,
 $\overline{F_{p}^{\prime }}$
, is comparable to that of the mean force for the top particles. For the deeper particles it exceeds their mean value, which is negligible. Skin friction
 $\overline{F_{s}^{\prime }}$
is much smaller everywhere, and decays with an exponent similar to that of the turbulent kinetic energy. All components express, including
 $y$
, a similar exponential decay.
As expected, the value of the forces is too low to dislodge the particles with the conditions taken from the experiments of Pokrajac & Manes (Reference Pokrajac and Manes2009). Speculatively, to obtain a supercritical condition, two paths could be followed, which are briefly discussed here. Flow could be accelerated by exerting a bigger driving force while keeping the same depth. In the laboratory, this would mean a steeper slope. The Reynolds stress at the top of the bed would increase, but whether this necessarily means that turbulence will penetrate deeper in the bed is unclear. It is even less clear how this would affect the forces on the grains. Notably, a higher Shields number could alternatively be achieved in a numerical setting also by lowering the density of the particles without altering the flow. Dislodgement events could then take place with the very same forces registered in the present simulations. The forces can in this respect be analysed also as possible triggers of pick-up events.
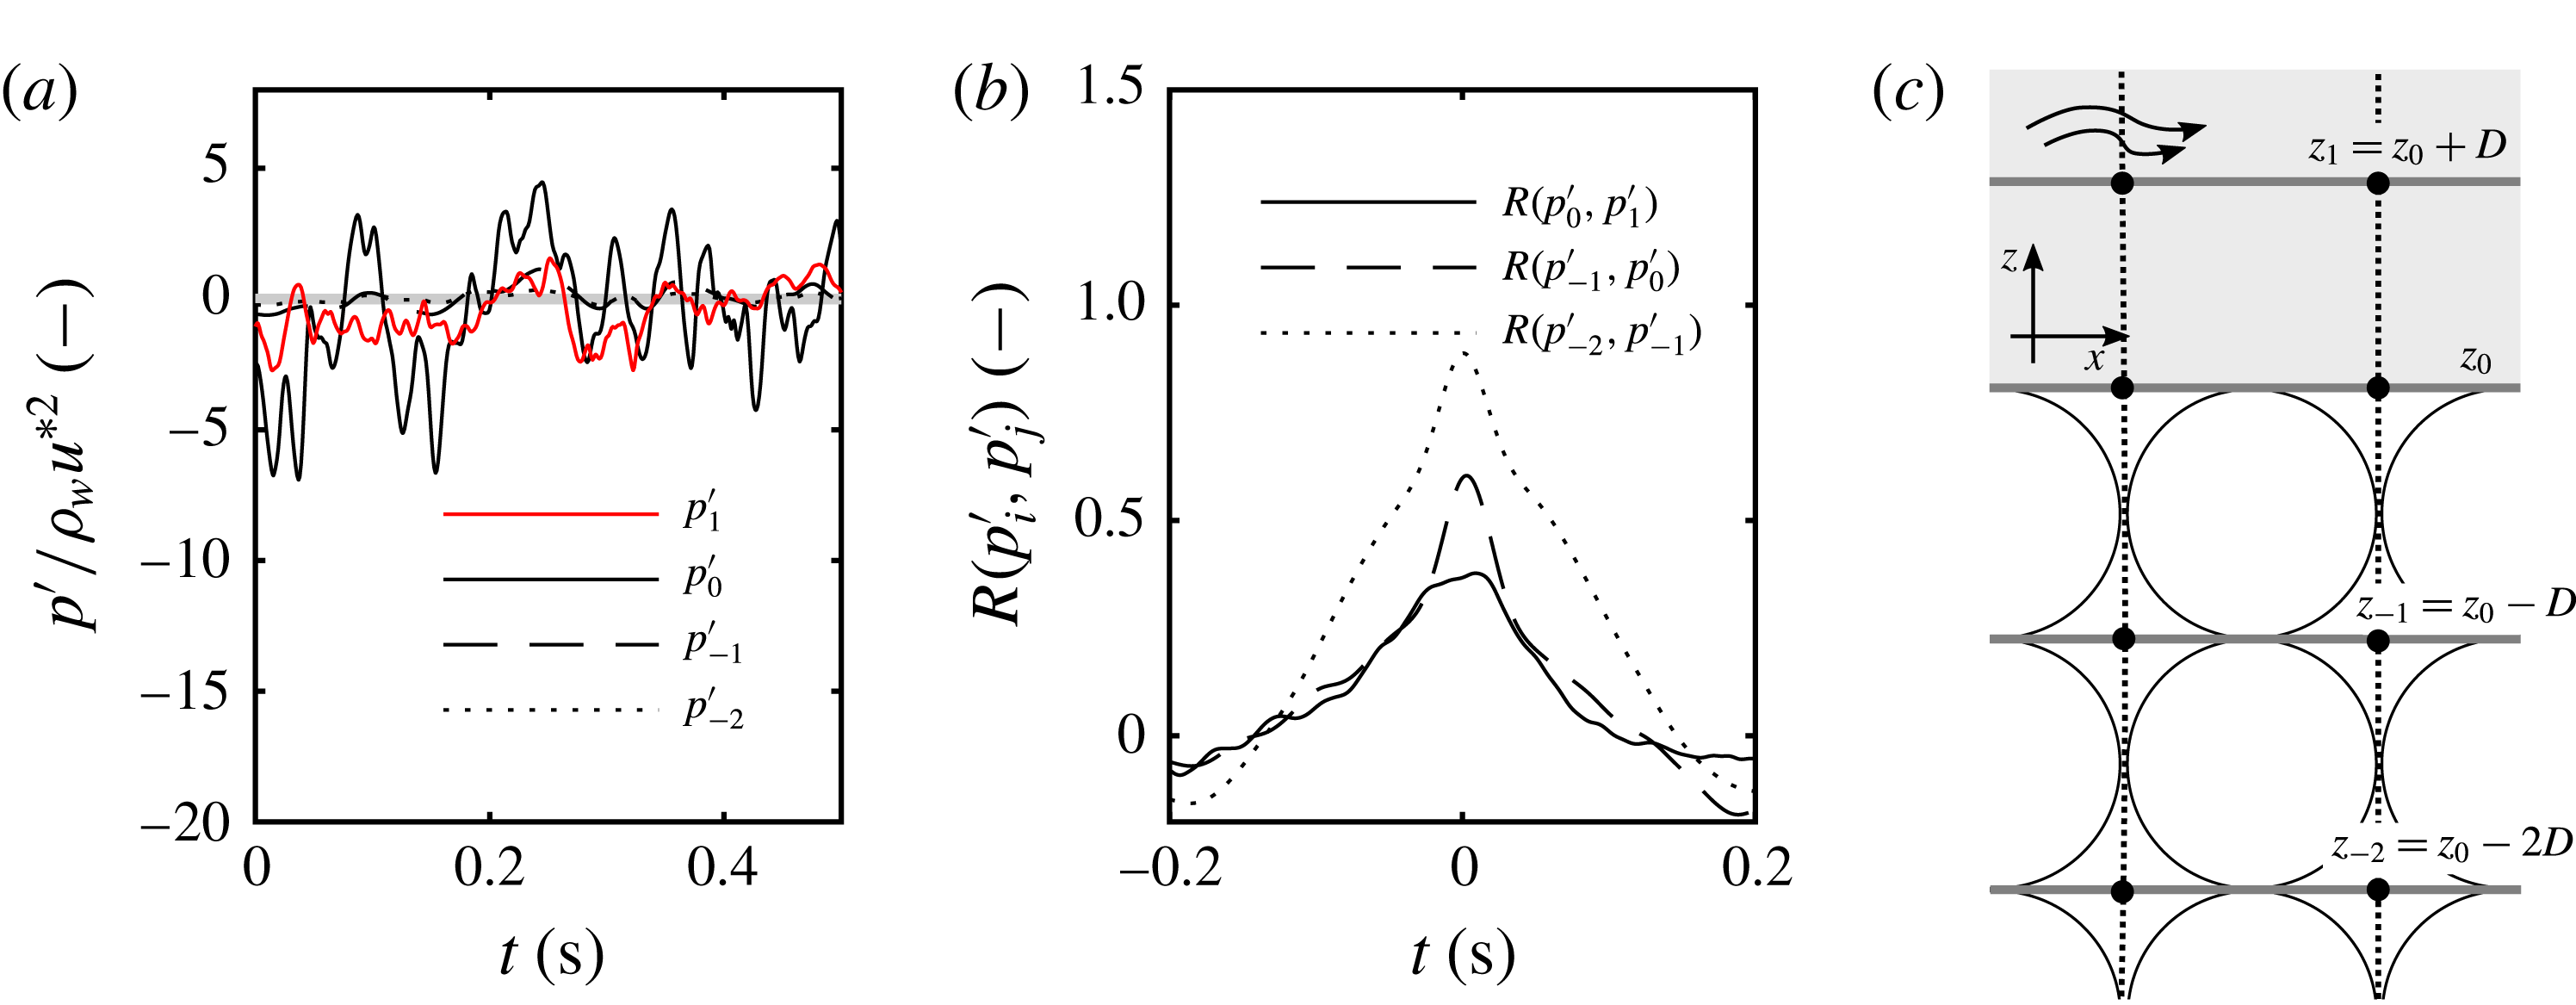
Pressure fluctuations: (a) sample of pressure signals at different pore levels and in the surface flow. (b) Normalized cross-correlations between the signals at different pore levels, and between the pores and the surface flow. (c) Location of the pore levels and of the top central tracer.

Overall, the previous plots indicate that the vertical pressure force fluctuations are relatively strong. To clarify the role of the pressure perturbations inside the bed in the development of lift and drag forces, the time histories of pressure signals are studied. Pressure signals are registered at the centre of a set of pores, which corresponds to the intersection of the probe lines defined in figure 1(a) with the levels defined in figure 8(c). The pressure signals registered at the same level (i.e. same
 $z$
) around a reference particle are ensemble averaged to yield a unified pressure signal:
 $p_{-2}(t)$
for
 $z_{-2}=z_{0}-2D$
,
 $p_{-1}(t)$
for
 $z_{-1}=z_{0}-D$
,
 $p_{0}(t)$
for
 $z=z_{0}$
, and
 $p_{1}(t)$
for
 $z_{1}=z_{0}+D$
. In this way, the signal
 $p_{1}^{\prime }(t)$
represents the events happening over the particles,
 $p_{0}^{\prime }(t)$
those happening exactly at the nominal surface–subsurface interface,
 $p_{-1}^{\prime }(t)$
those in the first pore layer and
 $p_{-2}^{\prime }(t)$
the events at the second pore level.
A sample of the signals registered in this way is shown in figure 8(a). On the interface (
 $p_{0}^{\prime }$
) the signal has a much higher amplitude. The peaks correspond to the oscillations of the recirculation vortex on top of the pore column and to the suction/injection events. The high-frequency oscillations in
 $p_{0}^{\prime }$
are filtered out in the deep-level signals
 $p_{-2}$
and
 $p_{-1}$
, with the bed acting as a low-pass filter, an effect already observed by Zagni & Smith (Reference Zagni and Smith1976). The signals are however clearly in phase, a fact highlighted by the normalized cross-correlation function between two consecutive levels
 $R(p_{i}^{\prime },p_{j}^{\prime })$
, presented in figure 8(b). The signals
 $p_{0}^{\prime }$
,
 $p_{-1}^{\prime }$
, and
 $p_{-2}^{\prime }$
are strongly correlated. Conversely,
 $p_{1}^{\prime }$
is weakly correlated with
 $p_{0}^{\prime }$
(and, in turn, with any signal originating inside the bed). It is clear that the events inside the bed are a reflection of what is happening at the nominal interface (level
 $z=z_{0}$
), the location of the top recirculation vortex. On the other hand, just above the interface a similar signal is not necessarily registered, with
 $p_{1}^{\prime }$
registering strong negative and positive events that do not find correspondence in the subsurface flow.
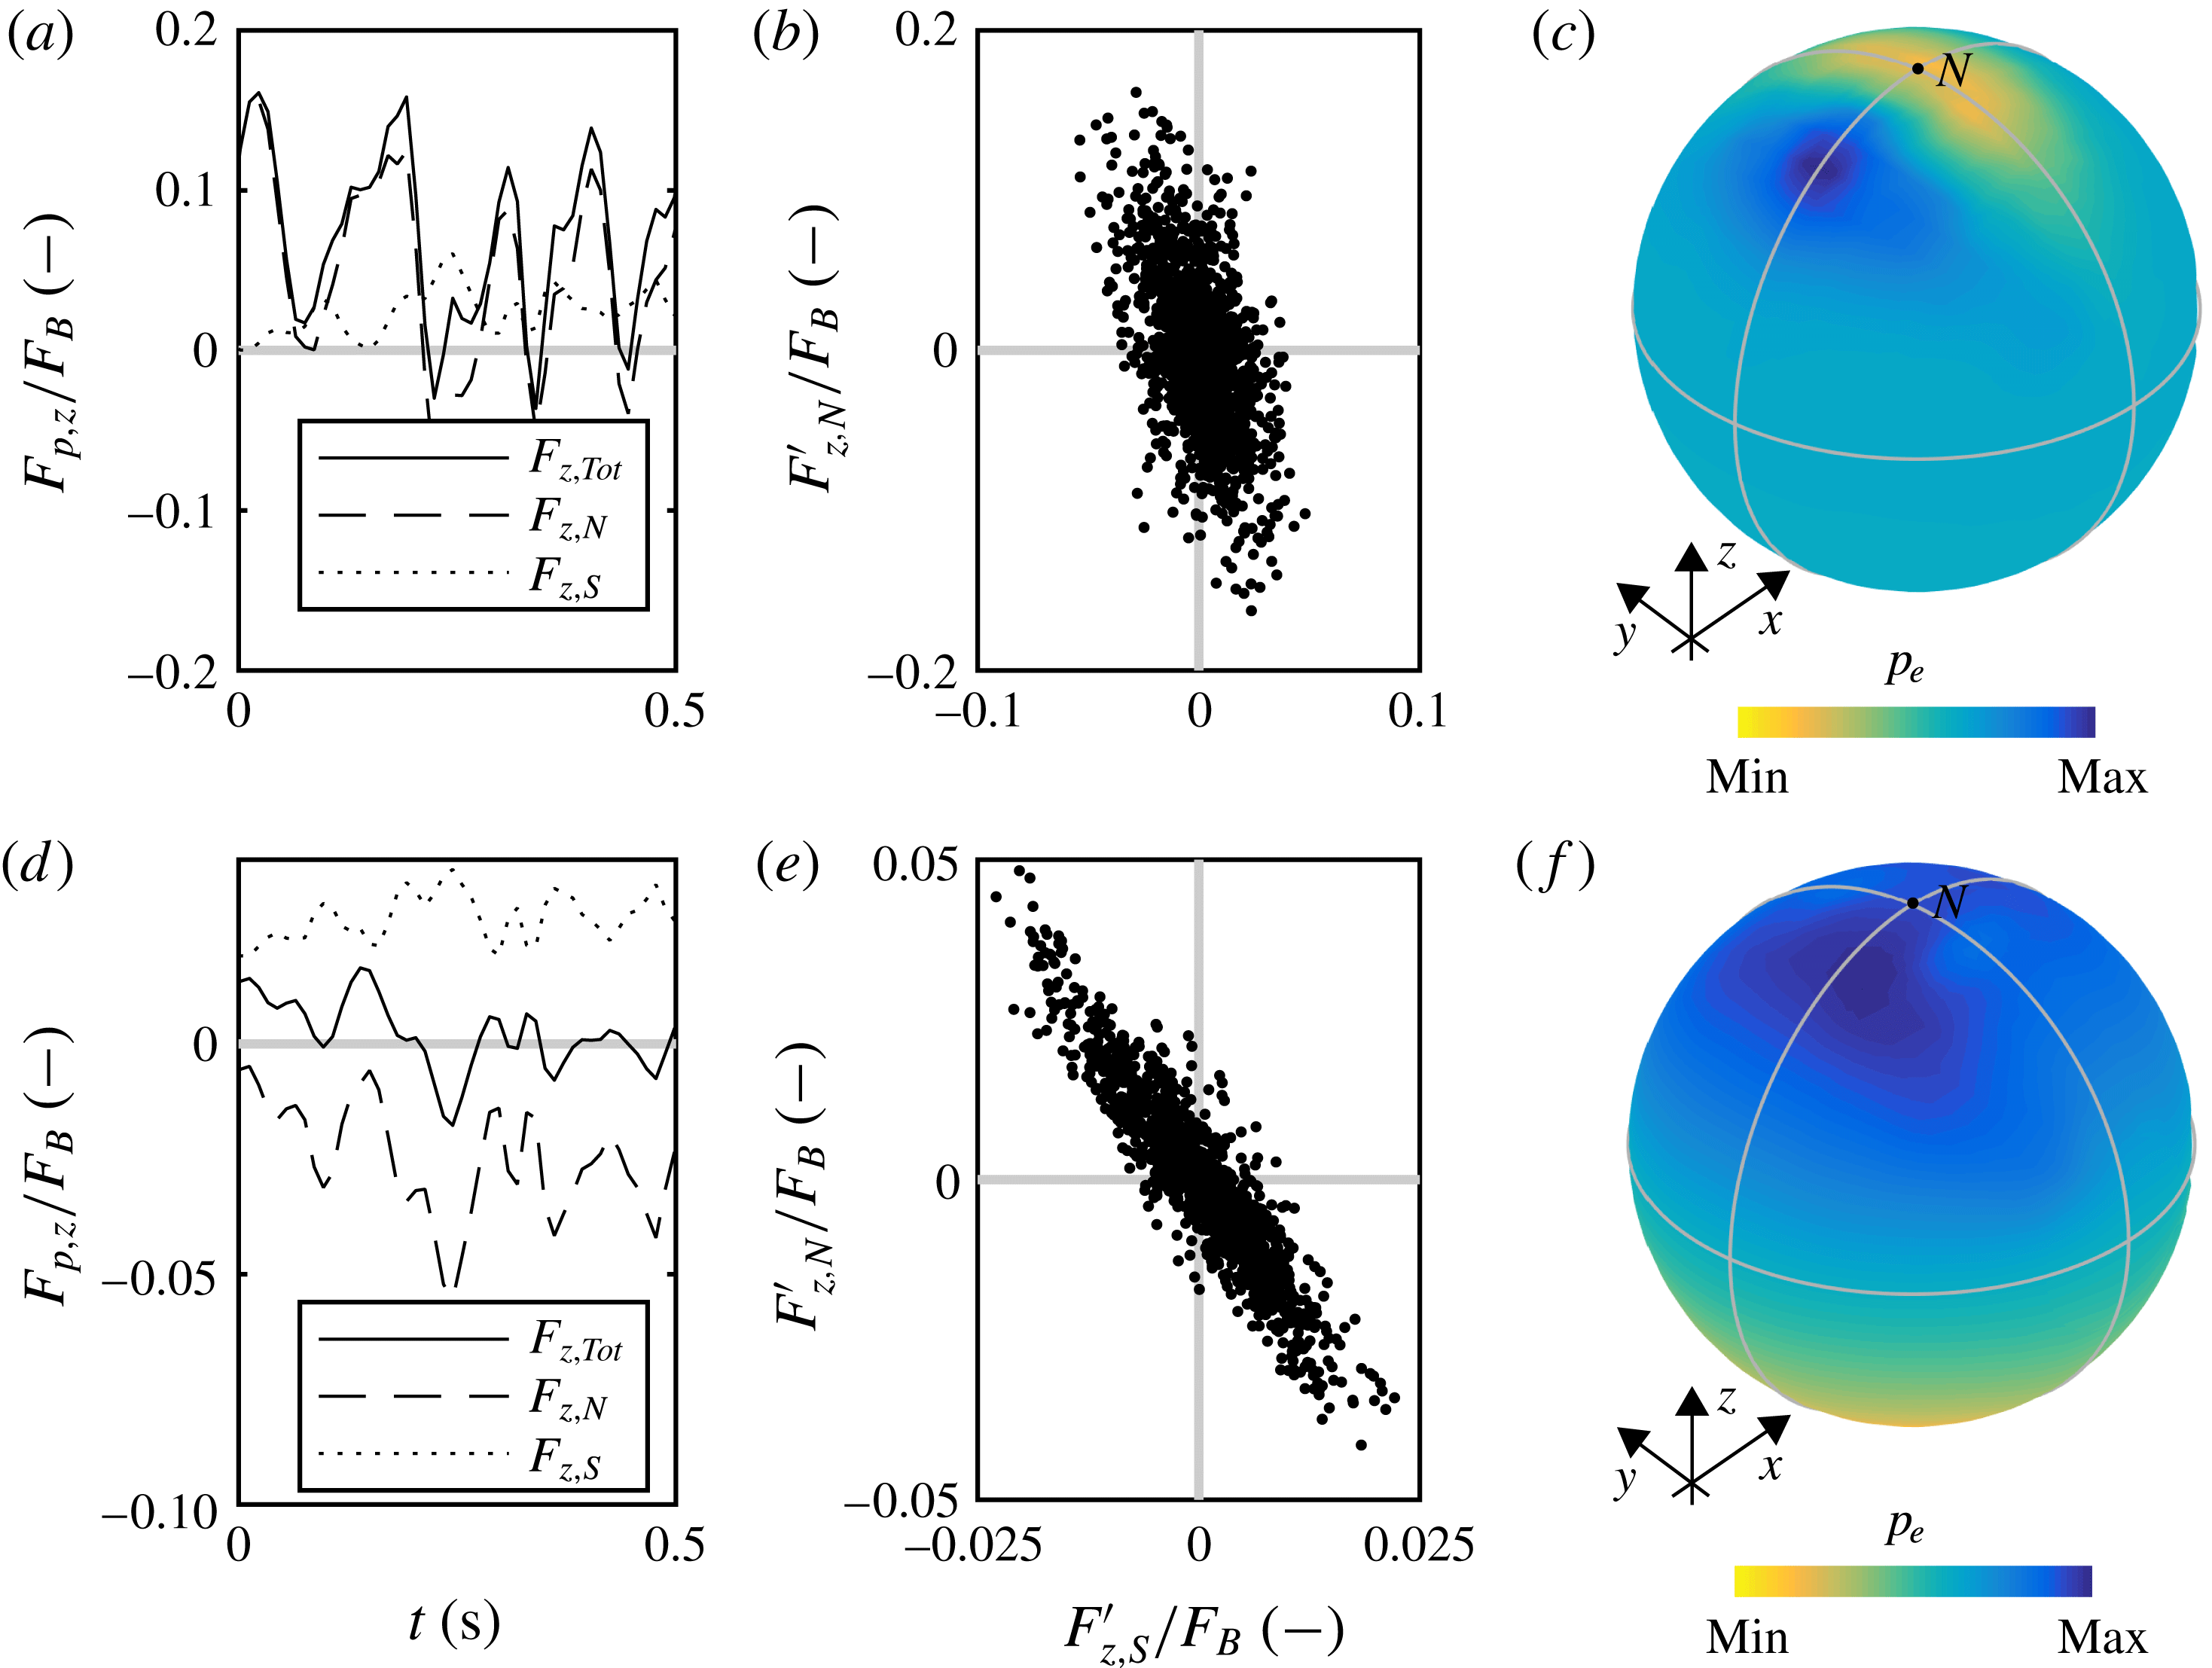
(a) Pressure lift signal for the top particle, with a decomposition of north and south hemisphere contributions. (b) North–south quadrant analysis. (c) Mean pressure on the particle surface. Analogous results for a reference particle located inside the bed are shown in (d,e,f).

A visualization of the mean pressure on the surface of two reference beads (one on top, one inside the bed) in presented in figure 9(c). The contours agree with those obtained by Chan-Braun, García-Villalba & Uhlmann (Reference Chan-Braun, García-Villalba and Uhlmann2011) with a similar bed configuration. For the top reference bead, the north hemisphere corresponds to the part that faces the free flow. The north pole is the area were sharp gradients of pressure concentrate. Conversely, the pressure registered on the surface of the bottom particle follows a completely different pattern. The distribution, shown in (f) is here antisymmetric, with no clear concentration areas. The pressure on the surface mirrors closely the pressure in the closest pores.
To reconstruct how the lift forces build up, the time history of the pressure resultant,
 $F_{p,z}(t)$
is also computed, separating the contributions pertaining to the south hemisphere (smaller
 $z$
) and the north hemisphere (larger
 $z$
). A sample of the recordings for the top particle is presented in figure 9(a). Here, the forces are scaled by the buoyancy of the full particle. The top particle experiences high lift events that are composed of net positive contributions from both north and south hemispheres. The north hemisphere signal
 $F_{z,N}^{\prime }(t)$
is a reflection of the pressure registered in the free flow (
 $p_{1}$
) shown above. In fact,
 $p_{1}$
is located above the north pole of the top particle, a location around which the highest and lowest pressure values cluster. However, there is also a lift coming from the subsurface flow. The pressure inside the pores does not instantaneously follow the events in the free flow. When a negative pressure above the particle comes with a pressure rise inside the bed, north and south components both induce a positive lift.
During peak events, defined as those where the force is at least
 $1/3$
of the largest recorded force
 $F_{z,max}$
, the south component gives a significant contribution to the lift of the top particle. In these peak events, the average ratio
 $F_{z,S}/F_{z,Tot}$
totals 0.23. That the south component can be significant is clear also from the
 $F_{z,N}^{\prime },F_{z,S}^{\prime }$
quadrant presented in figure 9(b). Here, the peaks of the north and south contributions are plotted separately, each peak computed with respect to its own mean value in order to highlight the time sequence of events, and again scaled by buoyancy. A growth of
 $F_{z,N}^{\prime }$
can be simultaneous with positive
 $F_{z,S}^{\prime }$
.
For the bottom particle, a very different pattern is observed. Because the pressure signals in the pores above the particle (
 $p_{-1}^{\prime }$
) and below (
 $p_{-2}^{\prime }$
) are strongly correlated, also the force signals have a similar shape. This implies that a drop in pressure induces a stronger upward (positive) north contribution, but also a stronger downward (negative) south contribution, which act oppositely. Because of this, pressure fluctuations have here a much less dramatic impact on the total force than for the particle above. This can be seen also from the
 $F_{z,N}^{\prime },F_{z,S}^{\prime }$
quadrant presented in (e). Large events gather on the second and fourth quadrants. Because this phase homogeneity is found consistently at different levels inside the bed, simulating a large number of pore levels should not significantly alter the results. However, a full resolution of the pores that are affected by the surface turbulence is pivotal for reconstructing a full picture of the hydrodynamic interactions between flow and bed particles.
5 Conclusions
In this work, an idealized sediment bed was studied, with a level of resolution sufficiently high to yield a full description of the flow in the pores between the particles. Both surface and subsurface flow features have been compared to an experimental dataset obtained with a similar setting, showing good agreement. The numerics have confirmed the main aspects highlighted already in the experiments. The subsurface flow velocity, as a result of the high level of connectivity in the pores, does not decay as one would intuitively expect. The streamwise velocity stabilizes to a constant level after registering a local minimum in the first pore layer below the surface. This profile is the result of the suction and injection exchanges between surface and pores, which perturb the otherwise homogeneous subsurface flow. These events cause pressure perturbations inside the pores, whose intensity decays exponentially with depth.
The pressure signals at different pore layers are in phase, with a reduction in amplitude and a progressive damping of the highest-intensity fluctuations. However, crucially, no such clear cross-correlation is present between the pressure in the pores and that above the particle, in the free flow. The forces on the particles are a direct reflection of this mechanism. In the case under study, the subsurface flow often acts as a promoter of high lift forces on the particles on the top layer. It remains true that the principal mechanism promoting particle dislodgement, even for the highly porous bed in this case, is the drift in the pressure differential in the vertical direction, which is largely dominated by the structure of the flow above the bed. However, the out-of-phase pressure events below the particle give a significant contribution, ranging here during peak events at around 20 %–25 % of the total net.
In the presented test case, the level of mutual interference between surface and subsurface flow is enhanced by the cubic arrangement of the particles. It would be interesting to see to what extent the result are resilient to a relaxation of the initial hypotheses, e.g. by redistributing the particles in a less porous structure, or by introducing particles of different size. Whether or not the subsurface flow can significantly contribute to the lift on the particles has important implications for experiments and simulations reproducing sediment pick up in a confined environment. Neglecting or artificially reducing porosity might lead to an unrealistic resolution of the pressure field, and to an underestimation of the hydrodynamic interactions between subsurface flow and particles.
Acknowledgements
The research leading to these results received funding from the People Programme (Marie Curie Actions) of the European Union’s Seventh Framework Programme FP7/2007-2013/ under REA grant agreement no. 607394-SEDITRANS. This paper reflects only the authors’ view and the Commission and REA are not responsible for any use that may be made of the information it contains. The authors are grateful to F. Kyrousi for useful suggestions, and to the group of H. Herrmann at ETH Zurich for providing some of the resources used for the computations.