We welcome the focal article’s (Ducheyne & De Fruyt, Reference Ducheyne and De Fruyt2026) focus on distinguishing between “toxic” and “incompetent” leadership. In this commentary, we take the authors’ ideas as a point of departure for considering how leadership practitioners may (a) define and (b) identify toxic leaders in their own efforts. We conclude with recommendations for practice.
Moving toward conceptual clarity of “toxic leadership”
Conflated definitions of toxic and incompetent leadership
The focal article’s definition of toxic leadership conflates objective/manifested behaviors, evaluations of a leader (e.g., as, threatening and intimidating), being untrustworthy, reflecting poor integrity, and unpredictability (p. 13). These components of toxic leadership refer to distinct constructs. First, objective behaviors and their subjective evaluations differ. For abusive supervision, Tepper (Reference Tepper2000) emphasized that the same behavior can be viewed as abusive in one context but not another, and by one subordinate but not another. Thus, defining a behavior by its perception (e.g., threatening) means defining it by a proximal effect, which is a tautological bias. Second, judging a person as untrustworthy depends on many factors including, for example, the person’s facial cues (Rule et al., Reference Rule, Adams, Ambady and Freeman2012), but also their reputation, interaction history, and characteristics of the rater. Thus, the behavior of a leader and their trustworthiness cannot be equated. If they are related, then judgments of untrustworthiness are a downstream consequence of behaviors.
As defined, incompetent leadership combines distinct constructs too, because the focal article characterizes it as “a broader set of inadequate and clumsy behaviors,” but these are not perceived as threatening or intimidating (p. 13). Generally, classifying a behavior as adequate is a judgment that depends on the context and features of the evaluator (Wang et al., Reference Wang, Van Iddekinge, Zhang and Bishoff2019). Conflating behaviors and effects again creates a tautology and renders empirical relationships meaningless.
Practical implications of the conflated definitions
The conflated definitions engender practical limitations because the different causal roles of each component of the toxic and incompetent leadership constructs prescribe a different intervention. For instance, we could simply teach people to avoid universally toxic and incompetent behaviors if toxic and incompetent leadership were reducible to different objective behaviors. In this case, the logical intervention would be behavioral training. However, if toxic leadership reflects low integrity, it carries a dispositional assumption: The root cause would lie in stable personality characteristics. In this case, the logical intervention would be personnel selection that screens out low-integrity individuals. Conflated definitions of toxic and incompetent leadership hide the distinct causal role of different components and, by implication, makes it impossible to determine which intervention would be most effective.
A step-by-step guide for identifying toxic leaders
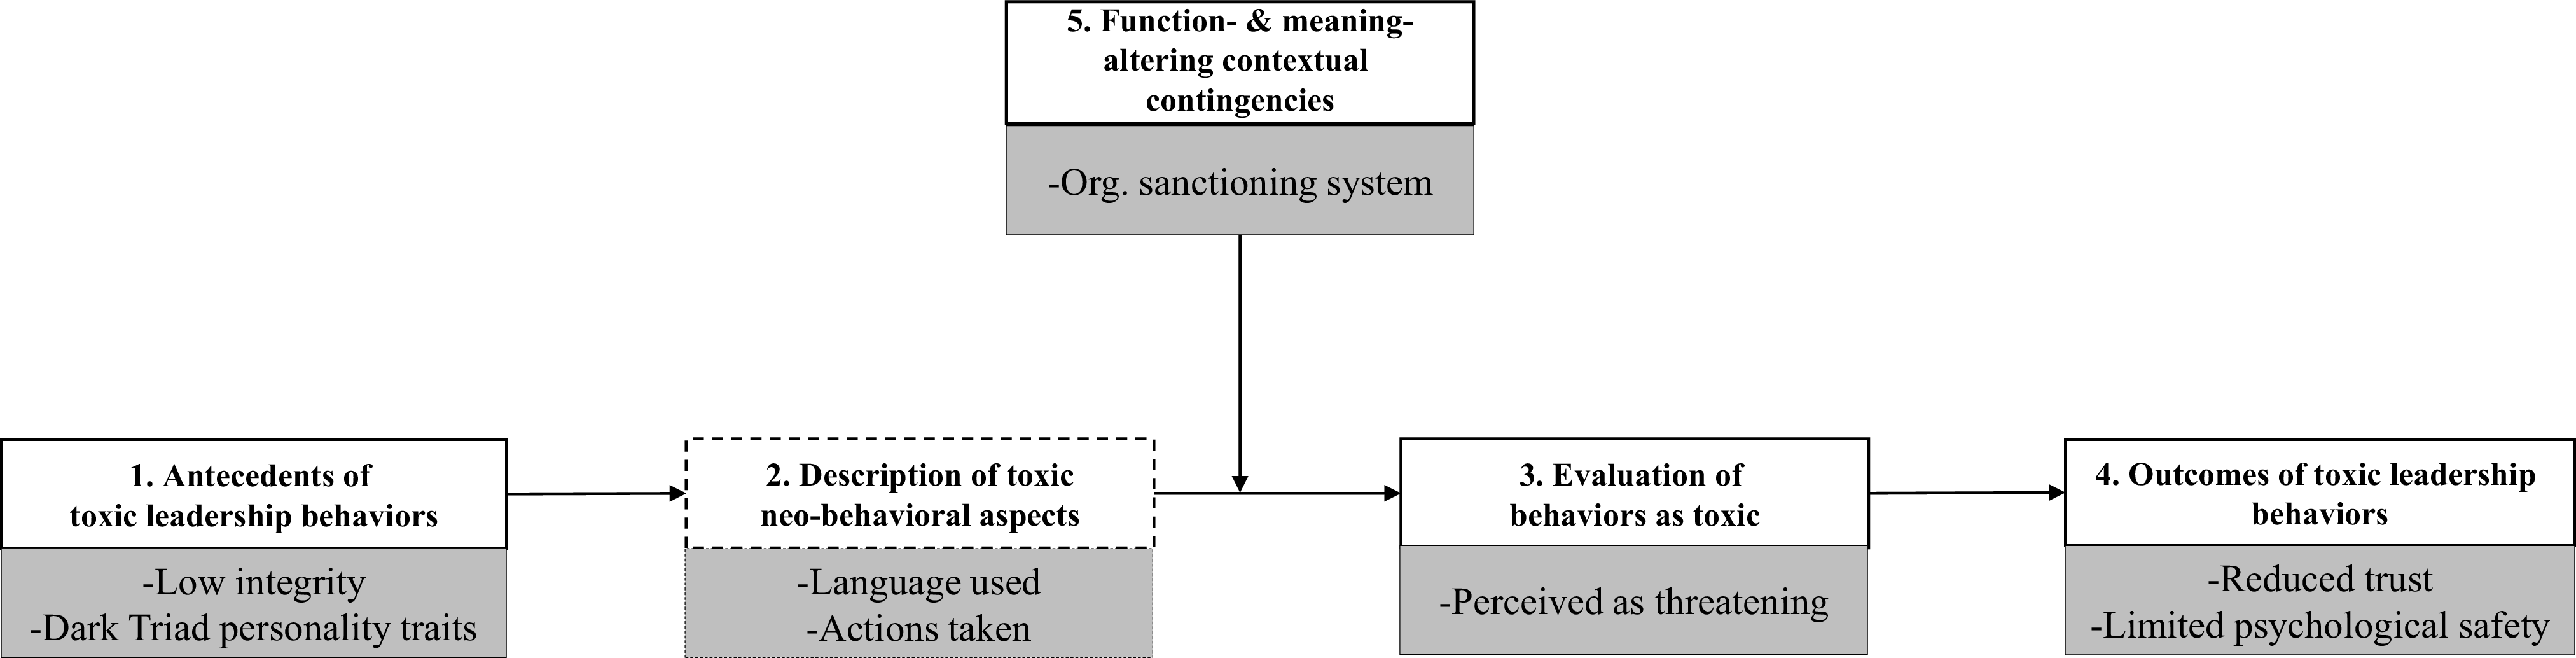
Moving forward, then, we retain the distinction between behaviors, their evaluations (e.g., as threatening), their effects (e.g., unsafe culture), and antecedents (e.g., low integrity) (Figure 1) and offer a step-by-step guide for identifying toxic leaders. By emphasizing the distinctiveness of each leadership construct, we can identify what practical responses are both (a) most useful and (b) currently available for practitioners. We later consider what is possible through future efforts in the field.
Conceptual Process Model of Toxic and Incompetent Leadership.
Note. This is a variant of Fischer et al (Reference Fischer, Banks and Bourque2026) integrative framework of leadership behaviors, adapted to toxic leadership and simplified by omitting arrows that indicate reverse causality. This figure illustrates that Ducheyne & De Fruyt’s (Reference Ducheyne and De Fruyt2026) definition of toxic leadership conflates causally distinct components of the toxic leadership process (see their p. 13, where they state that “[t]oxic leadership is thus about: (a) objective/manifested behaviors; (b) perceived as threatening, intimidating and discrediting, creating an unsafe work environment; and (c) being untrustworthy, reflected in poor integrity and unpredictability”). Importantly, conflating these causally distinct components obscures the toxic leadership process and possibilities of distinct interventions (e.g., leadership selection, behavioral training, or awareness training). Also, the dashed lines for neobehavioral aspects reflect the limited research and findings available for this part of the integrative framework.

Figure 1. Long description
The flowchart illustrates the stages of toxic leadership, starting with antecedents and ending with outcomes. The process begins with antecedents of toxic leadership behaviors, such as low integrity and dark triad personality traits. This leads to the display of concrete toxic behavioral aspects that can be described objectively, including the language used and actions taken. The next step involves the evaluation of behaviors as toxic, perceived as threatening. This evaluation is influenced by function- and meaning-altering contextual contingencies, such as the organizational sanctioning system. Finally, the outcomes of toxic leadership behaviors include reduced trust and limited psychological safety.
For now, though, we focus our step-by-step guide on evaluations of leaders’ competencies as proximal predictors for evaluations of leadership effectiveness. Practically, we see evaluative assessments as useful tools for practitioners who work with leaders. Consider, for example, that evaluations are a mainstay of many leader development programs. Oftentimes, evaluations are captured from multiple sources (e.g., direct reports, peers, superiors) and reflect several dimensions of leadership (e.g., Day et al., Reference Day, Fleenor, Atwater, Sturm and McKee2014). This is helpful because both toxic and incompetent leaders may harm different stakeholders and could struggle in several aspects of leadership.
Conceptually, our approach is consistent with others’ arguments where forms of negative leadership are placed “on a continuum ranging from ineffective/incompetent to unethical/evil” (Kellerman, Reference Kellerman2004; emphasis added). From this perspective, then, toxic leaders are both (a) rare and (b) still associated with outsized, deleterious effects. Incompetent leaders would be (c) more common and (d) associated with less severe deleterious effects.
We acknowledge that which aspects of leadership are most relevant are context dependent. Thus, we created a composite to increase the accuracy and consistency of our ability to classify toxic or incompetent leaders.Footnote 1 We isolated a leader’s reputation in their multisource evaluations (Vergauwe et al., Reference Vergauwe, Hofmans and Wille2022). That is, we extracted factor scores from a bifactor model defined by other raters’ evaluations (i.e., direct reports, peers, superiors, and board members). This approach is consistent with prior research on toxic leadership that both acknowledges the likelihood of inaccurate self-perceptions (perhaps due to personality characteristics) and that emphasizes what others see rather than a leader’s own perspective (Hogan et al., Reference Hogan, Kaiser, Sherman and Harms2021).
Using this composite, we consider leaders with abnormally low reputation scores (i.e., less than −1.00 standard deviation) to be toxic, whereas those who are below average (<−0.50 standard deviations) as incompetent. Our cutoff, again, reflects how negative leadership progresses along a continuum with toxic leaders expected to have outsized effects (Hogan et al., Reference Hogan, Kaiser, Sherman and Harms2021; Kellerman, Reference Kellerman2004).
In our sample, 21 leaders (i.e., <5% of the sample) would be considered at risk of being seen as “toxic” when using this cutoff score.Footnote 2 This reputation index, on its own, captures 25% of the variability in team members’ ratings of psychological safety and 31% of the variability in subjective ratings of division performance.Footnote 3 These associations help link evaluations with effectiveness, which is a criterion in theories of toxic leadership (e.g., Hogan et al., Reference Hogan, Kaiser, Sherman and Harms2021).
Again, an important distinction in the focal article is leaders who are toxic versus those who are incompetent. Thus, we examined a key counterfactual: comparing those leaders at risk for being “toxic” (< −1.00 SD) to those just above them on the distribution (i.e., > −1.00 & < −0.50; incompetent leaders) (Figure 2). Moving from a reputation index of −0.50 (incompetent) to −1.00 (toxic) means the likelihood of being below average in division performance jumped by approximately 20%. We observed the same trend for psychological safety. If we compare toxic leaders to the entire sample, the differences become even more stark. When we collapse across all other categories of leaders (Figure 3), nearly all teams led by a toxic leader report below average levels of performance (often substantially below). Although not pictured, the same is true for psychological safety.
Comparing Division Performance for Leaders Classified as “Toxic” Versus “Incompetent”.
Note. Each dot represents a separate leader. Leaders whose reputation score is <−1.00 were classified as being at risk for “toxicity” (pink dots) whereas those whose scores were less than <−0.50 may be considered “incompetent” (blue dots).

Figure 2. Long description
A plot comparing division performance and reputation score for leaders. The x-axis represents the reputation score in standard units, ranging from -1.50 to 1.50. The y-axis represents division performance in team average, ranging from 3.0 to 5.0. Each dot represents a separate leader. Leaders with a reputation score of -1.00 are classified as being at risk for toxicity and are marked with pink dots. Leaders with scores less than -0.50 are considered incompetent and are marked with blue dots. Leaders with scores 0.50 and 1.00 are marked with gray dots. The plot shows a cluster of blue dots around the center, indicating leaders with moderate reputation scores and division performance around the average. Pink dots are scattered more towards the left side of the plot, indicating lower reputation scores and varying division performance. Gray dots are spread across the plot, showing a range of reputation scores and division performance. A dashed horizontal line at the 4.0 mark on the y-axis indicates the average division performance.
Comparing Division Performance for Leaders Classified as “Toxic” Versus “Nontoxic” Leaders.
Note. Each dot represents a separate leader. Leaders whose reputation score is <−1.00 were classified as being at risk for “toxicity” (pink dots) whereas other leaders in the sample are classified as “nontoxic leaders” (gray dots).

Figure 3. Long description
A scatter plot comparing division performance for leaders classified as Toxic versus Nontoxic leaders. The x-axis represents leaders categorized as Toxic Leaders and Nontoxic Leaders, while the y-axis represents Division Performance measured by the team average. The plot features hundreds of data points, with pink dots representing Toxic Leaders and gray dots representing Nontoxic Leaders. A dashed horizontal line indicates the average division performance. Toxic Leaders show lower division performance, with nearly all of the data points falling below the average, while Nontoxic Leaders cluster above the average line, indicating higher performance. The plot highlights a significant performance gap between Toxic and Nontoxic Leaders, with Toxic Leaders more likely to be below average in division performance.
Going forward, what else can we do?
By using evaluations to distinguish between leaders who may be toxic versus those who are merely incompetent, practitioners may begin to address the toxic leaders within their organization. Interventions range from developmental ones (e.g., coaching) to selection- or composition-based approaches (e.g., changing roles), or sanctioning (e.g., grievance or performance-appraisal based systems). In turn, identifying the most suitable intervention calls for knowledge about which aspect of leadership accounts for the low evaluations (Figure 1). Below, we discuss some intervention strategies.
Individual-level assessments
Importantly, how best to intervene with toxic leaders is still a bit unclear. Receiving exceptionally poor evaluations from multiple stakeholders may not indicate how a “toxic” leader is actually behaving. It is also possible that such evaluations are contaminated, biased, or localized within a particular rater group (Fischer, Reference Fischer2023). Thus, it is possible that some toxic leaders may not even know what they are doing to elicit such evaluations.Footnote 4 Fortunately, though, practitioners can increasingly build upon evaluation-based assessments and leverage recent advances in multimodal assessments, which focus on the form and manifestation of behaviors, to isolate what actions may be potentially toxic (Banks et al., Reference Banks, Woznyj and Mansfield2023; Loignon et al., Reference Loignon, Bergeron and McKenna2024). By leveraging both evaluative and behavior-based assessments, there is an opportunity to integrate distinct approaches within leadership (Fischer et al., Reference Fischer, Banks and Bourque2026).
Organizational interventions
At the organizational level, efforts to reduce toxic and incompetent leadership should begin with monitoring systems that capture overarching reputation scores while retaining distinctiveness among leadership constructs (Figure 1). Organizations should collect information that separately captures observable leader behaviors, inferred intentions or integrity violations, followers’ subjective evaluations of leader behaviors (e.g., as threatening), and downstream consequences such as reduced trust or psychological safety. Integrating multiple indicators, such as behavioral word-tracking, patterns of complaints, and team-level outcomes, can help organizations detect problematic leadership early on. Such differentiated systems afford the clarity necessary for fair and effective governance of leadership.
Individual-level interventions
At the individual level, professionals may use these more refined diagnostics to define more targeted intervention strategies. Interventions should be aligned with the specific causal mechanism identified. For example, if low leadership reputations reflect a leadership skill deficit or consistent maladaptive behavior, then feedback, coaching, and leadership development may be appropriate. However, when patterns suggest integrity violations or exploitative intent, stronger accountability mechanisms, including formal investigation and firing, may be required. In cases where negative evaluations arise primarily from interpretive differences among followers, interventions may instead focus on clarifying expectations, improving communication, or addressing organizational stressors.
Conclusion
Although the field continues to develop more precise conceptual distinctions, we assume that various practitioners may find themselves confronted with a struggling leader, who may or may not be “toxic.” These practitioners must act. Thus, like the focal article, we agree there is value in distinguishing between toxic and incompetent leadership and suggest an approach that is useful in the workplace. In this way, we demonstrate the importance of maintaining construct clarity while addressing both toxic and incompetent leadership in today’s organizations.