We have built a country where everyone can choose the neighborhood (and church and news shows) most compatible with his or her lifestyle and beliefs. And we are living with the consequences of this segregation by way of life: pockets of like-minded citizens that have become so ideologically inbred that we don't know, can't understand, and can barely conceive of “those people” who live just a few miles away.
(Bishop Reference Bishop and Cushing2008, 40)In 2008 journalist Bill Bishop achieved the kind of notice that authors dream about. His book, The Big Sort: Why the Clustering of Like-Minded America Is Tearing Us Apart, was mentioned regularly during the presidential campaign; most notably, former president Bill Clinton urged audiences to read the book.Footnote 1 Bishop's thesis is that Americans increasingly are choosing to live in neighborhoods populated with people just like themselves. In turn, these residential choices have produced a significant increase in geographic political polarization. Bishop does not contend that people consciously decide to live with fellow Democrats or Republicans; rather political segregation is a byproduct of the correlations between political views and the various demographic and life-style indicators people consider when making residential decisions.Footnote 2 Whatever the cause, Bishop contends that the resulting geographic polarization is a troubling and dangerous development.
We do not doubt that various kinds of sorting are occurring in the United States—as they have in the past and no doubt will in the future. Most importantly, political science research has shown that during the past three decades party sorting has occurred—liberal-minded Americans have increasingly made the Democratic Party their home, and conservative-minded Americans have increasingly gravitated to the Republican Party (without changing the shape of the aggregate distribution of public opinion). Questions about the amount of sorting and its causes, however, still remain (Gelman Reference Gelman2011; Levendusky Reference Levendusky2009).Footnote 3 Yet claims about geographical sorting have always struck us as somewhat questionable. Residential mobility notwithstanding, do the citizens of, say, Massachusetts and Mississippi differ more today than they did in 1950, before the jet plane, the interstate highway system, broadcast television, and other economic and cultural homogenizing influences? To be sure, states are gross units of analysis, but descending to lower levels, a half-century ago when the United States was still largely a country of small towns and cities, did blue-collar union Democrats who worked in the mines and factories interact with white-collar Republican managers and professionals more than they do today? The older member of our team finds that claim implausible.
Despite the opinions of various reviewers on the Amazon.com website and in the popular media that The Big Sort is thorough, systematic, and well-researched, most academic researchers would conclude the opposite.Footnote 4 After some primary data presentation in the first 55 pages the book becomes a potpourri of secondary evidence and anecdotes, and much of the latter consists of fragments gleaned from works on popular sociology. Moreover, on close inspection the little original evidence that is reported—which so impressed Mr. Clinton and provides the foundation for the pop sociological arguments that fill most of the book's pages—is weak. In the following section of this article we show that the case for geographic political sorting has not been made. Indeed, using Bishop's standard, the data suggest the opposite: geographic political segregation is lower than a generation ago. Then we make the case that although the concerns expressed by Bishop are legitimate—that various factors may be operating to make Americans more culturally inbred than a generation ago—geographic political sorting has little or nothing to do with that development.
THE (LACK OF) EVIDENCE FOR INCREASING GEOGRAPHIC POLARIZATION
Bishop and Cushing purport to establish the existence of geographic polarization by presenting changes in presidential voting returns by county, with particular emphasis on the difference between the close 1976 and 2004 elections (Introduction, 6, 9–11, 20, 43–47). By way of explanation, they write “We decided to use presidential election results—instead of either voter registration or state elections—as the common measurement among the nation's more than 3,100 counties to avoid the effects of different candidates or changing voting districts” (our emphasis) (Reference Bishop and Cushing2008, 9). On the contrary, a moment's reflection should show that far from minimizing the effects of different candidates, reliance on presidential voting returns maximizes the effects of different candidates.
Bishop and Cushing report that between 1976 and 2004 the proportion of voters living in “landslide counties” (where one party achieved a victory margin of 20% or more of the two-party vote) increased from 27% to 48% in competitive presidential elections (elections resulting in a winner's margin of 10% or less of the two-party vote). This is clearly a significant increase (and the figure that greatly impressed Mr. Clinton). But to attribute that increase to a change in geographic sorting requires that other relevant explanatory factors have remained constant. Surely one such factor is the identity of the competing candidates. If voters view Gerald Ford and George W. Bush as two identical Republicans, and Jimmy Carter and John Kerry as two identical Democrats, the case for voter sorting as the causal explanation for the increase in landslide county population is plausible.Footnote 5 Yet, these two Republicans obviously differed, as did the two Democrats. According to the National Election Studies, the 1976 electorate saw the two candidates as 1.85 units apart on the standard seven-point liberal-conservative scale. The 2004 electorate saw the candidates as 2.45 units apart.Footnote 6 Is it at all surprising that a contest between a moderate Republican from the Midwest and a moderate Democrat from the South divided the voters in most locales more evenly than a contest between a conservative Republican from Texas and a liberal Democrat from Massachusetts?
There are other obvious problems with the temporal contrast. One reviewer (Kellner Reference Kellner2008) noted that 1976 was the low point for the percentage of the population residing in landslide counties in the post-World War II period and 2004 the high point. Therefore, the choice of those beginning and end points exaggerates the “trend” in geographic polarization. Still, using the figures in Bishop's table 1.1, the pre-1948–76 average is 33% of the nation's population living in landslide counties compared to a post-1984 average of 43%. This 10 percentage point difference is slightly less than half the magnitude of Bishop's 1976–2004 contrast, but perhaps enough of a difference to establish the point he wishes to make. Taking a longer historical perspective, however, Klinkner (Reference Klinkner2004a,Reference Klinknerb) and Klinkner and Hapanowicz (Reference Klinkner and Hapanowicz2005) undercut that fallback position: Since 1840 county-level presidential vote polarization as defined by Bishop fluctuates far more than the 10 percentage point increase over the past generation—from less than 20% in 1896 to more than 50% in 1904, and from less than 25% in 1952 to nearly 60% in 1964, for example. If geographic polarization is tearing us apart, both levels and increases have been greater in the past, and the country has survived intact.
But as suggested here, the most serious problem with Bishop's analysis is the reliance on presidential election returns. Elsewhere (e.g., Reference Bishop and Cushing2009, 30) we have argued that this is a general problem in the literature on political polarization. Although presidential voting returns obviously are an important indicator of political preferences, they are frequently inconsistent with other valid indicators of political preference such as voter registration and election returns for other offices (both of which Bishop and Cushing eschew). For example, in the 2004 election, George W. Bush carried Montana by 20 points, but Montana voters elected a Democratic governor. Even more strikingly, Montana voters approved a prohibition of gay marriage by a 67% majority along with a permissive medical marijuana initiative by a 62% majority. Similarly, in November 2011, 62% of Ohio voters overturned a Republican law limiting public employee unions. At the same time 66% of Ohio voters went on record as opposed to the individual mandate of the Democratic health-care law. Citizens living in segregated political enclaves who feel so strongly about their views as to endanger the survival of the country presumably would vote in solidarity with their partisan compatriots whatever the issue or whomever the candidates. Evidently, many of them do not.
Voter Registration
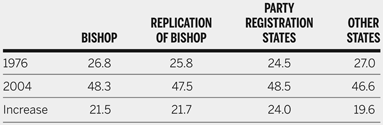
In contrast to presidential election returns that are highly dependent on the identities of the contending candidates and the conditions under which they occur, a more general and undoubtedly more stable measure of partisan preference is the standard attitudinal measure of party identification.Footnote 7 A Democratic gun lover might vote for Bush in 2000 without becoming a Republican. Similarly, a Republican wind-surfer might vote for Kerry in 2004 without becoming a Democrat. But even state-level measures of party identification did not become available until the 2000s, and reliable figures are not available for smaller units even now, so using party identification to study temporal changes in neighborhood homogeneity is impossible. A behavioral measure of party identification—voter registration—however, is available at the county level—the level from which Bishop's evidence comes. The drawback of voter registration is that not all states have partisan registration—29 states plus the District of Columbia have it today and somewhat fewer—23 had it in the mid-1970s.Footnote 8 Fortunately for our purposes scholars who have worked closely with such data have concluded after a number of validity tests that “The 21 states for which we were able to collect party registration data are surprisingly representative of the country as a whole” (McGhee and Krimm Reference McGhee and Krimm2009, 351).Footnote 9 That conclusion certainly holds for our purposes. The first column of table 1 reproduces Bishop's landslide county figures. Column 2 reports our replication from US Census Bureau data. Our figures are very close to his—within 1 percentage point in each year and the increase between 1976 and 2004 is actually slightly larger, so our conclusions do not depend on any differences in the raw data. Columns 3 and 4 compare landslide county percentages in states with and without party registration. The party registration states have a slightly lower figure in 1976 and a slightly higher figure in 2004, resulting in a greater increase using landslide voter population in the party registration states. Thus, if anything, the political trend identified by Bishop is even stronger in party registration states than in states without party registration.
Presidential Landslide County Population: 1976 v. 2004 (Percentage of presidential voters living in counties where margin of victory was 60:40 or greater)

Source: Bishop, Reference Bishop and Cushing2008: 10.
Note: “Party Registration States” include the 21 states for which we have pre- and postsort registration data.
An examination of trends in voter registration in American counties leads to conclusions about geographic polarization quite different from those based on presidential election returns. First, as McGhee and Krimm, among others, note, in recent decades there has been a significant increase in the “independent,” “decline to state,” or “other” categories (henceforth referred to as “independents”).Footnote 10 As shown in figure 1, in 1976 more than 70% of the counties in partisan registration states had 10% or fewer independents. By 2004 the situation had reversed: more than 70% of the counties had 10% or more independent registrants. Across the 1,200 counties in these states, average independent registration increased from 12% to 18%, average Republican registration increased from 33% to 39%, and average Democratic registration fell from 55% to 42%. The proportion of counties where Republicans have a 20% or more registration edge (i.e., a “landslide” in Bishop's term) almost doubled, rising from 7% to nearly 13%, while the proportion of counties where Democrats have such a large margin halved, falling from 38% to 18% (no counties have a landslide independent registration edge). Thus, at the county level what has occurred is not counties increasingly polarizing into Democratic and Republican categories, but rather counties becoming less Democratic and more Republican and independent.Footnote 11
Distribution of Independents by County: 1976 v. 2004 (1,198 counties in total for 21 states included in the sample)

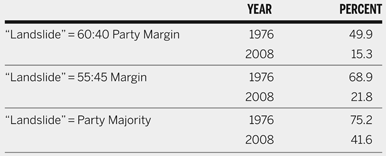
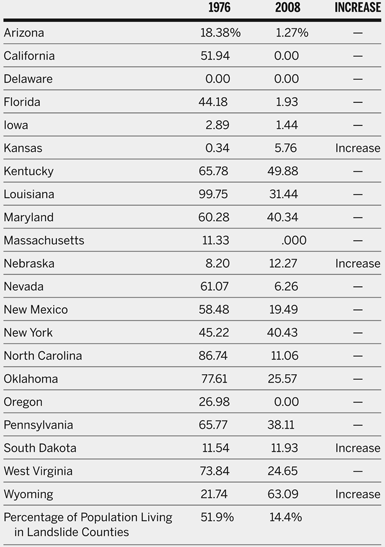
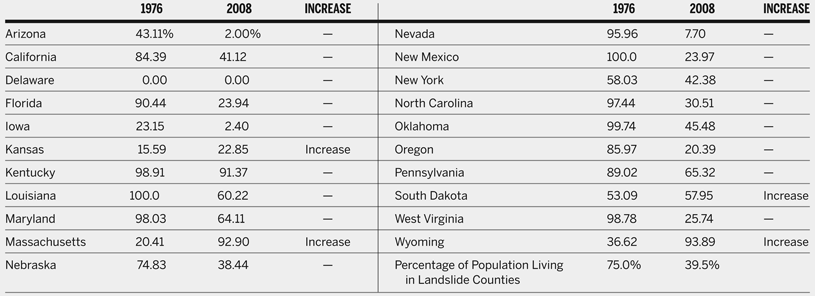
Of course, because counties differ greatly in population, Bishop could still be correct. However, as the top panel of table 2 shows, the percentage of the population living in landslide counties has declined in tandem with the decline in the number of landslide counties.Footnote 12 To repeat: if we define landslide counties according to their voter registration rather than their presidential vote, the proportion of the American population living in landslide counties has fallen significantly, from about 50% to 15%.Footnote 13 Only four of the 21 states under consideration fail to follow this pattern (Appendix table 2A). South Dakota shows a trivial (less than 1%) increase in the percentage of its population living in landslide counties. Kansas and Nebraska show small increases to absolute figures that are quite low (to 5.76% and 12.27%, respectively). Only Wyoming shows the kind of increased geographic polarization that Bishop claims to be the general pattern: from 21.74% in 1976 to 63.09% in 2008.
Population Living in “Landslide” Counties Has Declined

Source: 21 states included in this sample. Census of Population and Housing, US Census Bureau. (http://www.census.gov/prod/www/abs/decennial/)
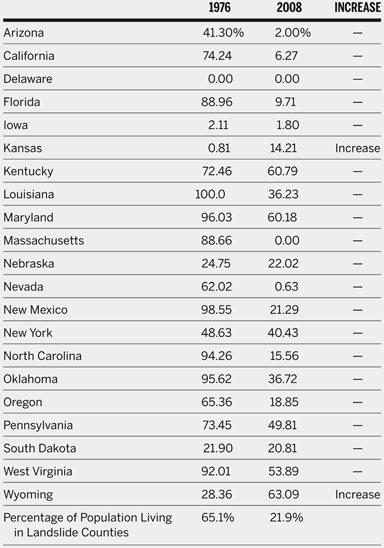
As Klinkner (Reference Klinkner2004b, 1) notes, the concept of a “landslide county” is vague—it is highly dependent on the definitional figure employed. In Bishop's defense one might object that the rise in independents makes it more difficult for either party to achieve the 20% margin that constitutes his definition of a landslide county. So, allowing for the increase in independents we have calculated two weaker measures of landslide counties: (1) one party enjoys a 20% or more registration margin (e.g., 45% Democrat, 35% Republican, 10% Independent), and weaker still, (2) one party simply has a majority of the registered voters (e.g., 50.1% Democrat, 41.9% Republican, 8% independent). Although these category definitions take us far from what most people would consider “landslides,” they are alternative measures of county political polarization. Whatever definition is used, the second and third panels of table 2 show that counties in the United States have become increasingly politically heterogeneous, not increasingly homogeneous. Using a 10% margin as the criterion for defining a landslide county, the percentage of the population living in such counties has declined from about 69% to 22%, with only Kansas and Wyoming constituting exceptions to the general downward trend (Appendix table 2b). Finally, the percentage of the population residing in counties where one party simply has an absolute majority—50% or more voter registration—has declined from 75% to 42%, with only Kansas, Massachusetts, South Dakota, and Wyoming as exceptions to the general trend (Appendix table 2c). In sum, two of three definitions find trace evidence of geographic sorting in Kansas and South Dakota, and Bishop's thesis looks great in Wyoming, but the large majority of states—and their populations—provide evidence to the contrary.
Discussion
Do the preceding analyses prove that political residential segregation is not occurring? No. That is not our position. We are simply pointing out that Bishop's sweeping argument about geographic political sorting has little or no empirical foundation, former President Clinton to the contrary notwithstanding. The simple fact is that it will take much more detailed research to settle questions about geographic sorting one way or the other. In particular, to examine the subject of residential polarization in a systematic manner requires data at a much lower level than the county level. One of us lives in New York County, New York, where neighborhoods range from the Upper East Side and SoHo to Harlem and Washington Heights. The other lives in San Mateo County, California, where neighborhoods range from the Woodside estates of Silicon Valley billionaires to the Redwood City bungalows of Mexican immigrants. No county-level figures can capture the disparate political textures of these areas, as well as thousands of others in the United States.
WOULD GEOGRAPHIC SORTING PRODUCE TERRIBLE CONSEQUENCES?
We turn now to a second question: if subsequent research at the neighborhood level were to find that geographic sorting in fact is occurring, would such a finding point to a serious problem for American democracy? The fears Bishop expresses are shared by many: “… like-minded homogeneous groups squelch dissent, grow more extreme in their thinking, and ignore evidence that their positions are wrong” (Reference Bishop and Cushing2008, 19). Bishop cites a social-psychological literature on group pressure in support of such conclusions (Reference Bishop and Cushing2008, Chapter 3).Footnote 14 We agree that such behavior is highly problematic for democratic politics, and if realized, a matter of serious concern.
Other, arguably more relevant literatures point to quite different conclusions. The argument that increasing neighborhood homogeneity leads to ideological inbreeding, stifling consensus, squelching of dissent, and other bad things rests on a series of assumptions:
1. Neighborhoods are important centers of American life.
2. The residents of American neighborhoods talk to each other.
3. Politics is an important topic of their discussions.
If these assumptions hold, then the results of social-psychological experiments on group pressure may well apply. But many respected scholars believe that the problem with American life today is precisely that the preceding assumptions do not hold.
Neighborhoods as Centers of American Life
A decade ago Robert Putnam published his magisterial work Bowling Alone (Reference Putnam2000). Over much of the period addressed by Bishop, Putnam found that Americans had become much less socially engaged than in earlier decades. They were strikingly less likely to join traditional community-based organizations such as the Elks, Lions, Eagles, Kiwanis, Rotary, Masons, Grange, the PTA, the American Legion—and a long list of other groups that had bound together previous generations of Americans.
Some critics noted that Putnam had ignored a plethora of new groups that had formed since the mid-twentieth century, but Putnam responded that many of these were not groups in the sense he meant. The groups he studied were community-based. Their members met regularly face-to-face; they elected officers and engaged in activities. In contrast, many of the newer groups were simply professional staffs with letterhead and mailing lists.Footnote 15 Their “members” wrote checks; they were “supporters,” not members in the traditional sense. Their connections were based on responding to the same direct mail solicitations or visiting the same websites, not personal conversations at a weeknight meeting. After analyzing a wealth of data Putnam (Reference Putnam2000, 63) concluded that “… active involvement in clubs and other voluntary organizations has collapsed at an astonishing rate, more than halving most indexes of participation within barely a few decades.” The decline was general—civic, political, religious, and, importantly, “informal.” In the latter category Putnam included neighborhood connections: “… when compared with neighborliness in the mid-1950s, neighborhood ties in the 1990s are perhaps less than half as strong.” (Reference Putnam2000, 106). Putnam identifies suburbanization as one of the contributing factors to the decline of neighborliness.
A majority of the American population now is suburban, more than twice the figure in 1950. According to urban sociologists the transformation of the United States into a suburban nation “had significant consequences for every aspect of American life … [it] fostered new patterns of localism and isolation that have also revolutionized relationships between individual communities and the nation” (Kruse and Sugrue Reference Kruse and Sugrue2006, 1). Housing patterns functioned to isolate families and residents from the street, from other neighbors and from the community at large, and helped promote a culture of privitism (Bellah Reference Bellah1985, 142–63; Clapson Reference Clapson2003; Duncan Reference Duncan and Duncan1981; Duncan and Lambert Reference Duncan, Lambert, Agnew and Smith2002; Keller Reference Keller2003; Kunstler Reference Kunstler1994; Moughtin Reference Moughtin2003). Suburban homes came to serve as a “refuge, a place where people attempt to insulate themselves from the problems of ‘others’” (Gainsborough Reference Gainsborough2001, 13). In fact, these modern suburban developments were designed “for people to live independently, each in his own self-sufficient home, dependent only on cars and roadways to take him wherever he needed to go” (Lovenheim Reference Lovenheim2010, 70). According to urban historian Kenneth Jackson “… the new idea was no longer to be part of a close community, but to have a self-contained unit, a private wonderland walled off from the rest of the world” (Reference Jackson1985, 58). Rifkin (Reference Rifkin2004, 154) writes that because Americans like to keep their “… distance from … neighbors … there is little sense of community in the average American suburb.”
Far from interactive groups that discipline their members' thinking, observers and scholars alike have described contemporary Americans as “suspended in glorious, but terrifying, isolation” (Bellah Reference Bellah1985, 6) and fear that Americans “face social malnutrition” (78). Lane (Reference Lane2000, 9), for instance, found that, “there is a kind of famine of warm interpersonal relationships, of easy-to-reach neighbors, of encircling, inclusive memberships, and of solitary family life.” Beatley (Reference Beatley2004, 351) describes Americans as having a case of social numbness noting an “emergence of a socially detached, passive and disconnected citizenry.” Morris (Reference Morris2005, 2) describes American life as an “oppressively anonymous existence.” [See also McPherson, Smith-Lovin, and Brashears (Reference McPherson, Smith-Lovin and Brashears2006, Reference McPherson, Smith-Lovin and Brashears2008)].Footnote 16
Even discounting for hyperbole, the implication of this body of research is clear. Contemporary American neighborhoods are not the first places one would look for the operation of strong social pressures. Even if neighborhoods were becoming more homogeneous politically, any resulting tendency for neighborhoods to squelch dissent and enforce conformity would be at least partly offset by the fact that their denizens were less likely to be involved in neighborhood affairs, and consequently less likely to be sensitive to any purported neighborhood consensus. If a dissident regards her neighborhood as little more than a place to sleep, she can hardly be intimidated into adhering to the neighborhood consensus—if she knew there was one.Footnote 17
Do Residents of Neighborhoods Talk to Each Other?
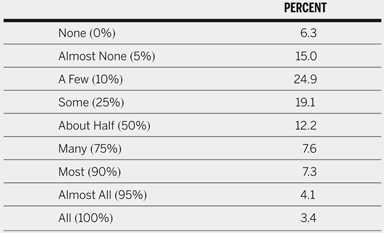
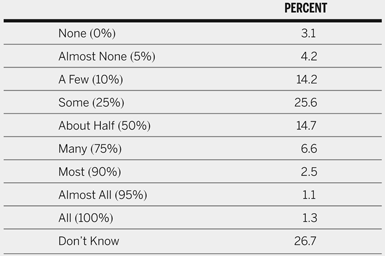
There is direct evidence on this question. A 2005 Georgetown University survey (Howard, Gibson, and Stolle Reference Howard, Gibson and Stolle2005) asked the following question: “Now I want to ask you about people who are not necessarily your close friends. Let's start with your neighbors. How many adults in your neighborhood would you know by name if you met them on the street?” Table 3 reports the responses.
How Many Neighbors Do You Know by Name?

Source: Howard, Gibson, and Stolle Reference Howard, Gibson and Stolle2005
Almost two-thirds (65%) of Americans reports that they could not name more than one out of four residents of their neighborhoods. Almost a majority (46%) report that they could not name more than one out of 10. Evidently American neighborhoods in the 2000s are not places where “everyone knows your name.” For most Americans a close connection to the neighborhood is something seen only in old movies. Today, women are in the labor force not conversing over the backyard fence. In many places the neighborhood school is a relic of the past. People today work long hours, maintain busy after-work schedules, and are more likely to spend leisure time in solitary pursuits than they are to talk to their neighbors on front porches—few of which exist in any case. The clear implication is that contemporary Americans are unlikely to know the political inclinations of their neighbors, let alone be cajoled and bullied into adopting them. Even if people can guess the political inclinations of their neighbors on the basis of lifestyle correlations (e.g., are there beer cans or chardonnay bottles in the curbside recycling bins?), they are unlikely to feel much social pressure from nameless faces who happen to live down the street.
When Neighborhood Residents Talk, Do They Talk Politcs?
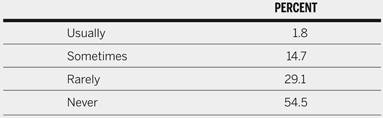
The Georgetown University study (Howard, Gibson, and Stolle Reference Howard, Gibson and Stolle2005) also speaks directly to this question. The survey included a question “When you talk to your neighbors, how often do you discuss political issues?” Table 4 reports the responses. Evidently American neighborhoods are not hotbeds of political debate. An absolute majority of Americans replies “never,” apparently not only still adhering to the old admonition not to discuss politics or religion at the dinner table, but generalizing it to broader arenas. Another 30% say “rarely.” Fewer than two in 100 Americans say “usually.” If these two individuals can create and enforce conformity in their neighborhoods, they are persuasive indeed.
When You Talk to Your Neighbors, How Often Do You Discuss Political Issues?

Source: Howard, Gibson, and Stolle Reference Howard, Gibson and Stolle2005.
Of course, as noted one does not need to talk to a neighbor to infer their political inclinations. If one's neighbor regularly shoots groundhogs in her vegetable garden, the chances are better than even that she is a Republican. Similarly, if your neighbor does yoga in his backyard, the chances are better than even that he is a Democrat. People can infer (albeit with considerable error—according to the exit polls more than 35% of gun owners voted for John Kerry in 2004) the partisanship of their neighbors without ever having a conversation about politics. Happily the Georgetown University survey also included an item that would tap such possibilities: “Of the people you interact with in your neighborhood, how many of them have different political views than yours?”
Although more than four out of five respondents have just said that they rarely or never discuss politics with their neighbors, three-quarters of them at least are willing to hazard a guess about their neighbors' views. Table 5 shows that the majority who do so believe that their political environment is not homogeneous; a majority of Americans believes that at least one out of four neighbors have different views and a quarter believes that half or more of their neighbors have political views different from the respondent.
Of the People You Interact with in Your Neighborhood, How Many of Them … Have Different Political Views from Yours?

Source: Howard, Gibson and Stolle Reference Howard, Gibson and Stolle2005.
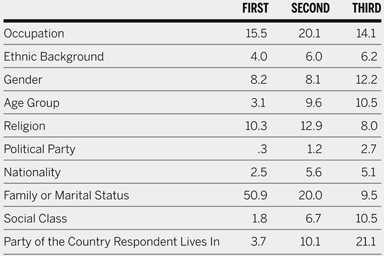
The fact that so many Americans perceive their neighborhoods as politically diverse may partly explain their reluctance to talk politics (table 4). Diana Mutz (Reference Mutz2006, 123) writes that “… people entrenched in politically heterogeneous social networks retreat from political activity mainly out of a desire to avoid putting their social relationships at risk.” Members of the political class may be willing to end friendships over political disagreement, but politics does not rank so highly for most people. Indeed, political affiliation appears to be a surprisingly unimportant part of most people's self-images. Table 6 reports the responses to a survey item on an older (1995) ISSP survey.Footnote 18 The item reads “We are all part of different groups. Some are more important to us than others when we think of ourselves. In general, which in the following list is most important to you in describing who you are? (and the second most important? and the third?).” As shown in the table, of 10 “groups” listed, political party came in dead last: only five respondents out of more than 1,200 thought of themselves first as partisans, and only 51 put party among their top three reference groups.
Most Important Group Respondent Identifies With

In sum, neighborhoods are not important centers of contemporary American life. Americans today do not know their neighbors very well, do not talk to their neighbors very much, and talk to their neighbors about politics even less. And they do not see themselves as swimming in a sea of like-minded people who have intimidated or cast out anyone who believed otherwise; they are aware that their neighbors differ politically. Even if geographic political sorting were ongoing, its effects would be limited by the preceding facts about contemporary neighborhood life.
CONCLUSIONS
The conclusions of this article can be stated in a single compound sentence. There is no evidence that a geographic partisan “big sort” like that described by Bishop is ongoing, and even if it were, its effects would be far less important than Bishop and those who support his thesis fear. We do not categorically deny that subgroups of Americans are becoming more like-minded, that they are becoming increasingly ideologically inbred, and that they have difficulty comprehending people unlike them. As we have argued in a number of earlier publications (Fiorina and Abrams Reference Fiorina and Abrams2009; Fiorina, Abrams, and Pope Reference Fiorina, Abrams and Pope2005), there is evidence that this is occurring among members of the political class, a development we find troubling.
Yet, however important or troubling they may be, such trends are independent of geographic political sorting. A Texas Democrat surrounded by “drill, baby, drill” Republicans can still sit down in the privacy of his living room and write a check to the Environmental Defense Fund. None of his neighbors need know; his reference group is virtual. That is a more common example of political activity today than joining a neighborhood demonstration. Advances in communications technology have made geographic location less important than in earlier eras. Presidential candidates campaigning in Iowa spend money raised from supporters scattered throughout the entire United States, to state only the most obvious example. The simple fact is that a neighborhood big sort could occur without changing either the everyday lives of most Americans or the political process that prevails today.
APPENDIX
State Population Living in “Landslide” Counties (“Landslide” = 60:40 Party Registration Margin)

State Population Living in “Landslide” Counties (“Landslide” = 55:45 Party Registration Margin)

State Population Living in “Landslide” Counties (“Landslide” = Party Registration Majority)