I. INTRODUCTION
Titanium dioxide (TiO2) has now become one of the most efficient and widely used materials in the field of photocatalysis. It was found to display photocatalytic activities under ultraviolet (UV) light by Fujishima and Honda in 1972.Reference Fujishima and Honda1 In 1976, Carey et al. began the study of photocatalytic degradation of pollutants using TiO2 to remove chlorine from polychlorinated biphenyls under UV irradiation.Reference Carey, Lawrence and Tosine2 In 1977, Frank et al. successfully converted CN− to OCN− using TiO2 as a photocatalyst.Reference Frank and Bard3 Presently, photocatalytic technology has been considered as one of the most effective ways to solve the problems of energy and environmental pollution.Reference Perez, Vittorio, Torres, Sham and Pérez4,Reference Primo and Garcia5 TiO2 has many advantages including low cost, nontoxicity, long-term stability, and high photoactivity.Reference Fujishima and Zhang6–Reference Qiu, Xing and Zhang11 However, there are still some obstacles toward its broader applications in photocatalysis and other fields. One of the difficulties to use TiO2 in practice is its wide band gap of about 3.2 eV, which means that it can only be activated by UV irradiation. UV light has a wave length below 380 nm making up only about 5% of the solar energy.Reference Burda, Lou, Chen, Samia, Stout and Gole12,Reference Huang, Li, Wang, Dong, Chu, Zhang and Zhang13 Therefore, it is very important to improve the visible light activity of the photocatalyst. Preparation of titania with high energy crystal facets is a very important method to increase the electron hole pair separation and the photocatalytic activity of the catalyst.Reference Mesgari and Saien14,Reference Xiang, Yu and Jaroniec15 In recent years, the synthesis of photocatalytic TiO2 with high energy (001) crystal facet has become a research hotspot.Reference Lai, Peng, Wang, Wang, Yu, Liub and Zhao16–Reference Li, Chen, Jiang, Shi and Zheng20 For example, Yang et al. in 2008, for the first time, successfully prepared anatase crystal TiO2 with a (001) facet exposure rate of 10%.Reference Yang, Sun, Qiao, Zou, Liu, Smith, Cheng and Lu21 After that, Yang synthesized TiO2 with a 64% (001) facet exposure rate and the TiO2 photocatalytic efficiency was greatly improved.Reference Yang, Liu, Qiao, Sun, Jin, Smith, Zou, Cheng and Lu22 In 2009, Alivov et al. treated the TiO2 nanotube array under a fluorine environment, and the (001) facet exposure rate of the sample was 60%.Reference Alivov and Fan23 In 2010, Liu et al. prepared nanocrystalline (001) anatase TiO2 with 18% (001) facet exposure by the hydrothermal treatment.Reference Liu, Sun, Yang, Smith, Wang, Lu and Cheng24 Subsequently, the hollow spherical TiO2 nanoparticles with 20% (001) facet exposure were synthesized by hydrothermal treatment at 180 °C.Reference Liu, Yu and Jaroniec25 Zhang et al. prepared anatase TiO2 with 80% (001) crystalline (001) facet exposure by the hydrothermal reaction under microwave radiation.Reference Zhang, Dandeneau, Zhou and Cao26 Chen et al. synthesized wafer nanosheet layered spheres with (001) facet exposure of nearly 100%.Reference Chen, Tan, Li, Cheah, Luan, Madhavi, Boey, Archer and Lou27
On the other hand, it is also important to improve the quantum efficiency and photocatalytic activity of the material by modifying its morphology. Mesoporous single-crystal-like (MSCL) TiO2 are promising materials for energy conversion or storage devices since they combine high surface area with large crystalline domain size. TiO2 MSCL has been prepared by silica template strategies.Reference Zheng, Kuang, Yan, Qiu, Qiu and Yang28,Reference Sivaram, Crossland, Leijtens, Noel, Alexander-Webber, Docampo and Snaith29 Recently, MSCL TiO2 has also been prepared by a molten salt method.Reference Li, Chen, Sun, Rao, Han, Hu and Zhou30 The molten salt system is a special reaction medium in favor of controlling crystals growth and pore structure; therefore, it can directly affect intrinsic anisotropic growth due to its lower flowability and diffusivity.Reference Li, Zhao, Lomboleni, Huang and Peng31 However, there have limited research studies on the MSCL TiO2 by using the molten salt system.Reference Yu, Shi, Zhao, Bian, Zhao, Zhou, Waterhouse, Wu, Tung and Zhang32–Reference Zhao, Chen, Bian, Zhou, Waterhouse, Wu, Tung, Smith, O’Hare and Zhang34
In this study, TiO2 with a high (001) facet exposure rate was prepared using HF as a modifier agent, which, at the same time, was also introduced as an F doping agent. Besides, to obtain the MSCL sample, molten mixed nitrates were added. The nitrates can also dope N into the sample under the same procedure. Therefore, nitrogen and fluorine co-doped single-crystal-like TiO2 was prepared by this method. The composition, morphology, and structure of the as-prepared sample were analyzed. The photocatalytic activity of the sample was evaluated by degrading methylene blue (MB) in the visible light region. The samples by this method demonstrated high visible light photocatalytic activity compared with general TiO2 samples which were unmodified by the procedure.
II. EXPERIMENTAL
A. Materials and methods
All chemicals used in this study were purchased from commercial sources and used without further purification. The nitrate-treated N-doped TiO2 and N,F co-doped TiO2 were prepared by the following process. First, 5 mL acetic acid was added to a polytetrafluoroethylene reactor. 2 mL tetrabutyl titanate was added dropwise under intense magnetic stirring; then 5 mL of 2 M urea solution or 5 mL of 2 M urea and HF solution were added. After stirring constantly for 30 min, the mixture was hydrothermally treated at 150 °C for 24 h. Finally, the sample was mixed with NaNO3 and KNO3 at a molar ratio of 5:1:1, and then calcined at 350 °C for 4 h. The prepared nitrate-treated N-doped and N,F co-doped TiO2 samples were abbreviated as N-TiO2 and (N,F)-TiO2 (treated with nitrates). For comparison, N,F co-doped TiO2 samples without mixing with nitrates were also prepared, which were named (N,F)-TiO2. And the samples without urea and nitrate treating were named as pure TiO2.
B. Characterization
The crystal phase of the samples was identified by X-ray diffraction (XRD; Rigaku D/max, Rigaku Corporation, Tokyo, Japan) scanned in the 2θ range of 20–80° at a scanning rate of 4°/min using Cu Kα radiation. The specific surface area, pore size, and pore volume of the samples were evaluated with a surface area analyzer (AutosorbiQ Station-I, Quantachrome Instruments, Boynton Beach, FL) from N2 adsorption isotherms using the Brunauer–Emmett–Teller (BET) method. The mesopore size distribution and mesopore volume were calculated by desorption isotherms. The elemental composition of the samples was measured by X-ray photoelectron spectroscopy (XPS; ESCALAB 250) with a photon energy of 1253.6 eV and with Mg Kα radiation as the exciting source. All the binding energies were referenced to the C 1s peak for calibration. The crystal size and morphology of the samples were obtained by scanning electron microscopy (SEM; JEOL S-500, JEOL Ltd., Tokyo, Japan). The as-prepared samples were ground in a mortar for over 10 min. Ethanol solutions of the samples were treated by using an ultrasonic cleaner (JP-020S, JIEMENG Ltd., Shenzhen, China) for over 2 h. Several drops of the ethanol solution were dripped onto the copper wire meshes. After over 24 h of air drying, the meshes were examined by transmission electron microscopy (TEM) and high resolution transmission electron microscopy (HRTEM) (JEOL JEM-2100F, JEOL Ltd., Tokyo, Japan). The UV-Vis absorption spectra of the samples were recorded on a UV-vis scanning spectrophotometer (Perkin-Elmer, Lambda 900, Boynton Beach, FL) in the range of 200–800 nm equipped with an integrated sphere with barium sulfate (BaSO4) as the reference. The band gap energy was estimated by extrapolating the linear part of the (Ahv)1/2 versus hv curve to the energy axis.
C. Evaluation of photocatalytic activity
The photocatalytic performance of the samples was tested under visible light irradiation by decomposition of MB in aqueous media (5 mg/L). The experiment with the liquid photocatalytic reaction was carried out in the reaction test tubes that were located axially in a ring whirligig test tube rack (XPA-7, Xujiang Ltd., Nanjing, China). A xenon lamp (Lap Pu, XQ) of 500 W with a 420 nm cut-off filter right above the reactor was used as the light source to provide only visible light in the center. In each 50 mL 5 mg/L MB aqueous solution, 0.05 g photocatalysts were added.Reference Zheng, Yu, Long and Li35 Before photoreaction, the suspension was treated with ultrasound and stirred in the dark for about 30 min to reach the adsorption–desorption equilibrium between photocatalysts and MB. During the degradation process, the suspension in the test tube under the visible light irradiation was stirred by magnetic force. For every 30 min of interval, the supernatant liquid was sampled out and centrifuged to remove the photocatalysts from the suspension. The resultant transparent solutions were examined by UV/vis spectroscopy (722 s) at 662 nm to obtain the absorbance of the MB solution.
III. RESULTS AND DISCUSSION
A. Composition analysis
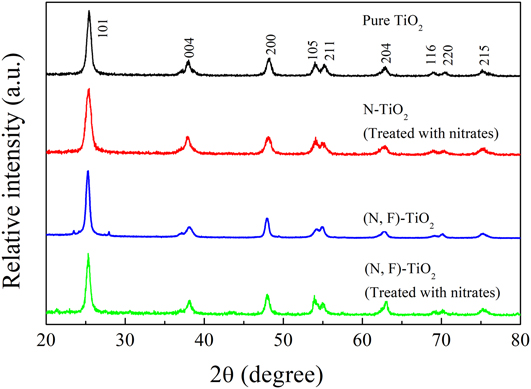
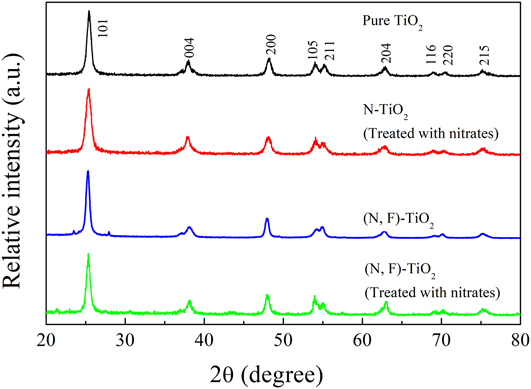
Figure 1 shows typical XRD patterns of pure TiO2, N-TiO2 (treated with nitrates), (N,F)-TiO2, and (N,F)-TiO2 (treated with nitrates) samples. All the samples are observed to have obvious diffraction peaks at 2θ = 25.30, 37.87, and 48.18°, which correspond to the (101), (004), and (200) facets of the anatase (JCPDS card No. 21-1272).Reference Huang, Xiao, He, Zhang, Dong, Du and Zhang36,Reference Huang, He, Li, Li, Zeng, Dong, Du, Zhang and Zhang37 All the diffraction peaks of pure TiO2, N-TiO2 (treated with nitrates), (N,F)-TiO2, and (N,F)-TiO2 (treated with nitrates) samples can be indexed to the unique anatase phase, indicating that the doping with nitrogen or nitrogen and fluorine into TiO2 would not produce any new phases.Reference Lyu, Liu, Wang and Tian38 Furthermore, there are no nitrogen-originated XRD peaks located in the samples, which is probably due to the low dopant content in the samples below the detection limit of the XRD test. Besides, it may also because the dopants are dispersed in the lattice of TiO2.Reference Cheng, Yu, Xing and Yang39,Reference Wang, Shen, Feng and Li40
Typical XRD patterns of pure TiO2, N-TiO2 (treated with nitrates), (N,F)-TiO2, and (N,F)-TiO2 (treated with nitrates) samples.
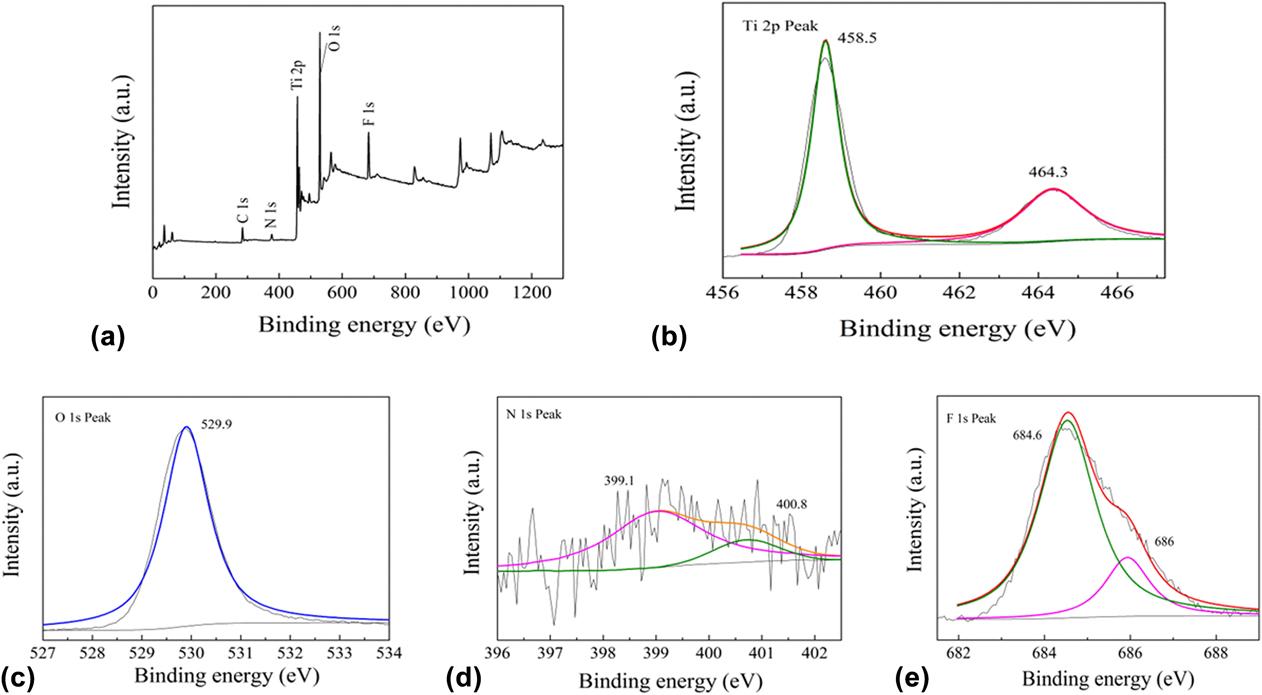
The chemical compositions of the samples were analyzed by the XPS test. Figure 2(a) shows the XPS of the (N,F)-TiO2 (treated with nitrates) sample. The elements Ti, N, F, and O are present in the sample, corresponding to the peak of Ti 2p (458.5 eV), N 1s (400 eV), F 1s (684.6 eV), and O 1s (529.9 eV). The peak of C 1s (284.6 eV) is the XPS spectral icon quasi peak. The results show that TiO2 doped with nitrogen and fluorine is successfully synthesized in this experiment.
Typical XPS results of the (N,F)-TiO2 (treated with nitrates) sample: (a) survey spectrum, (b) Ti 2p peaks, (c) O 1s peaks, (d) N 1s peaks, and (e) F 1s peaks.
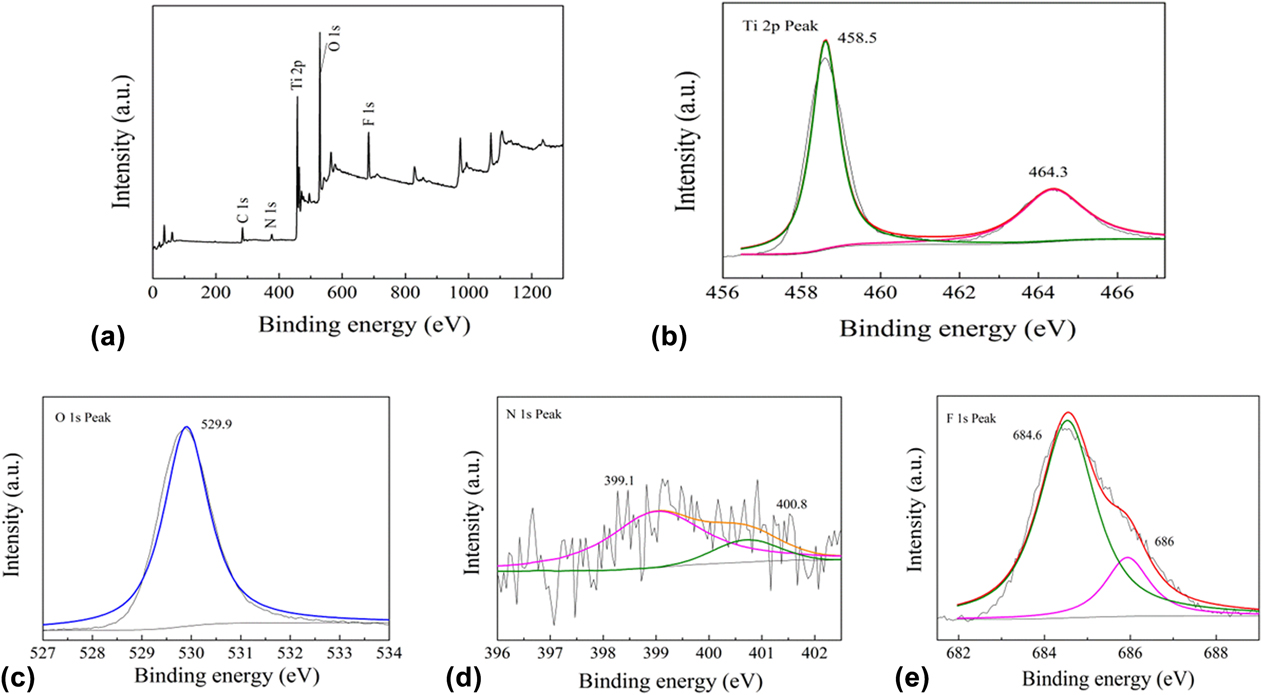
Figure 2(b) shows the XPS spectrum of the sample in the Ti 2p region. The spectra of Ti 2p show two main peaks, which are located at 458.5 and 464.3 eV. They are attributed to the Ti 2p 3/2 and Ti 2p 1/2 species, respectively. And the peak is symmetrical, thus it can be determined that the Ti elements mainly exist in the form of Ti4+ (TiO2).Reference Kassahun, Kiflie, Shin, Park, Jung and Chung41
Figure 2(c) shows the O 1s spectrum of the sample. The peak of the binding energy is 529.9 eV, which represents the O–Ti–O bond, and it can be determined that the O elements exist mainly in the form of O2−.Reference Jagadale, Takale, Sonawane, Joshi, Patil, Kale and Ogale42 The XPS of the (N,F)-TiO2 (treated with nitrates) sample in the N 1s region is shown in Fig. 2(d). The peak present at 400 eV indicates that nitrogen is successfully incorporated into TiO2. This N 1s peak can also be separated into two peaks. The peak at 399.1 eV can be attributed to the N existed in the form of O–Ti–N. The other peak located at 400.8 eV can be attributed to the N in the bond of N–O, which may be the NO adsorbed on the surface of the sample and/or in the bond of Ti–O–N.Reference Naik, Moon, Kim and Park43 Because the NO has strong oxidizability, it is very favorable for the photocatalytic reaction.
Figure 2(e) shows the XPS spectrum of the sample in the F 1s region. The peak appears to be around 684.6 eV. This F 1s peak can be separated into two peaks located at 686 eV and 684.6 eV, respectively. The peak at 686 eV can be attributed to the F in the form of Ti–F in the TiO2. This result shows that the F is incorporated into the TiO2 lattice. The other peak located at 684.6 eV can be attributed to the F ions that adsorbed on the surface of TiO2.Reference Jyothi, Souza Laveena, Shwetharani and Balakrishna44 This form of F ions can react with OH− in water to form hydroxyl radicals. And the catalytic activity of a hydroxyl radical in the aqueous solution is higher than that on the surface of the catalyst. Therefore, it can degrade organic dyes in aqueous solution more quickly.
B. Morphological structure
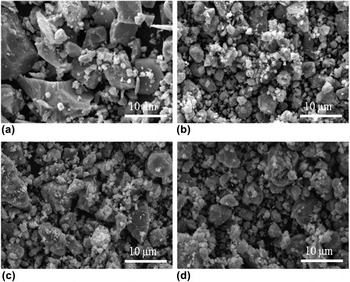
Figure 3 shows the SEM morphology of the samples. As can be seen from Fig. 3(a), pure TiO2 is composed of uneven sized particles with grain size often over 10 µm. The size of other three TiO2 samples is obviously much small in the grain size as shown in Figs. 3(b)–3(d). Therefore, small irregular grains are observed to adhere onto the large particles with the particle size ranging from a few nanometers to a few microns. It can be concluded that nitrogen doping may lead to grain refinement and agglomeration reduction.Reference Huang, Liu, Chen, Zhang, Zhang and Wang45
Typical SEM images of (a) pure TiO2, (b) N-TiO2 (treated with nitrates), (c) (N,F)-TiO2, and (d) (N,F)-TiO2 (treated with nitrates) samples.

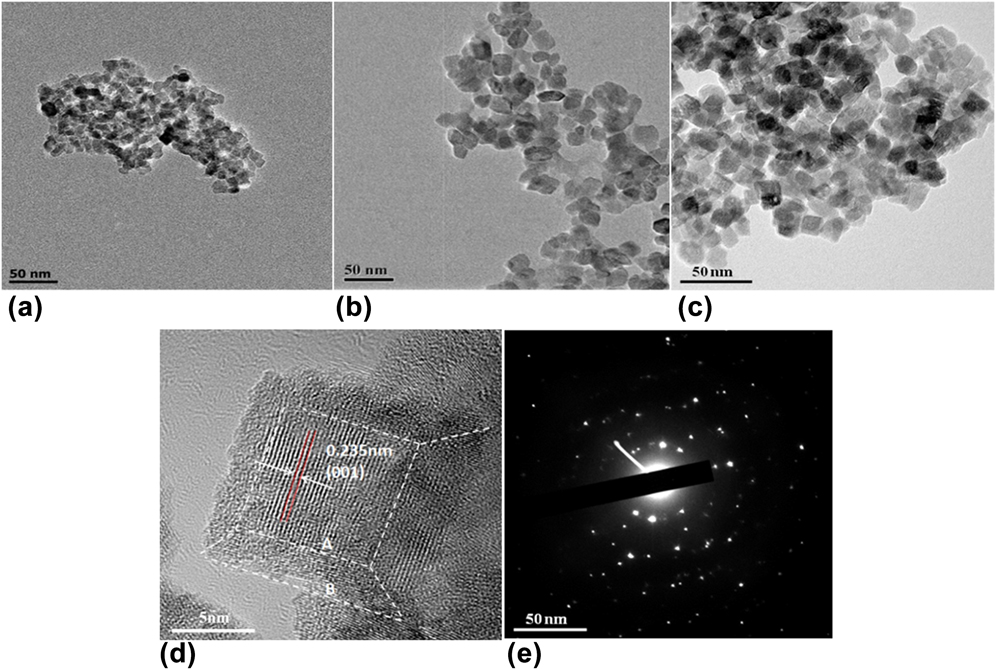
Figure 4 shows the morphology of TiO2 samples. From Figs. 4(a)–4(c), these sample grains are small particles that are attached together. N-TiO2 (treated with nitrates) and (N,F)-TiO2 samples are irregular nanocrystals, while (N,F)-TiO2 (treated with nitrates) exhibits cubic crystalline grains. According to the particle size distribution (Fig. S1), it is estimated that the average particle size of N-TiO2 (treated with nitrates) is about 7 nm, while the diameter of (N,F)-TiO2 (treated with nitrates) is about 13 nm. Fluorine doping enlarged the particle grain to some extent. The reason may be related to the energetic surfaces of the crystal sample caused by the HF.Reference Han, Kuang, Jin, Xie and Zheng46,Reference Wang, Lv, Wang, Deng and Tang47
TEM (a–c) of N-TiO2 (treated with nitrates), (N,F)-TiO2, and (N,F)-TiO2 (treated with nitrates) samples, HRTEM (d) and SAED (e) images of the (N,F)-TiO2 (treated with nitrates) sample.
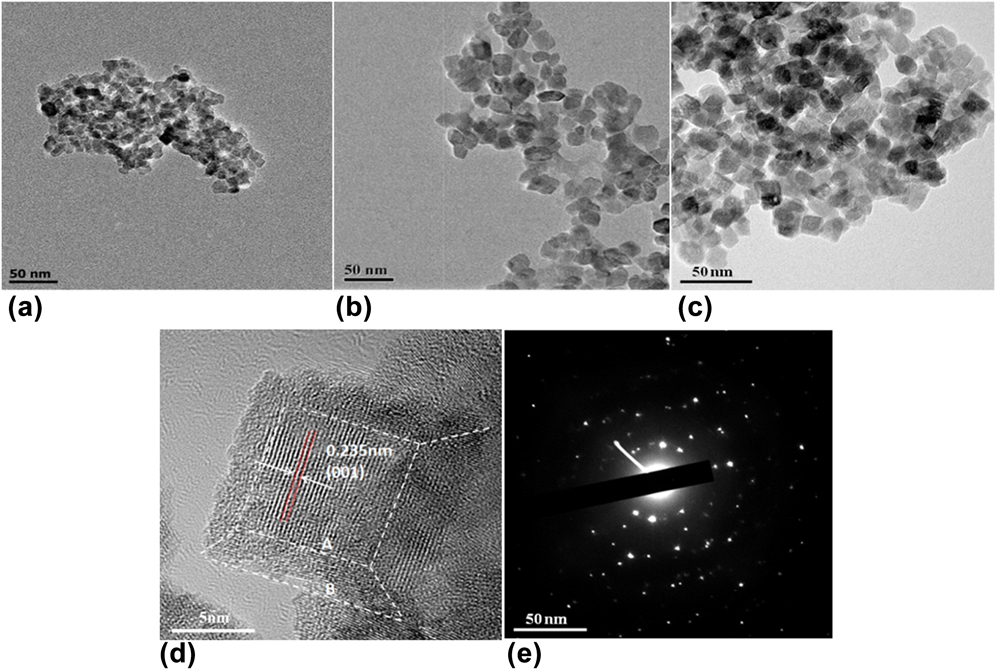
From HRTEM micrographs of Fig. 4(d), it is clear that (N,F)-TiO2 (treated with nitrates) is a nanocubic block. The crystalline spacing of the sample is 0.235 nm, which matches the anatase phase TiO2 (001) surface.Reference Liu, Tian, Tan, Li and Chen48,Reference Li, Han, Wang, Zheng, Wan and Ni49 But in the XRD test, according to the extinction rule, there is no (001) diffraction peak. The high energy (001) surface is exposed by the synergistic effects of molten salt and the etching of HF. Due to the low fluidity and diffusivity of mixed nitrates, relatively slow nucleation and growth rates can be induced, thus the grain growth is suppressed. TiO2 can be modified by F to expose the high-energy surface of TiO2 under relatively stable conditions.Reference Shet, Ahn, Deutsch, Wang, Ravindra, Yan, Turner and Al-Jassim50,Reference Prochazka, Kavan, Zukalova, Janda, Jirkovsky, Zivcova, Poruba, Bedu, Döbbelin and Tena-Zaera51
However, the exposure of energetic surfaces may also promote the growth of grains. Therefore, the average diameter of (N,F)-TiO2 (treated with nitrates) is greater than that of N-TiO2 (treated with nitrates). While the grain of the (N,F)-TiO2 samples without nitrate treating grow larger during calcination. According to the symmetries of anatase TiO2, the two square surfaces in the crystal of the (N,F)-TiO2 (treated with nitrates) sample can be assigned to the (001) facet, and the eight isosceles trapezoidal surfaces are (101) facets. On the basis of the shape-dependent thermodynamic model, the value of B/A [the length parameters illustrated in Fig. 4(d)] and the percentage of (001) facet can be roughly predicted.Reference Wen, Li, Liu, Fang, Xie and Xu52 The calculation of the exposure rate of the TiO2 energetic surfaces has been reported in the literature.Reference Ishibashi, Fujishima, Watanabe and Hashimoto53–Reference Yu, Dai, Xiang and Jaroniec55 In this experiment, according to this method, the high energy surface exposure rate of the (N,F)-TiO2 (treated with nitrates) sample was as high as 78%. The exposed (001) energetic surface can produce more electron hole pairs. Hydroxyl radicals are produced in the condition of oxides in aqueous solution and the (001) high energetic surface. The produced hydroxyl radicals can effectively improve the photocatalytic activity to degrade organic dyes in solution. Additionally, from the electron diffraction pattern of the (N,F)-TiO2 (treated with nitrates) sample in Fig. 4(e), we can see that the sample is of a single crystal structure. Besides, as discussed above, because the formation of the (001) high energetic facet, the crystal particle tends to grow larger to reduce its surface energy. Therefore the sample (N,F)-TiO2 (treated with nitrates) has larger particle size than the N-TiO2 (treated with nitrates). This is consistent with the crystal particle test as shown in Fig. 4 and the discussion above that fluorine doping can enlarge the particle grain to some extent.
The recorded N2 adsorption–desorption isotherms for the samples show that the pure TiO2, N-TiO2 (treated with nitrates) and (N,F)-TiO2 samples belong to the type IV with the H2 hysteresis loop, indicating the existence of the mesoporous structure according to the IUPAC classification (Fig. S2). The formation of the mesoporous structure is probably due to the shrinking of crystals at high temperatures, which leaves space in the crystals.Reference Huang, Cao, Yu, Xu, Hao, Wang, Dong, Zhang and Zhang56 However, the (N,F)-TiO2 (treated with nitrates) sample belongs to the type IV with the H4 hysteresis loop. This indicates that the mesoporous structure of the samples is formed by the accumulation of the mesopores and the cubic crystalline grains existed in the sample.Reference Huang, Xiao, Zhang, Dong and Zhang57,Reference Xie, Bian, Yao, Hao and Wei58
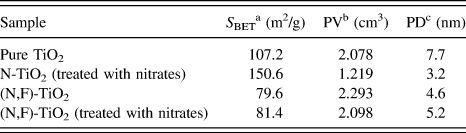
According to the measured results by the BET method, the specific surface area, pore size, and pore volume of the samples were calculated. The results are listed in Table I. The specific surface area of the (N,F)-TiO2 is the minimum of the three samples (79.6 m2/g), followed by the (N,F)-TiO2 (treated with nitrates) (81.4 m2/g), and the sample N-TiO2 (treated with nitrates) has the maximum specific surface area, which is up to 150.6 m2/g. The small specific surface area of the (N,F)-TiO2 (treated with nitrates) may be due to the high energy exposure which can promote the grain growth. And for the (N,F)-TiO2 samples, the calcination without the nitrates can induce the grain growth, resulting in the decrease of its specific area.
Structural properties of pure TiO2, N-TiO2 (treated with nitrates), (N,F)-TiO2, and (N,F)-TiO2 (treated with nitrates) samples.

a The specific surface area was calculated using BET equation.
b Pore volume.
c Pore diameter.
C. Photocatalytic properties
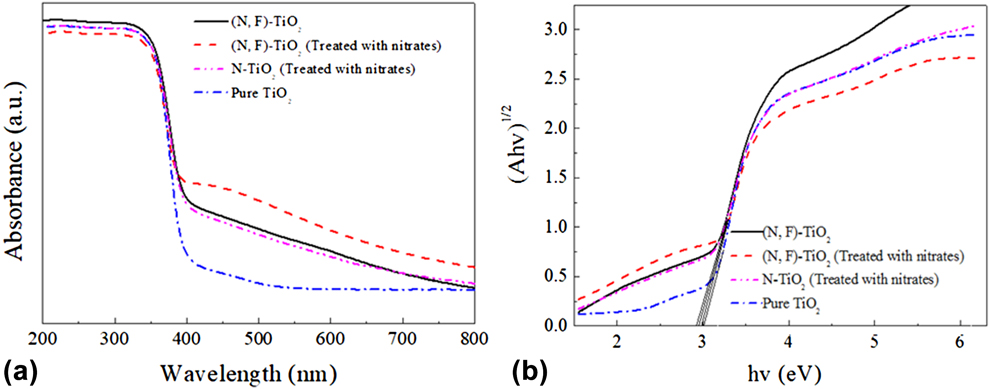
Figure 5(a) shows the UV-Vis absorption spectra of the samples, which include pure TiO2, N-TiO2 (treated with nitrates), (N,F)-TiO2, and (N,F)-TiO2 (treated with nitrates). The light absorption of pure TiO2 is limited to the UV region, while the absorption wavelengths of (N,F)-TiO2 and (N,F)-TiO2 (treated with nitrates) extend from 380 to 600 nm. The N and F co-doping results in a red shift compared with that of the pure TiO2. Moreover, the absorption capacity of the three N and F co-doped samples to the visible light was remarkably improved. Among them, the (N,F)-TiO2 (treated with nitrates) sample has the most obvious increase in the light absorption capacity in the visible region. This may be due to the incorporation of nitrogen into TiO2 as shown and discussed in Fig. 2(d). It is speculated that the N 2p and O 2p orbitals may hybridize and new impurity energy level may generate over the TiO2 valence band.Reference Huang, Han, Li, Wang, Chu and Zhang59,Reference Selvam, Balachandran, Velmurugan and Swaminathan60 Analogously, when F is doped into TiO2, there may also form an impurity energy level below the TiO2 conduction band.Reference Yan, Chen, Zou and Wang61–Reference Valentin, Finazzi and Pacchioni63 This impurity energy level can reduce the band gap and the energy needed to excite the electron transition. In this case, the visible light may be able to provide sufficient energy for the electron transition. As a result, the utilization of the sample (N,F)-TiO2 (treated with nitrates) to visible light can be improved, and its photocatalytic reaction can also be promoted.
(a) UV-Vis absorption spectra of the pure TiO2, N-TiO2 (treated with nitrates), (N,F)-TiO2, and (N,F)-TiO2 (treated with nitrates) samples, and (b) their corresponding Kubelka–Munk curves.
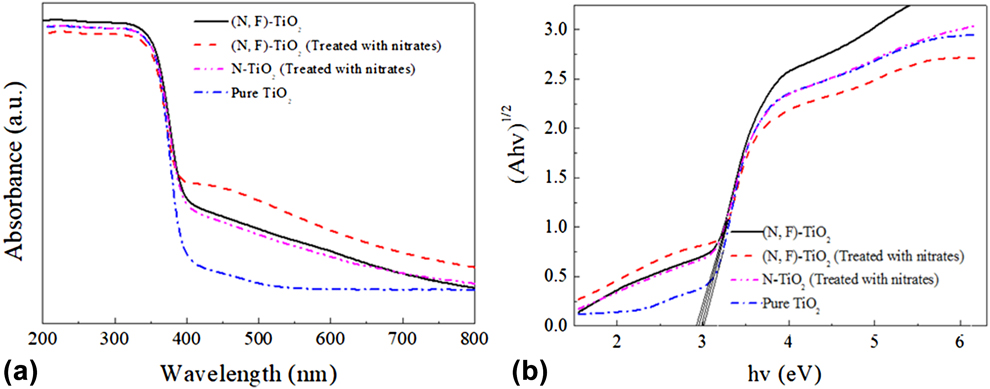
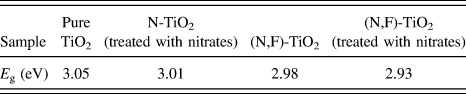
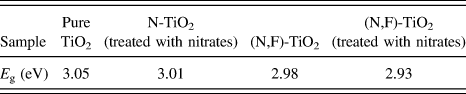
Figure 5(b) shows the Kubelka–Munk curves of the samples obtained via the transformation based on the (Ahν)1/2 versus energy of the absorbed light. The band gap values of the pure TiO2, N-TiO2 (treated with nitrates), (N,F)-TiO2, and (N,F)-TiO2 (treated with nitrates) samples are estimated by the Kubelka–Munk curves as shown in Table II. They are 3.05, 3.01, 2.98, and 2.93 eV, respectively. There into, the band gap value of the (N,F)-TiO2 (treated with nitrates) sample is the highest. It is consistent with the fact shown in Fig. 5(a) that there is an obvious red shift for the (N,F)-TiO2 (treated with nitrates) sample and its visible light absorption has remarkably improved.
Band gap energy (E g) of pure TiO2, N-TiO2 (treated with nitrates), (N,F)-TiO2, and (N,F)-TiO2 (treated with nitrates) samples.
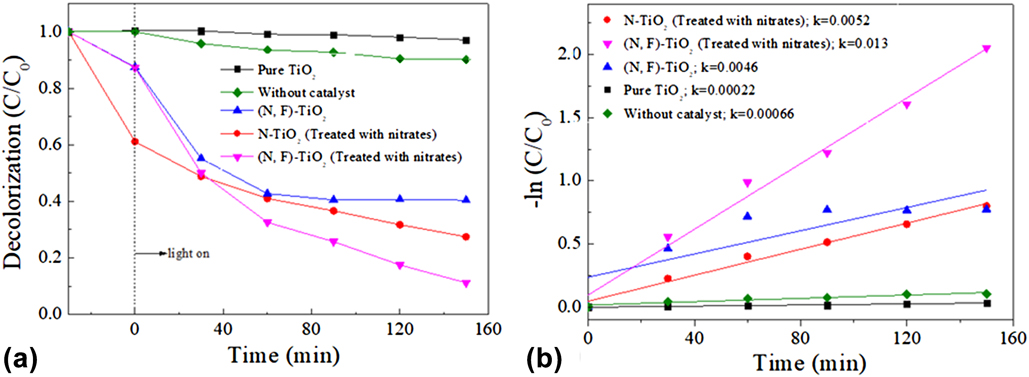
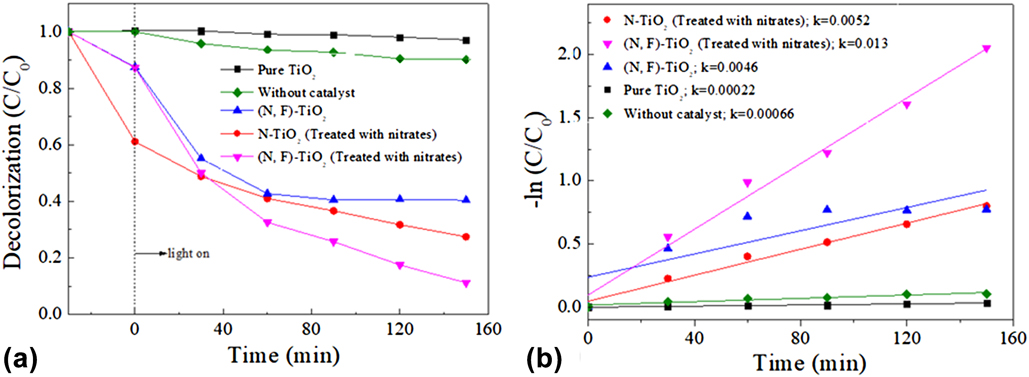
The photocatalytic activities of the pure TiO2, N-TiO2 (treated with nitrates), (N,F)-TiO2, and (N,F)-TiO2 (treated with nitrates) samples are evaluated by the degradation of MB versus irradiation time under visible light. The results are shown in Fig. 6(a). A blank sample was used as a control. The decolorization rate of MB without the catalyst is 10% after 150 min of irradiation time. The decolorization rate of MB with the (N,F)-TiO2 (treated with nitrates) sample is 89%, and it is the highest among the several samples. Under the same conditions, decolorization rate is 73 and 60% for the N-TiO2 (treated with nitrates) and the (N,F)-TiO2 samples, respectively, while the pure TiO2 has almost no catalytic activity in visible light region. The linear relationship between the reaction time and –ln(C/C 0) is shown in Fig. 6(b). The figure indicates that the degradation of MB follows the first-order kinetics. The rate constants of the pure TiO2, N-TiO2 (treated with nitrates), (N,F)-TiO2, and (N,F)-TiO2 (treated with nitrates) samples are estimated to be 0.00022, 0.0052, 0.0046, and 0.013 min−1, respectively. The maximum rate constant of the sample (N,F)-TiO2 (treated with nitrates) shows that it has best photocatalytic performance.Reference Wen, Li, Liu, Fang, Xie and Xu52,Reference Huang, Xiao, Tian, Dong, Zhang, Du and Zhang64–Reference Wu, Liu, Qiu, Li, Zhou, Fang, Zhang and Li67 To demonstrate the stability of catalysts, the catalytic activity of (N,F)-TiO2 (treated with nitrates) has been performed five runs under the same conditions after centrifugal separations. The results illustrate that the MB degradation rate only slightly decreases after repeated irradiation for near 800 min, which indicates sufficient stability of the present photocatalyst for MB degradation (Fig. S3).
(a) Degradation curves of MB by the catalysis of pure TiO2, N-TiO2 (treated with nitrates), (N,F)-TiO2, and (N,F)-TiO2 (treated with nitrates) samples under visible light irradiation, and (b) their corresponding plots of –ln(C/C 0).
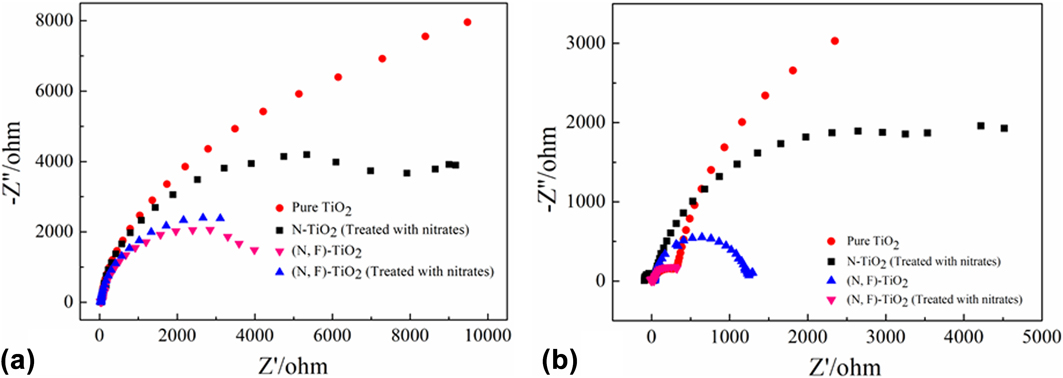
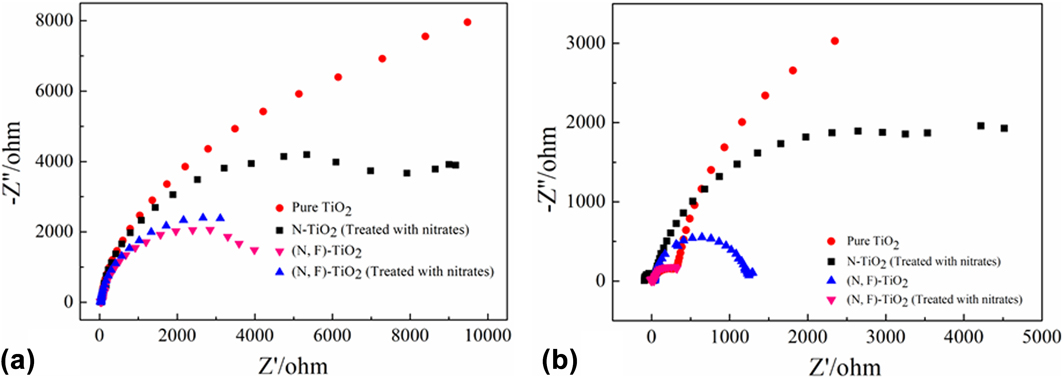
As the electrochemical impedance spectra (EIS) Nyquist plots are supposed to indicate the charge separation and transfer process in the electrode−electrolyte interface region,Reference Huang, He, Lin, Kang and Zhang68 the EIS technology was used to study the photocatalytic performance.Reference Huang, Tu, Zeng, Zhang, Reshak and Zhang69 Figure 7 shows Nyquist plots of the as-prepared samples before and after visible light irradiation. It can be observed that the arc radius of (N,F)-TiO2 (treated with nitrates) is the smallest one, which indicates that this sample exhibits a higher separation and transfer efficiency of photogenerated e–h pairs.Reference Tian, Xu, Alnafisah, Wang, Tan, Oyler, Liu and Chen70–Reference Liu and Chen72
EIS Nyquist plots of the samples with (a) light off/(b) light on cycles under the irradiation of visible light (A xenon lamp with a cut-off filter λ ≥ 420 nm, [Na2SO4] = 0.1 M).
The investigation of the reactive oxidation species in the photocatalytic process is very important to the explication of the photocatalytic mechanism. To trap the reactive oxidation species in experiments, under the same experiment condition for each photocatalytic test on MB by (N,F)-TiO2 (treated with nitrates), 1 mM TBA and BQ, as scavengers of hydroxyl radicals (˙OH) and superoxide radicals (˙O2−), were added into the reaction system, respectively.Reference Li, Zhao, Lomboleni, Huang and Peng31 Figure S4 shows the degradation curves of MB by the catalysis of (N,F)-TiO2 (treated with nitrates) in the presence of scavengers under visible light irradiation. It can be seen that the photocatalytic efficiency was both decreased. There into, the TBA is of higher inhibition efficiency for degradation of MB (54.8%). Thus, it could be speculated that ˙OH serves as the main reactive oxidation species for the photodegradation of MB under sunlight irradiation.
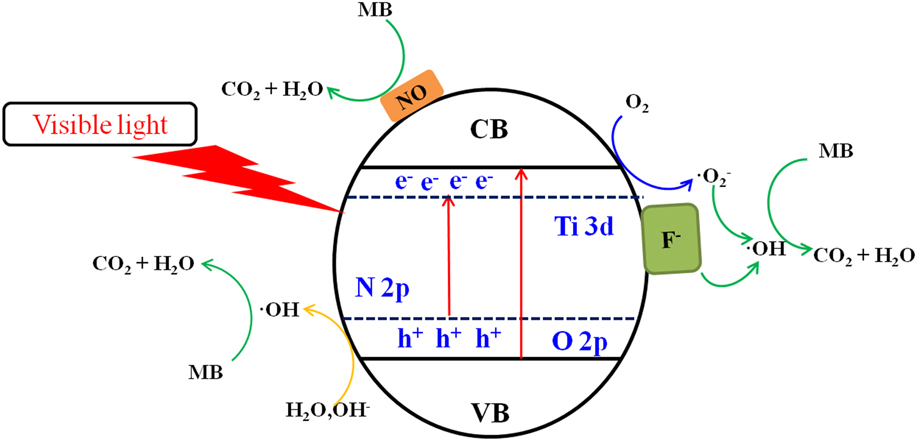
Based on the above experimental results and discussion, the possible photocatalysis mechanism is illustrated in Fig. 8. The gradient in the energy band represents the mixing of the N 2p and O 2p atomic orbitals.Reference Prochazka, Kavan, Zukalova, Janda, Jirkovsky, Zivcova, Poruba, Bedu, Döbbelin and Tena-Zaera51,Reference Wen, Li, Liu, Fang, Xie and Xu52 The nitrogen doping in the TiO2 lattice can create an intra-band-gap state (N 2p), which are located above the valence band edge (O 2p). Thus, the electron-excited driving force by the N 2p level is increased. On the other hand, the (N,F)-doped sample has a better photocatalytic performance than the N-doped sample. The possible explanation is that a Ti–F bond is formed in the sample, and an impurity energy level is also formed below the TiO2 conduction band.Reference Huang, Tu, Zeng, Zhang, Reshak and Zhang69,Reference Cheng, Chen, Lin, Liu and Kong73
Mechanism for photocatalytic degradation of MB over (N,F)-TiO2 (treated with nitrates) photocatalysts under visible light irradiation.
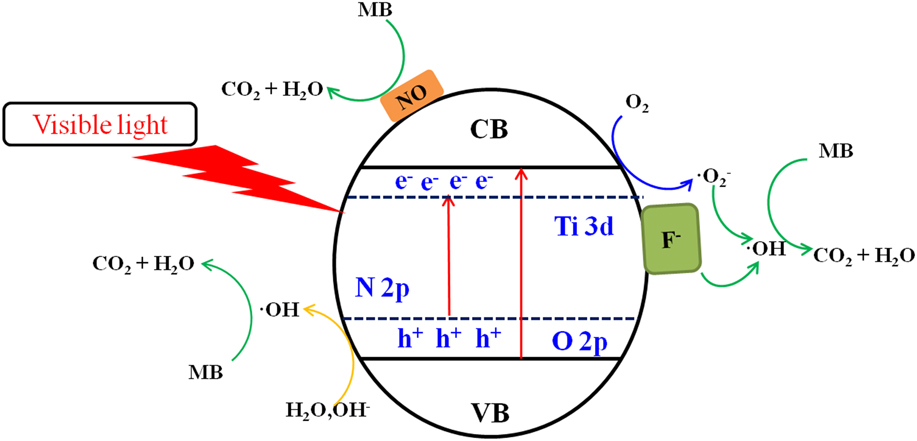
The F ion has a strong electronegativity so that the Ti–F groups on the surface can act as the electron capture sites. These electron capture sites can trap the excited electrons and reduce the absorbed O2 to superoxide radicals O2− [seen in the Eq. (2)], thereby reducing the recombination of electrons and holes.Reference Zhang, Wu, Xing, Leghari and Sajjad74,Reference Li, Liu, Luo, Li, Huang, Li, Fang, Xu and Zhu75
The major reactions in this photocatalytic mechanism are summarized by the following steps:
 $$\left( {{\rm{N,F}}} \right){\rm{ ‐ Ti}}{{\rm{O}}_2}\left( {{\rm{treated}}\;{\rm{with}}\;{\rm{nitrates}}} \right) + {\rm{visible}}\;{\rm{light}} \to \left( {{\rm{N,F}}} \right){\rm{ ‐ Ti}}{{\rm{O}}_2}\left( {{\rm{treated}}\;{\rm{with}}\;{\rm{nitrates}}} \right)\left( {{{\rm{e}}^ - } + {{\rm{h}}^ + }} \right)\quad ,$$
 $${{\rm{O}}_2} + {{\rm{e}}^ - } \to {}^ \bullet {{\rm{O}}_2}^ - \quad ,$$
 $${}^{\rm{ \bullet }}{{\rm{O}}_2}^ - + {{\rm{H}}^{\rm{ + }}} + {{\rm{e}}^ - } \to {}^{\rm{ \bullet }}{\rm{OH}} + {\rm{O}}{{\rm{H}}^ - }\quad ,$$
 $${\rm{O}}{{\rm{H}}^ - } + {{\rm{h}}^ + } \to {}^ \bullet {\rm{OH}}\quad ,$$
 $${}^ \bullet {\rm{OH}} + {\rm{MB}} \to {\rm{degradation}}\quad ,$$
and
 $${\rm{NO}} + {\rm{MB}} \to {\rm{degradation}}\quad .$$
IV. CONCLUSIONS
In this study, (N,F)-co-doped MSCL TiO2 was prepared by a new molten salt method. The molten nitrates can be used as the morphology modifier in the formation of the MSCL TiO2, and it can also be used as an N doping agent in the same process. This material also has a high (001) surface exposure rate of 78%, meanwhile HF is used as the (001) crystal facet modifier and also used as an F doping agent. The exposed high energy crystal facet can produce more electron hole pairs; therefore, it can effectively improve the photocatalytic activity of the catalyst. The N and F co-doping can reduce the band gap of the as-prepared sample from 3.05 to 2.93 eV and then improve its utilization of the visible light. In addition, the presence of NO and fluorine ions on the surface of the sample can also help to enhance the photocatalytic performance. Therefore, the (N,F)-TiO2 (treated with nitrates) has the best photocatalytic ability among the samples of pure TiO2, (N,F)-TiO2, and N-TiO2 (treated with nitrates).
Supplementary Material
To view supplementary material for this article, please visit https://doi.org/10.1557/jmr.2018.106.
ACKNOWLEDGMENTS
This project is financially supported by the Fundamental Research Funds for the Central Universities of China No. 2652017150, and the innovative experiment projects of China University of Geosciences (Beijing) Nos. 2017BXY033 and 2017BXY034.