Introduction
Milk transportation continues to be a major challenge in developing countries due to the perishable nature of raw milk (Martins et al., Reference Martins, Marinho, Fischer, Pereira, Los and de Souza Martins2024). Traditional methods typically involve refrigerated containers for smaller loads and insulated tankers with rigid polyurethane foam for larger volumes. Several studies have explored improvements in insulation, such as vacuum panels (Verma and Singh, Reference Verma and Singh2019), phase change materials (Ahmed et al., Reference Ahmed, Meade and Medina2010), and porous inorganic fillers (Yatsenko et al., Reference Yatsenko, Goltsman, Novikov, Izvarin and Rusakevich2022). These solutions have demonstrated better insulation performance than rigid polyurethane foam. Additionally, recent research has further emphasized the importance of airflow optimization for improved cooling efficiency, focusing on design modifications aimed at enhancing the performance of refrigerated containers using CFD methods. Senguttuvan et al. (Reference Senguttuvan, Youn, Park, Lee and Kim2020) investigated the distribution of airflow inside refrigerated containers by analysing 15 different refrigeration unit designs. Their findings revealed that optimized refrigeration unit designs can improve jet velocity, vertical velocity, and heat transfer, leading to a more uniform temperature distribution. Hui et al. (Reference Hui, Vigneault, Sotocinal, de Castro and Raghavan2008) demonstrated that pinwheel stack configurations significantly improve air circulation compared to offset patterns. Jiang et al. (Reference Jiang, Xu, Luo, Deng, Wang, Gao and Zhang2020) proposed an internal structure with baffles that reduces cold airflow loss and increases vertical velocity by up to 425.04%, thereby reducing cooling time. Alexander et al. (Reference Alexander, Jakhar and Dasgupta2024a) investigated the effectiveness of using cassette-type fan coil units (CT-FCUs) as an alternative to improve airflow and temperature uniformity within cold storage. The study demonstrates that the performance index was improved up to 41.1%, and the temperature heterogeneity was 41.3% lowered. Alexander et al. (Reference Alexander, Jakhar and Dasgupta2024b) optimized cold storage conditions for apples by achieving uniform airflow and temperature distribution. The research focused on how different stacking arrangements of apple crates impact airflow and temperature distribution. The research highlights the importance of proper crate stacking to ensure adequate air circulation and prevent temperature heterogeneity. Various techniques are commonly found on farms (Sah et al., Reference Sah, Choudhury, Das and Sur2017), where farmers use refrigerated tanks to quickly reduce milk temperature from 38°C leaving the cow to 4°C (Al-Shannaq et al., Reference Al-Shannaq, Auckaili and Farid2022; Jiang et al., Reference Jiang, Xu, Hu and Dai2023). Sur et al. (Reference Sur, Sah and Pandya2020) explores a milk storage system powered by solar thermal energy and adsorption cooling, designed to meet the needs of remote areas with limited electricity access. The results demonstrate that this solution can ensure effective milk preservation, reducing losses and improving food safety in areas without reliable electrical infrastructure. While these approaches primarily address refrigerated containers for small loads, they leave a gap in effective cooling solutions for the transportation of larger milk volumes using tankers. In light of this, the present study proposes a numerical analysis of thermo-convective flow within a milk tanker using CFD. The goal is to explore flow fields and temperature distributions, and to identify innovative solutions for enhancing milk transportation. By incorporating an immersed evaporator coil, the study aims to improve cooling efficiency through direct contact. Additionally, the effects of evaporator length and temperature will be analysed.
Computational approach
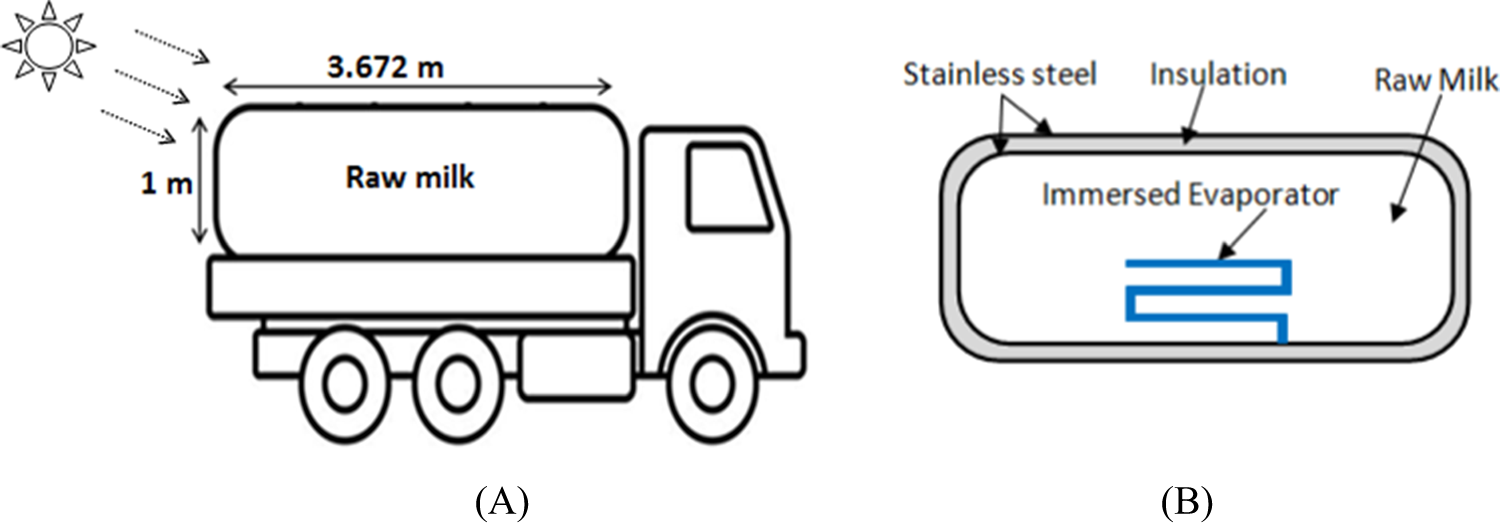
Figure 1 illustrates the main components of the milk tanker used for transporting raw milk. The central structure is a cylindrical tank of an average volume, consisting of an inner and outer layer of stainless steel, with a layer of polyurethane foam between them. During transport, the tank absorbs solar radiation and ambient heat, which can raise the temperature of the milk and lead to spoilage. To counteract this, the study proposes the use of an evaporator coil immersed directly in the milk, which would enhance cooling efficiency by directly targeting the milk and providing faster cooling times.
(A) Schematic view of the milk tanker, (B) components of the tank.

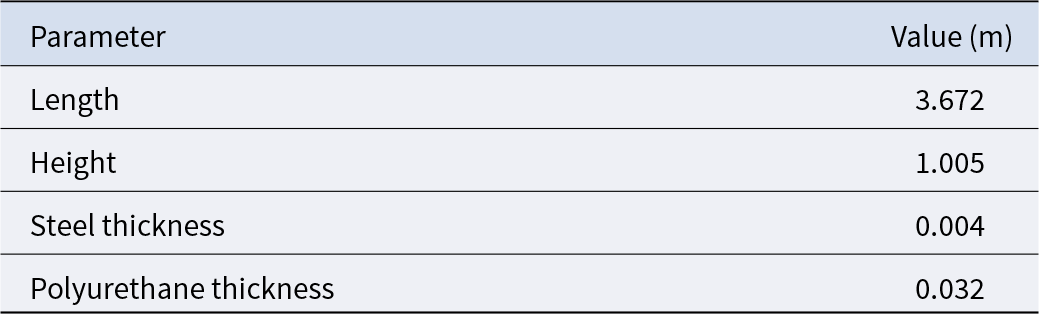
The dimensions of the tanker and the thermophysical properties of its components
The dimensions of the tanker under study and the thermophysical properties of the various components used are presented in Tables 1 and 2, respectively. These precise dimensions were provided by a milk production unit for a real tanker dedicated to transporting raw milk.
Tanker design parameters

Thermophysical properties

Where ρ is the density, Cp is specific heat, k is the thermal conductivity μ is the dynamic viscosity and α is the absorption coefficient.
Mathematical model
▪ The study employs a 2D unsteady laminar flow model, assuming incompressible Newtonian fluid behaviour. Thermophysical properties are considered constant except for density, which varies with temperature. The effect of solar radiation is incorporated into the model. The effect of pressure on the density is neglected. The density is calculated using an approximation that takes into account that the effect of temperature can be expressed in accordance with the following equation:
 \begin{equation}{\rho} = \frac{{{{{P}}_{{{op}}}}}}{{\frac{{{R}}}{{{{{M}}_{{w}}}}}{{T}}}}\end{equation}
Here, R is the universal ideal gas constant; Mw is the molecular weight of the fluid, Pop is the operating pressure, T is the temperature.
▪ The coupled conservation equations describing flow and heat transfer are the nonlinear NAVIER–STOKES equations. Taking into account the simplifying hypotheses cited above, these equations (in the presence of a heat source) reduce to:
➢ In milk
Continuity equation
(2) \begin{equation}\frac{{\partial {\rho}}}{{\partial {\text{t }}}} + \frac{{\partial \left( {{\rho u}} \right)}}{{\partial {\text{x}}}} + \frac{{\partial \left( {{\rho v}} \right)}}{{\partial {\text{y}}}} = 0\end{equation}
Equations of momentum
(3)\begin{equation}\frac{{\partial (u)}}{{\partial t}} + \frac{{\partial \left( {\rho uu} \right)}}{{\partial x}} + \frac{{\partial \left( {\rho uv} \right)}}{{\partial y}} = - \frac{{\partial p}}{{\partial \rho x}} = \mu \left( {\frac{{{\partial ^2}u}}{{\partial {x^2}}} + \frac{{{\partial ^2}u}}{{\partial {y^2}}}} \right)\end{equation}(4)\begin{equation}\frac{{\partial \left( v \right)}}{{\partial t}} + \frac{{\partial \left( {\rho uv} \right)}}{{\partial x}} + \frac{{\partial \left( {\rho vv} \right)}}{{\partial y}} = - \frac{{\partial p}}{{\partial \rho y}} + \mu \left( {\frac{{{\partial ^2}v}}{{\partial {x^2}}} + \frac{{{\partial ^2}v}}{{\partial {y^2}}}} \right) + g\left( {\rho - {\rho _0}} \right)\end{equation}Energy equation
(5)\begin{equation}u\frac{{\partial {\textrm T}}}{{\partial x}} + v\frac{{\partial {\textrm T}}}{{\partial y}} = a\left( {\frac{{{\partial ^2}{\textrm T}}}{{\partial {x^2}}} + \frac{{{\partial ^2}{\textrm T}}}{{\partial {y^2}}}} \right)\end{equation}Where u and v are the fluid velocity components along the x and y directions, respectively, and P the pressure.


➢ Energy conservation equation in solids
Regarding heat transfer in solid media, such as steel walls and insulation, the governing equation is written as:
(6)\begin{equation}\left( {{\rho _i}{C_p}_i} \right)\frac{{\partial {T_i}}}{{\partial t}} = {\lambda _i}\left( {\frac{{{\partial ^2}{T_i}}}{{\partial {x^2}}} + \frac{{{\partial ^2}{T_i}}}{{\partial {y^2}}}} \right) + {S_T}\,i{\text{ }} = 1,{\text{ }}2,{\text{ }}3\end{equation}

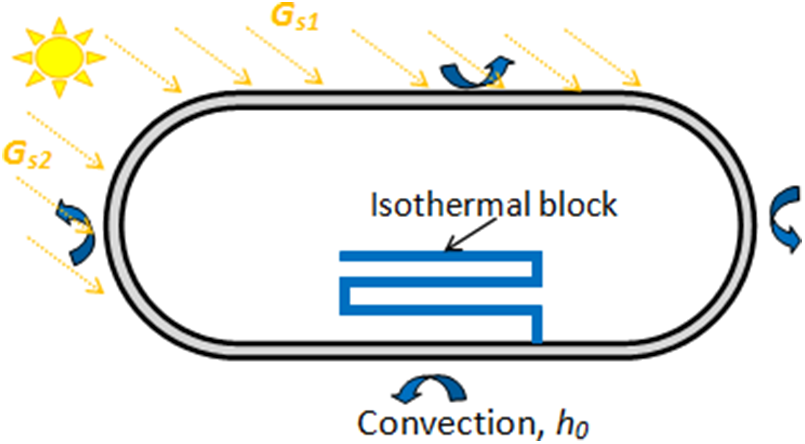
▪ The factor ST represents the source term. In order to take into account the solar radiations absorbed by the upper wall (Gs1) and left wall (Gs2) of the tank, a volumetric and uniform generation of heat, i.e. ST = Gs1 × α, was applied in the domain of the upper wall, and ST = GS2 × α in the domain of the left wall. The cold provided by evaporator is applied as a volumetric and uniform generation of cold (ST) at constant temperature (isothermal block). α is the coefficient of absorption of solar radiation.
Boundary and initial conditions
The tanker walls interact with ambient air through convection and radiation. The milk starts at 4°C, and the effect of solar radiation is analysed under static and dynamic transport conditions.
To solve the governing equations, initial condition must be defined:
▪ Milk in the tanker is initially stagnant and at a uniform temperature which is the same as the farm temperature (4°C).
▪ The tanker is supposed to move in one direction only (ox), so that the solar radiation is incident on the upper wall and left side wall only.
Setting up of flow-simulating computation involves specific boundary conditions. The different conditions applied in our study are illustrated in Fig. 2.
Presentation of the boundary conditions.

Walls of the tank: No slip conditions are used at inner side of the tank wall surface. At the exterior:
Upper wall: combined external convection and radiation boundary conditions are applied
 \begin{equation} - {{{k}}_{{p}}}\frac{{{{dT}}}}{{{{dy}}}} = {{{G}}_{{{S}}1}}{\alpha} + {{{h}}_0}{ }\left( {{{{T}}_{{p}}} - {{{T}}_{{a}}}} \right)\end{equation}
Left wall: combined external convection and radiation boundary conditions are applied
 \begin{equation} - {{{k}}_{{p}}}\frac{{{{dT}}}}{{{{dy}}}} = {{{G}}_{{{S}}2}}{\alpha} + {{{h}}_0}{ }\left( {{{{T}}_{{p}}} - {{{T}}_{{a}}}} \right)\end{equation}
Right and bottom walls: are exposed to convection. The heat flux exchanged by convection can be evaluated by
 \begin{equation} - {{{k}}_{{p}}}\frac{{{{dT}}}}{{{{dy}}}} = {{{h}}_0}{ }\left( {{{{T}}_{{p}}} - {{{T}}_{{a}}}} \right)\end{equation}
Tp is the temperature of the outer walls, Ta is the ambient temperature. h0 is the exchange coefficient by convection with the ambient air:
 \begin{equation}{{{h}}_0} = 2.8 + 3{V_v}\end{equation}
Vv is the wind speed which was taken as equal to 3.05 m/s which is the average wind speed in Tlemcen, during the month of August (Zenata, Reference Zenata2022).
A dynamic condition of adhesion to the wall (u = v = 0) is imposed on all the interior walls of the tank.
Climatic conditions
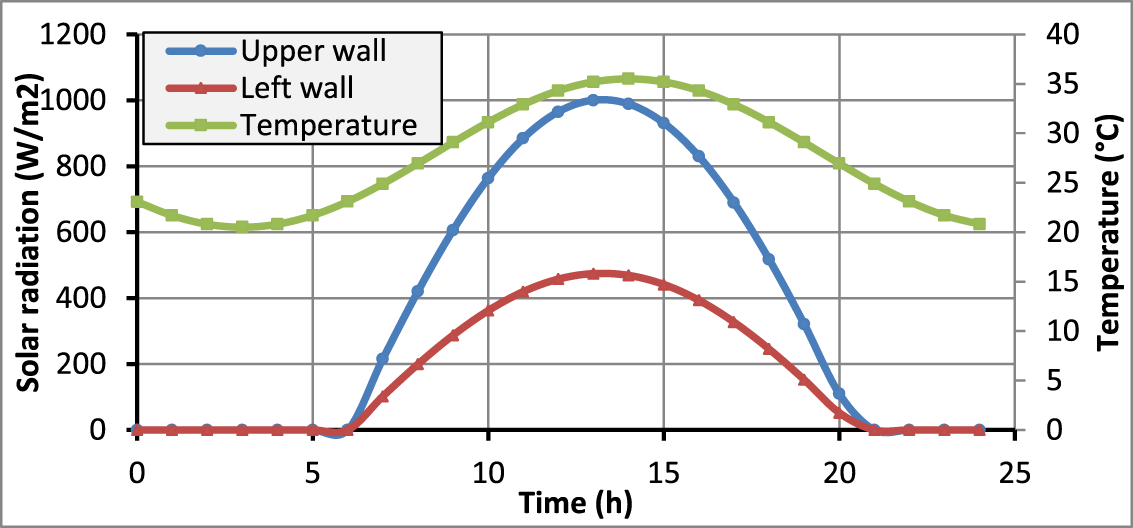
The performance of the tanker was evaluated under constant conditions, with solar radiation values of GS1 = 1000 W/m2 (maximum for horizontal boundary) and GS2 = 475 W/m2 (maximum for left perpendicular boundary) for the month of August. The ambient temperature was set at Ta = 35°C, representing the maximum temperature for the same day (Zenata, Reference Zenata2022), and the tanker speed was assumed to be Vt = 0 m/s. Following this, the system was tested under variable, real climatic conditions to assess the performance of the chosen evaporator in cooling the milk over the entire day. Hourly ambient temperature given by the climatic station of (Zenata, Reference Zenata2022) and solar intensity variation (CDER, 2022) used are presented in Fig. 3 and approximated by Eqs. (11, 12) and (13), respectively. The upper wall receives heat at a higher rate compared to the left wall.
Hourly evolution of temperature and solar radiation received by the upper and left walls.

 \begin{equation}{{{T}}_{{a}}}\left( {{t}} \right) = 28 + 7\cos \left[ {\frac{{\pi}}{{11}}\left( {{{t}} - 14} \right)} \right]\end{equation}
 \begin{equation}{{{G}}_{{{s}}1}} = 1068\sin \left[ {{\pi}\frac{{{{t}} - 6}}{{14.5}}} \right]{{ }}\end{equation}
 \begin{equation}{{{G}}_{{{s}}2}} = 475{ }\sin \left[ {{\pi}\frac{{{{t}} - 6}}{{14.5}}} \right]{{ }}\end{equation}
The tanker is exposed to solar radiation from 5 a.m. to 7 p.m. Subroutines written in C++ (UDF) were developed in order to integrate the unsteady evolution of the ambient temperature and solar radiation. Furthermore, in order to take into consideration the effect of the speed of the truck carrying the milk tanker on the evolution of the temperature, it was deemed necessary to modify the convection heat transfer coefficient. In this case, it is assumed that the vehicle speed was 70 km/h which is assumed equal to the wind speed (h0 = 61.12 W/m2K).
Results and discussions
The governing equations with the associated boundary and initial conditions are solved using Fluent software. The discretization of the equations is fully conservative and time implicit. The SIMPLE algorithm is used for pressure–velocity coupling. The convergence of solutions is checked at each time step and assumed when the maximum normalized residue for all cells is less than 10−6, for all equations.
Mesh independence test
Uniform mesh sizes were used for the numerical computation (Fig. 4(C)). A test analysis of the grid independence showed that the mesh grid of 37280 nodes is good enough for the studied geometry (Fig. 4(A)). Several values of time step have been examined for the chosen grid (Fig. 4(B)), and a value of 1 s is adopted with a maximum of iterations of around 500 for each time step.
Comparison of average milk temperature on the vertical surface, in the middle of the tank. (A) mesh independence test, (B) time step test, (C) mesh density of the chosen grid.

Validation of the numerical model
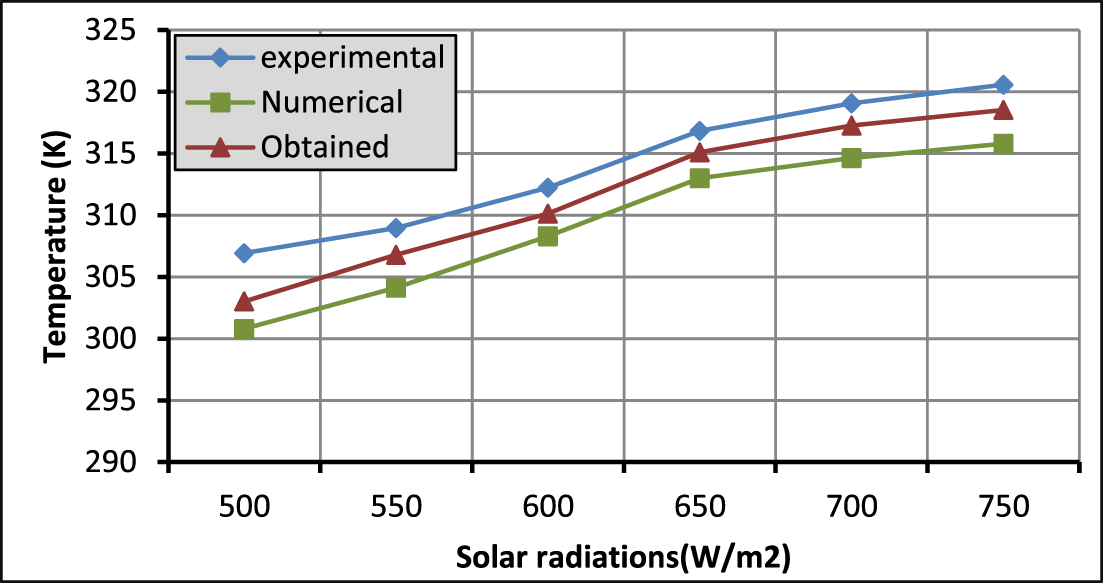
The current numerical results were compared with the experimental and numerical results previously published by Mathur and Mathur (Reference Mathur and Mathur2006). It is worth indicating that natural convection in a cubic cavity of volume 1 m3 coupled to a solar heated plate was considered in this study. In this study (Mathur and Mathur, Reference Mathur and Mathur2006), the authors have provided both experimental and numerical results. As seen in Fig. 5, the results obtained were found in fairly good agreement with those achieved by Mathur and Mathur (Reference Mathur and Mathur2006). The average relative error observed was 0.01%.
Comparison of average air temperature with experimental and numerical results (Mathur and Mathur, Reference Mathur and Mathur2006).

Effect of insulation
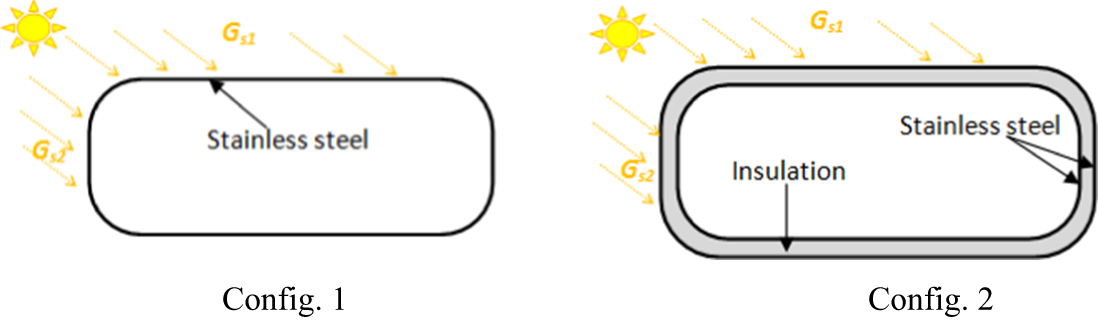
The effect of thermal insulation using polyurethane foam was simulated for the tank with two configurations (Fig. 6):
▪ Config. 1: Simple tank, composed of a tank with a single layer of stainless steel.
▪ Config. 2: Insulated tank, comprising an inner and outer layer of stainless steel. The gap between the two layers is filled with polyurethane foam.
▪ The truck is supposed to be stationary.
Configurations of the tank.

Time taken by milk to reach 10°C for both configurations
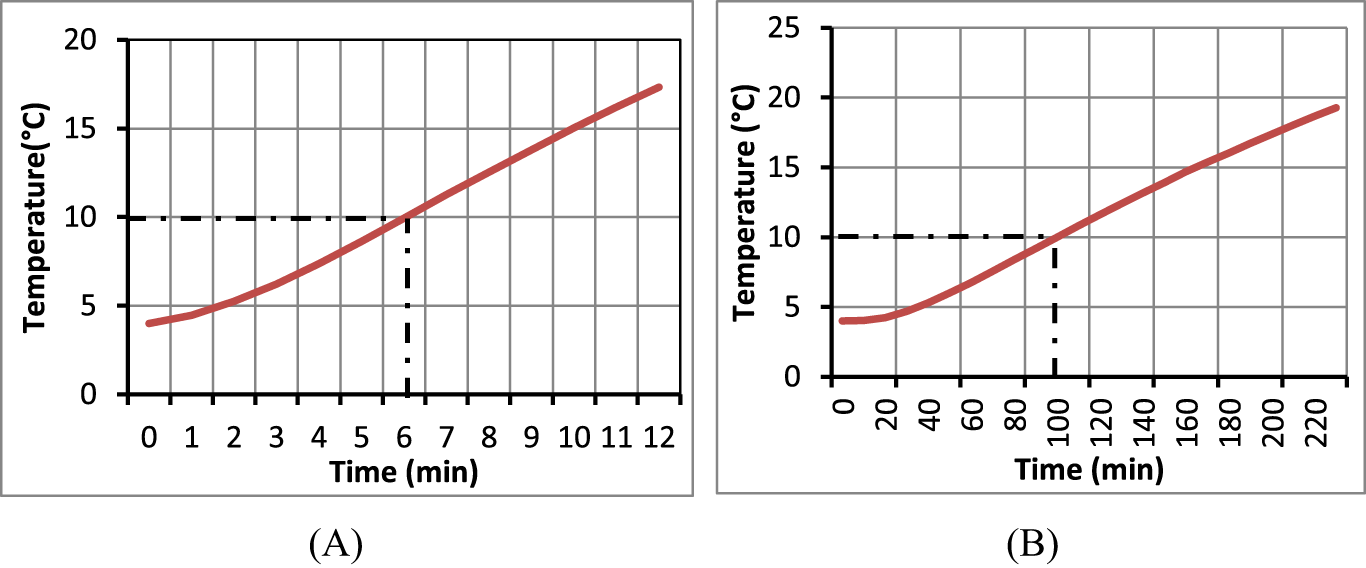
▪ Figure 7 depicts the variation of the average milk temperature as a function of time for both configurations 1 and 2, respectively. A gradual increase in temperature was observed over time for both configurations, which was most likely due to the absorption of thermal energy from solar radiation and ambient air.
▪ Insulation extends milk freshness from 6 min (uninsulated) to 96 min. Without insulation, heat transfer leads to rapid temperature rise. Insulation significantly delays heat penetration, though it remains insufficient for long-distance transport.
Evolution of the average milk temperature as a function of time for config. 1 (A) and config. 2 (B).

Dynamic and thermal behaviour of milk for both configurations
A comparative analysis of the inner flow patterns between configurations 1 and 2, focusing on streamlines, velocity fields and thermal distributions at various time points is presented in Fig. 8. The moment at which the milk reaches 10°C is pivotal (exceeding 10°C during raw milk transportation leads to its degradation (DILAEJO, Reference DILAEJO2012)); thus, we showcase the results at this specific juncture for all configurations. Additionally, a standard time point (t = 10 min) has been selected across all configurations to facilitate a comprehensive comparison. The following insights emerge from our analysis:
Contours of: (A) temperatures, and (B) velocities with streamlines within the tank at t = 6 m in and 10 min for config. 1 and at 10 min and 96 min for config. 2, respectively.

The solar irradiation absorbed by the walls is transferred to the milk by convection. For both configurations, at all time points (6 min, 10 min, and 96 min), the highest temperature within the tank is near the upper wall due to the higher solar radiation absorbed by this surface. In config. 1, two distinct thermal behaviours were observed. Thermal stratification occurred in the upper part of the tank, where warmer milk accumulated near the surface, while colder milk remained deeper and convection rolls in the lower region, where warmer milk rose and cooler milk sank. At t = 6 min and t = 10 min, the milk reached average temperatures of 10°C and 15.03°C, respectively. The highest fluid velocities were found in the lower half of the tank, driven by natural convection. Some stagnation occurred, likely due to thermal stratification in that zone, with an average speed of 0.013 m/s at 10 min.
In config. 2, the use of thermal insulation reduced heat transfers, which significantly affected the thermal and dynamic behaviours of the milk. The convection rolls near the bottom wall were absent, as the milk was insufficiently heated from the bottom. Two convection cells formed near the left and right walls, extending horizontally over time, with the left side dominating due to greater heat absorption. Velocities inside the tank were lower in config. 2, with maximum speeds observed near the left wall and average speeds of 8.12 × 10⁻⁴ m/s at 10 min and 1.43 × 10⁻³ m/s at 1 h 36 min.
Milk stratification continued to dominate the thermal behaviour in this configuration, with the average temperature increasing to 4.03°C at 10 min and 10°C at 1 h 36 min. The insulation has improved the cooling time by 176%. However, this enhancement remains insufficient for transporting milk over extended distances and durations. To further extend the cooling time, integrating an evaporator into the tank is considered a more effective solution.
Effect of evaporator placement
This part of the study investigates the effect of immersing an evaporator coil within the milk tanker to maintain the milk temperature below 10°C. Two different positions were tested: the upper part of the tank (config. 3) and the bottom (config. 4). Made from food-grade 304 stainless steel, the evaporator has a length of 3.98 m, a thickness of 0.02 m, and operates at a fixed temperature of 2°C.
Time taken by milk to reach 10°C for configs. 3 and 4
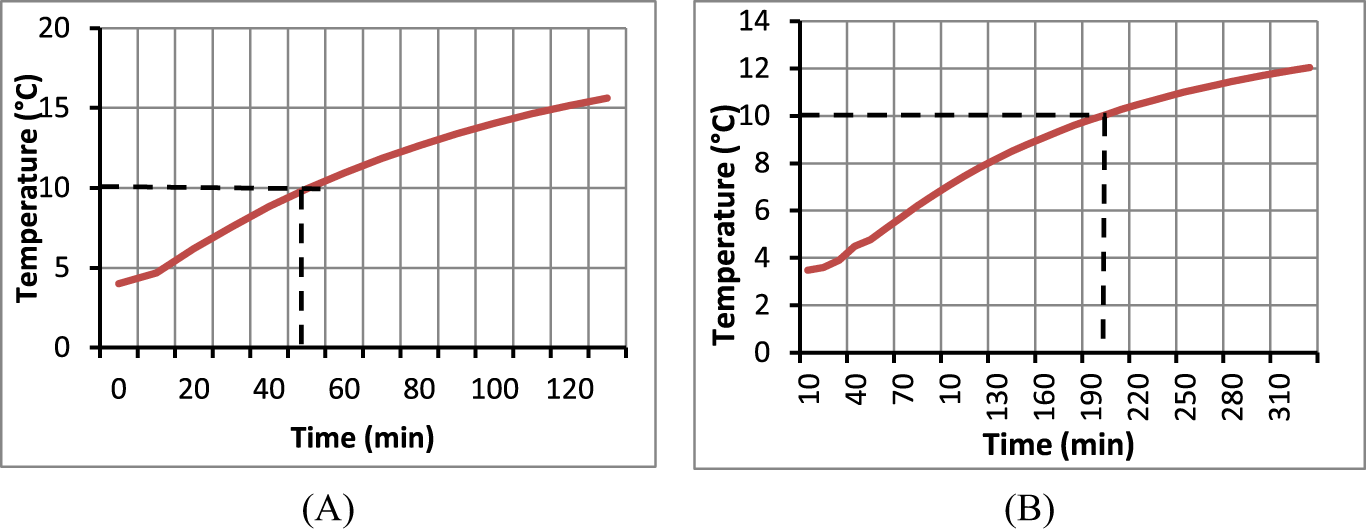
Figure 9 shows the variation of the average milk temperature over time for both configs. 3 and 4. When positioned at the top, the evaporator reduces the cooling time, keeping the milk temperature down to 10°C for just 50 min. In contrast, placing the evaporator at the bottom significantly prolongs the cooling time, taking 3 h and 19 min to reach the same temperature. This results in a 69% increase in cooling time for config. 3 and a 119% increase for to config. 4 comparing to config. 2. Thus, the evaporator’s placement plays a crucial role in cooling efficiency, with the bottom position proving more effective for maintaining the milk temperature below 10°C for a longer duration.
Evolution of the average milk temperature as a function of time in the presence of an evaporator: (A) config. 3, (B) config. 4.

Dynamic and thermal behaviour of milk for configs 3 and 4
Figure 10 shows the temperature contours (A) and velocity streamlines (B) inside the tank at t = 10 min and t = 50 min for config. 3, and at t = 10 min and t = 199 min for config. 4. Where the evaporator is positioned at the top, the milk in direct contact with the evaporator cools first, forming a cold layer adjacent to the evaporator surface. As this fluid cools, its density increases, causing the colder, denser fluid to sink to the bottom while the warmer milk rises. This process generates convection cells, which help to eliminate thermal stratification and significantly enhance heat transfer between the milk and the tank walls through increasing milk velocity.
Contours of: (A) temperatures, and (B) velocities with streamlines within the tank at 10 and 50 min for config. 3 and 10 min and 199 min for config. 4.

The average temperature and flow velocity were 4.68°C and 1.33 × 10⁻² m/s at t = 10 min, and 10°C and 1.94 × 10⁻² m/s at t = 50 min. The placement of the evaporator at the top resulted in a substantial increase in milk flow velocity compared to config. 2.
For config. 4, at t = 10 and 199 min, thermal stratification occurs in the upper part of the tank. In the lower section, two convection cells develop near the edges of the evaporator due to the temperature gradient between the evaporator and the tank bottom, leading to convection rolls. The highest velocities are observed in the recirculation zones, while the lowest are in the upper region. After 3 h and 19 min, the milk’s average temperature reaches 10°C, with an average velocity of 4.9 × 10⁻³ m/s.
Effect of evaporator length and temperature
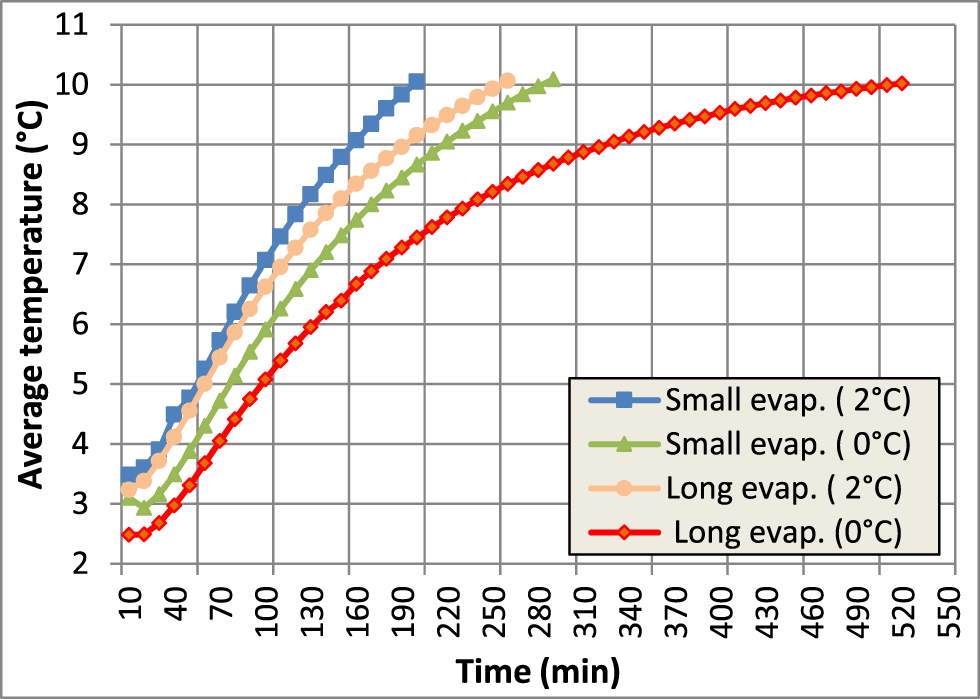
The effect of varying the evaporator length from 3.98 m to 6.35 m, while keeping its temperature constant at 2°C, is presented in Fig. 11. Additionally, the temperature variation from 2°C to 0°C is tested and shown in the same figure. Increasing the evaporator’s length from 3.98 m to 6.35 m was found to extend the cooling time by approximately 60 min. Additionally, the evaporator’s temperature significantly affects the cooling process. A lower evaporator temperature results in colder milk, but it should not fall below 0°C to prevent compromising milk quality, as milk freezes at around −0.55°C (Shipe et al., Reference Shipe, Dahlberg and Herrington1953). Lowering the evaporator temperature from 2°C to 0°C increases the convective heat transfer, resulting in a longer cooling time of 4 h and 50 min, as shown in the same figure.
Effect of the evaporator’s length and temperature on the evolution of the average milk temperature.

Furthermore, a significant improvement in cooling time was observed with a 6.35 m evaporator at 0°C, allowing for a longer milk transport duration. Specifically, the evaporator can maintain the milk at a sufficiently low temperature for approximately 8 h and 40 min, as shown in Table 3. The 6.35 m evaporator at 0°C is the optimal choice for extended milk transport times.
Milk cooling time for different cases

Performance of evaporator under real conditions
In order to check the ability of the selected evaporator (L = 6.35 m and T = 0°C) to maintain the milk at a temperature lower than 10°C, the climatic conditions data of Tlemcen, Algeria, for a typical day of August were considered. The vehicle in this case is assumed in movement; it is assumed that the vehicle speed was 70 km/h.
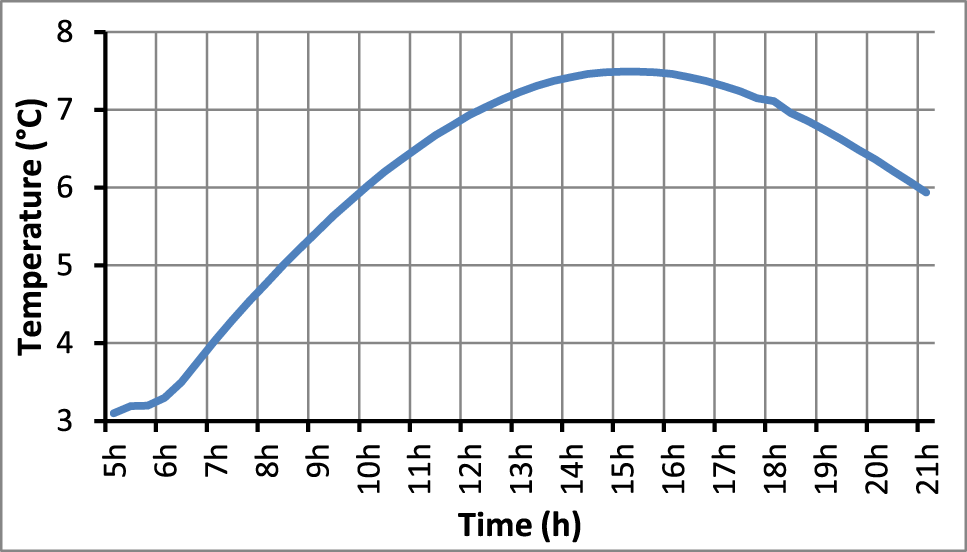
Figure 12 shows the hourly evolution of the average milk temperature for the typical day of August. As expected, the temperature rose with solar radiation until the afternoon, then declined. The maximum recorded temperature was 7.46°C, confirming the evaporator’s effectiveness in keeping the milk below 10°C throughout the day.
Evolution of the average milk temperature for a typical day of August.

Conclusion
This study was primarily aimed to analyse the heat transfer and flow in a milk tank with immersed evaporator as a novel approach using CFD method. Unsteady laminar flow and heat transfer through a 2D model is carried out for a typical day of August for the weather conditions of Tlemcen (Algeria). Taking into consideration the results of all analyses, the following remarks may be concluded:
• Using thermal insulation (config. 2) can limit the heat transfer from the outside to the inside; the time of cooling in this case can reach 1 h 36 min.
• Integrating the evaporator at the top of the tank (config. 3) led to a significant acceleration in milk warming compared to config. 2. This unexpected result was primarily due to increased flow velocity and the elimination of thermal stratification within the tank.
• The immersion of the evaporator at the bottom (config. 4) resulted in extending the cooling time up to (3 h 19 min) 69% comparing to config. 2 and 119% comparing to config. 3. The results demonstrated the importance of evaporator placement in influencing the efficiency of milk cooling processes.
• Increasing the length of evaporator causes the increase of the cooling time to about 91% (4 h 19 min). In addition, decreasing the evaporator temperature leads to increase of the cooling time to about 100% (4 h 50 min).
• Consideration of the optimal values of the two parameters, i.e. length and temperature simultaneously, can extend the period of cooling up to 137% (8 h 40 min).
• Finally, the findings showed that the long evaporator at 0°C can keep the temperature of milk below 10°C for the entire day, under real climatic conditions.
• Future studies should consider additional factors such as coil type, coil diameter and fin addition to the refrigerated container. The inclusion of an agitator inside the tank is also crucial for enhancing the cooling system efficiency.
Acknowledgements
I extend my gratitude to Hachemaoui Ahmed, Habbeddine Soufiane Omar and Mohammed Khaldi for their assistance during the simulation phase. Their expertise and dedication significantly contributed to the successful completion of this study.