Cardiac magnetic resonance has been used for many years in the evaluation of congenital heart disease.Reference Fletcher, Jacobsteink, Nelson, Riemenschneider and Alfidi 1 It is a “one-stop shop” for cardiovascular anatomy,Reference Fogel, Hubbard and Weinberg 2 physiology,Reference Fogel, Weinberg and Rychik 3 function,Reference Fogel, Weinberg and Gupta 4 and tissue characterisation, making it extremely appealing to the health-care provider involved in caring for children and adults with cardiac disease. As an example of its utility, it is the “gold standard” in a number of areas including great vessel anatomy,Reference Fleenor, Weinberg, Kramer and Fogel 5 ventricular volumes,Reference Bu, Munns and Zhang 6 and blood flow; in addition, it has routine internal checks, making it highly accurate, for example branch pulmonary artery flow should be nearly equal to the main pulmonary artery flow, and is used non-invasively to determine myocardial scarring and identify patch material. Further, cardiac magnetic resonance builds images over many heartbeats, “averaging” in ventricular function and blood flow into the image; by contrast, echocardiography and cardiac angiography demonstrate instantaneous images and the imager must “average” these beats in their head – or measure many beats – to get a true sense of ventricular function or blood flow.
Conotruncal abnormalities such as transposition of the great arteries and common arterial trunk are examples of lesions, which have major great vessel abnormalities. In addition, because both lesions undergo surgical repair with deep hypothermic circulatory arrest, ventricular function and myocardial scarring are important considerations to evaluate. Semilunar valve and conduit regurgitation will cause ventricular volume overload, which may affect outcome. All these considerations are comprehensively evaluated by cardiac magnetic resonance. Although echocardiography is generally the initial diagnostic technique employed, there is a place for cardiac magnetic resonance in the pre-operative phase, providing complementary diagnostic information. Post-operatively, cardiac magnetic resonance has been incorporated into patient care both as an individual examination and serially.
Details of the anatomy in these two lesions are found elsewhere in this series of articles and will not be repeated; this article will focus on the application of cardiac magnetic resonance to these diseases. In addition, a detailed treatise on cardiac magnetic resonance is beyond the scope of this article; the reader is referred to relevant texts on this subject. 7
Common arterial trunk
Although other imaging modalities are utilised in the initial evaluation of common arterial trunk, cardiac magnetic resonance can provide additional and complementary diagnostic informationReference Frank, Dillman and Parish 8 in complex cases or in delayed diagnosis.Reference Menon, Julsrud and Cetta 9 Chrispin et alReference Chrispin, Small and Rutter 10 , Reference Chrispin, Small and Rutter 11 pioneered cardiac magnetic resonance of this lesion in the 1980s, obtaining diagnostic images using an echo-planar imaging technique with 3-millimetre in-plane resolution and 35-millisecond temporal resolution. Since then, a number of manuscripts have surfaced, utilising cardiac magnetic resonance in this disease.Reference Dorfman and Geva 12 – Reference Engle, Lang and Edelson 15 This modality has advanced because of the development of new pulse sequences, parallel imaging techniques, multi-channel coil designs, and possibly also blood pool contrast media. With this, a complete anatomical and physiologic description can be obtained by nearly all clinical imagers.
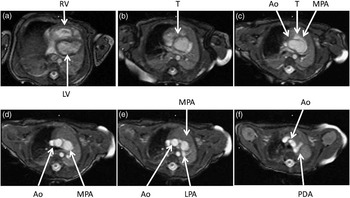
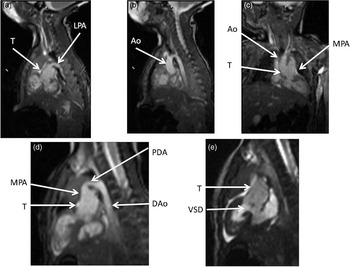
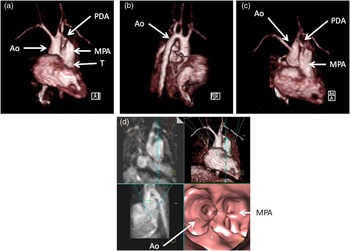
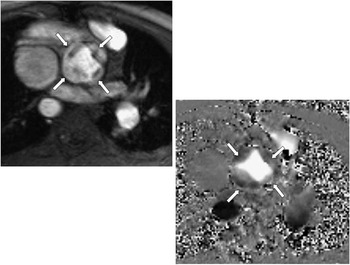
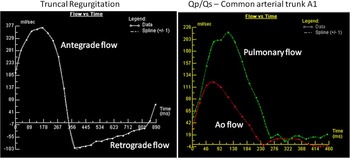
Pre-operatively, in the native state, the goal of cardiac magnetic resonance is to define the type of common arterial trunk, including origin of pulmonary trunk, branches, and collaterals; functional abnormalities of the truncal valve, including regurgitation, stenosis, morphology of the valve, and number of cusps; alignment of the truncal valve with respect to the ventricular septum and ventricular septal defect; and assessment of the aorta and brachiocephalic vessels, pulmonary veins, associated cardiac anomalies, and mediastinal structures – hypoplasia or absence of thymus. This can be performed with the standard cardiac magnetic resonance protocol, including static steady-state free precession, cine imaging, velocity mapping, and gadolinium imaging. Figures 1–3 are examples of cardiac magnetic resonance images pre-operatively. Static steady-state free precession, cine imaging, and gadolinium imaging can visualise the common arterial trunk and the branching pattern of the pulmonary arteries from this vessel. Determining aortic arch interruption or hypoplasia along with the presence of the ductal artery – if present – is easily seen. With this, the heart being imaged can be totally defined in the two major classification schemes in use – that of Collett and Edwards, and Van Praagh. Truncal valve anatomy – whether trileaflet, bicuspid, or quadricuspid (Fig 4) – insufficiency, and stenosis should be assessed with cine and phase-encoded velocity mapping, which can quantify the regurgitant fraction (Fig 5). The relative flow to the pulmonary and systemic circulation (Qp/Qs; Fig 5) may be assessed by placing velocity maps across each pulmonary artery and in the aortic arch distal to the take-off of the main or branch pulmonary arteries; Qp/Qs as measured by cardiac magnetic resonance has been validated in the past.Reference Beerbaum, Korperich and Barth 16 Velocity mapping at the level of the truncal valve not only quantifies truncal insufficiency (Fig 5), but is also used as an internal check on the data – sum of the net flows in the branch pulmonary arteries and the aorta distal to the take-off of the main and branch pulmonary arteries must equal the net flow across the truncal valve – as well as visualising the number of leaflets. Cine is used to quantify ventricular performance and to assess for any additional ventricular septal defects. T2 prepared steady-state free precession coronary imaging utilising the navigator technique or contrast-enhanced methods – slow-drip gadolinium coronary imaging or imaging agents, which remain in the blood pool – can be used to identify any coronary artery abnormalities.
Two-dimensional steady-state free precession imaging in the axial plane of a native common arterial trunk. These images are selected from a stack of contiguous axial slices from a patient with common arterial trunk A4. The images progress from inferior to superior as the panels progress from left to right and from top to bottom – upper left is most inferior and lower right is the most superior. In ( a ), the right (RV) and left ventricles (LV) are clearly seen; further superior in ( b ), the common arterial trunk (T) is visualised. Even more superiorly in ( c ), T is visualised to bifurcate into the aorta (Ao) and main pulmonary artery (MPA). In ( d ), the Ao and MPA are separated, while more superiorly in ( e ) the left pulmonary artery (LPA) is visualised. In the most superior image ( f ), the patent ductus arteriosus (PDA) is seen.

Two-dimensional steady-state free precession imaging in coronal and sagittal planes of a native common arterial trunk. Images are from the same patient in Figure 1. ( a ) and ( b ) are sagittal views, with ( a ) demonstrating the main pulmonary artery (MPA) originating from the common arterial trunk (T) and giving rise to the left pulmonary artery (LPA) and ( b ) is a few milometers to the right, demonstrating the aortic (Ao) arch. ( c ) is a coronal image demonstrating T bifurcating into the Ao and MPA, while ( d ) is an off-axis sagittal view demonstrating the patent ductal artery (PDA) connecting the MPA to the descending aorta (DAo). In ( e ), the ventricular septal defect (VSD) is seen with the T overriding the VSD.

Three-dimensional gadolinium imaging of a native common arterial trunk. The upper panels are anterior ( a ), lateral ( b ), and superior views ( c ) of a three-dimensional volume-rendered image from the same patient in Figure 1. The common arterial trunk (T) bifurcating into the main pulmonary artery (MPA) and aorta (Ao) along with the patent ductal artery (PDA) is seen. The lower panel ( d ) is a series of four images, with the upper left being a thin multi-formatted reconstruction in the coronal view, the lower left being a maximum intensity projection in the lateral view, the upper right being a three-dimensional volume-rendered image viewed anteriorly, and the lower right being an “endoscopic view” inside the common arterial trunk, looking up into T to visualise the Ao and MPA.

Quadricuspid truncal valve. Utilising phase-encoded velocity mapping, this quadricuspid truncal valve was imaged in a common arterial trunk A1. The upper left image is the anatomic or “magnitude” image in mid-systole, while the lower right image is the companion velocity or “phase” image where moving blood into the plane of the image is signal intense (white), outlining the valve leaflets. Arrows point to the four separate leaflets.

Graphs of velocity maps in common arterial trunk. As through plane phase-encoded velocity-mapping measures flow (and not simply velocity), the graphs in this figure are flow (in millilitres/second on the y-axis) versus time (in milliseconds on the x-axis) diagrams derived from cardiac magnetic resonance images. The diagram on the left is flow across the truncal valve demonstrating truncal insufficiency; the curve above the x-axis is antegrade flow and the one below is the retrograde flow. Regurgitant fraction is simply the area above the curve below the x-axis divided by the area below the curve above the x-axis, all multiplied by 100. The diagram on the right superimposes velocity maps of the aorta (Ao) and the main pulmonary artery on the same graph in a common arterial trunk A1; Qp/Qs was measured by assessing flow using velocity mapping in the Ao distal to the origin of the main pulmonary artery (red lower curve) and using velocity map in the main pulmonary artery segment (pulmonary flow).

After surgical repair of common arterial trunk from the neonate through adulthood, cardiac magnetic resonance plays a key role in patient care. On the right side of the circulation, as noted elsewhere in this series of articles, a right ventricle to pulmonary artery conduit is constructed, which, in many instances, does not contain a valve and is regurgitant, causing a volume load on the right ventricle. In addition, this conduit can become stenotic, especially as the patient grows. Visualisation by echocardiography may be difficult, as the conduit is just beneath the sternum. Finally, the branch pulmonary arteries can become stenotic as well, noting that they must be removed from the common arterial trunk individually at times, for example Van Praagh classification A II. Cardiac magnetic resonance easily visualises all these structures with static steady-state free precession, cine imaging, and three-dimensional gadolinium imaging (Figs 6 and 7). Cine imaging in particular can quantify right ventricular volumes, ejection fraction, and right ventricular hypertrophy, all key metrics when evaluating the effects of a regurgitant and/or stenotic conduit. Cine imaging can also visualise the turbulence across the conduit or branch pulmonary arteries, whereas phase-encoded velocity mapping can quantify the regurgitant fraction of the conduit, the distribution of flow to each branch pulmonary artery – especially important with branch pulmonary artery stenosis – and measure peak velocity across the narrowing, estimating the pressure gradient across the obstruction using the simplified Bernoulli equation. Even pseudoaneurysms of the right ventricular outflow tract after truncal repair has been noted by cardiac magnetic resonance.Reference Murashita, Hatta, Imamura and Yasuda 17 Delayed enhancement imaging, also called “viability” imaging, can be utilised to identify patch material of the ventricular septal defect or the right ventricle to pulmonary artery conduit;Reference Harris, Johnson, Weinberg and Fogel 18 this may explain paradoxical or akinetic regions of the right ventricle. The finding of patch material demonstrating delayed enhancement was attributed to fibrous tissue that may be relevant in the development of conduit stenosis.
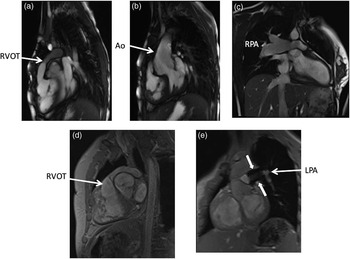
Various two-dimensional images in common arterial trunk after repair. The upper panels are steady-state free precession images and the bottom panels are gradient echo images of a common arterial trunk after repair in various patients. The sagittal view in ( a ) demonstrates the right ventricular outflow tract (RVOT), which is narrowed, while in ( b ) the aorta (Ao) is seen in an off-axis sagittal view. In ( c ), a dilated right pulmonary artery (RPA) is seen, while in ( d ) the RVOT is again visualised with a different type of imaging. In ( e ), the left pulmonary artery (LPA) is seen with a stent in place (arrows).

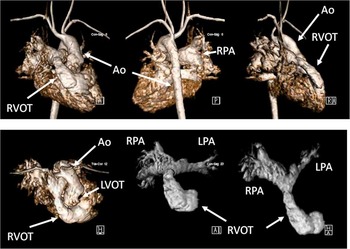
Three-dimensional gadolinium imaging in a common arterial trunk after repair. This shows the patient 7 years after repair of common arterial trunk, with narrowing of the right ventricle to pulmonary artery conduit. The upper panels are anterior (left), posterior (middle), and lateral (right) volume-rendered gadolinium images of both the right and left sides of the circulation. Note how the right ventricular outflow tract (RVOT) appears narrowed. The left lower panel is a volume-rendered image looking down on the heart, with right and left sides of the circulation also shown. The lower middle and right panels are volume-rendered gadolinium images, with the left side of the circulation removed to focus on the RVOT and the branch pulmonary arteries. The lower middle image is an anterior view, and the lower right is a transverse view where the bifurcation of the right ventricle to pulmonary artery conduit and the right (RPA) and left pulmonary arteries (LPA) can clearly be seen. Ao = aorta; LVOT = left ventricular outflow tract.

On the left side of the circulation, residual ventricular septal defects can be found after repair. The truncal valve, now the neoaortic valve, can become either regurgitant or stenotic. Finally, in cases of aortic arch interruption or hypoplasia, residual aortic arch obstruction may be present along with potential aneurysm formation. Cardiac magnetic resonance, utilising cine imaging, can easily identify residual ventricular septal defects, and utilising velocity mapping can quantify the shunt by measuring flow across the neoaortic valve and the right ventricle to pulmonary artery conduit. Similar to the evaluation of the right ventricle to pulmonary artery conduit, cine cardiac magnetic resonance can quantify left ventricular volumes, ejection fraction, and left ventricular hypertrophy, all key metrics when evaluating the effects of a regurgitant and/or stenotic neoaortic valve, as well as a residual coarctation of the aorta. Utilising velocity mapping, the neoaortic regurgitant fraction and cardiac index can be measured; peak velocities across the neoaortic valve and residual coarctation to measure pressure gradients, if present, are also useful. Viability imaging can be utilised to identify myocardial scarring of the left ventricle. In case of repair of aortic arch hypoplasia or interruption, fast spin echo black-blood inversion recovery imaging enables the visualisation of mediastinal and in particular the bronchovascular structures.
Transposition of the great arteries
Echocardiography is most frequently utilised for the initial diagnosis of transposition of the aorta and pulmonary artery, but cardiac magnetic resonance imaging may provide an additional benefit to the pre-operative planning. Similar to the means by which it is useful in pre-operative imaging for common arterial trunk, cardiac magnetic resonance imaging can provide detailed imaging of the vasculature, mediastinal structures, ventricular performance, and blood flow to the pulmonary and systemic circulation. Cardiac magnetic resonance can also aid in the delineation of the coronary anatomy, given that coronary anomalies are frequently present in patients with transposition.Reference Wernovsky 19
Cardiac magnetic resonance is most useful in monitoring patients following surgical repair of transposition of the great arteries. There are three different types of procedures that have been used for correction of blood flow in transposition of the great arteries. These procedures include atrial switch procedures, arterial switch procedures, and ventricular level correction, such as the Rastelli procedure used for transposition with left ventricular outflow tract obstruction and a ventricular septal defect. Each of these surgeries has different complications that are well identified by cardiac magnetic resonance imaging.Reference Cohen, Johnson and Ramrakhiani 20 , Reference Soler, Rodriguez, Alvarez and Raposo 21
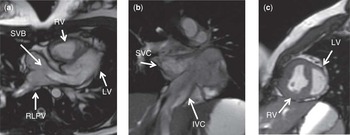
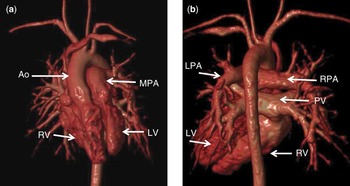
The earliest surgical procedures performed for transposition were atrial switch procedures – Senning or Mustard procedures. These operations redirect the systemic and pulmonary venous blood at the atrial level. Following each procedure, the systemic venous blood reaches the mitral valve, left ventricle, and then pulmonary arteries. The pulmonary venous blood reaches the tricuspid valve, right ventricle, and the aorta (Figs 8 and 9). Complications of these procedures include baffle leak or obstruction, pulmonary or systemic venous obstruction, tricuspid annular dilatation and regurgitation, right ventricular hypertrophy, enlargement, and right ventricular failure. Cardiac magnetic resonance, utilising cine imaging, can provide dynamic imaging of the venous pathways within the atria to visualise obstruction or leakage.Reference Fogel, Hubbard and Weinberg 22 Cine cardiac magnetic resonance can identify valve regurgitation and/or stenosis and quantify left and right ventricular volumes, ejection fraction, and ventricular hypertrophy.Reference Lorenz, Walker, Graham and Powers 23 Phase-encoded velocity mapping can quantify valve regurgitant fraction and distribution of flow to each branch pulmonary artery. In addition, any residual shunt can be calculated by measuring flow across the aortic valve and the pulmonary valve. Late gadolinium enhancement viability imaging may be utilised to identify myocardial fibrosis.Reference Prakash, Powell, Krishnmurthy and Geva 24 Dobutamine imaging or exercise testing within the magnet can assess the response of the systemic right ventricle to stress.Reference Tulevski, van der Wall and Groenink 25 , Reference Roest, Lamb and van der Wall 26
Two-dimensional steady-state free precession images of transposition of the great arteries after atrial switch repair. ( a ) is an axial view demonstrating the systemic venous baffle (SVB) and the relation to the right lower pulmonary vein (RLPV) as it directs flow across the mitral valve into the left ventricle. ( b ) is a coronal view demonstrating the systemic venous baffle as it connects the inferior caval vein (IVC) and the superior caval vein (SVC). ( c ) is a sagittal view demonstrating the thin walled left ventricle (LV) and the hypertrophied right ventricle (RV).

Three-dimensional gadolinium imaging in transposition of the great arteries after atrial switch repair. The panels are anterior ( a ), and posterior views ( b ) of a three-dimensional volume-rendered image from the same patient in Figure 8 who has previously had an atrial switch procedure. The Aorta (Ao) arises from the right ventricle (RV) and the main pulmonary artery (MPA) arises from the left ventricle (LV). The pulmonary venous baffle (PV) connects to the right ventricle.

The corrective surgery of choice today for transposition of the great arteries is an arterial switch procedure. Dr Jatene first described this procedure in 1975, and it became widely accepted in the 1980s and 1990s.Reference Jatene, Fontes and Paulista 27 Common post-operative complications of this procedure include peripheral pulmonary artery stenosis, neoaortic root dilatation, neoaortic valve regurgitation, left ventricular enlargement, and ischaemic complications from the translocation of the coronary arteries at the time of surgery or development of coronary artery stenosis.Reference Bonhoeffer, Bonnet and Piechaud 28 The pulmonary arteries are very difficult to visualise by echocardiography following the LeCompte manoeuvre – transfer of the pulmonary arteries anterior to the neoaortic root. In addition, the neoaortic root may have an oblique orientation following the arterial switch operation, making accurate measurements by standard echocardiography planes challenging. Cardiac magnetic resonance easily visualises these structures with static steady-state free precession, cine imaging, fast spin echo black-blood inversion recovery imaging, and three-dimensional gadolinium imaging. Accurate and reproducible measurements can be obtained and followed serially (Figs 10 and 11).Reference Hardy, Helton, Kondo, Higgins, Young and Higgins 29
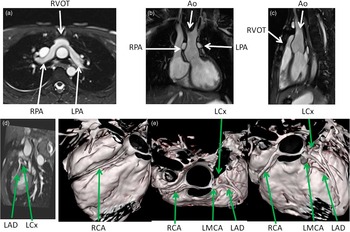
Various two-dimensional and three-dimensional steady-state free precession images of transposition of the great arteries after arterial switch repair. The upper panels are axial ( a ), coronal ( b ), and sagittal views ( c ), demonstrating the anteriorly positioned right ventricular outflow tract (RVOT) and the position of the right pulmonary artery (RPA) and the left pulmonary artery (LPA) in relation to the aorta (Ao) after the LeCompte manoeuvre of the arterial switch procedure. The lower panels are a two-dimensional image ( d ) and three three-dimensional images ( e ) of coronaries from T2 prepped steady-state free precession (SSFP) images. RCA = right coronary artery; LMCA = left main coronary artery; LCx = left circumflex artery; LAD = left anterior descending artery.

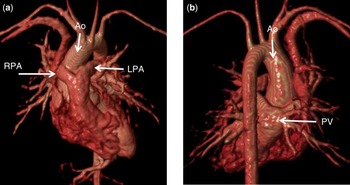
Three-dimensional gadolinium imaging in transposition of the great arteries after arterial switch repair. The panels are anterior ( a ), and posterior views ( b ) of a three-dimensional volume-rendered image from a patient who has previously had an arterial switch procedure. The Aorta (Ao) arises from the left ventricle (LV) and the main pulmonary artery arises from the right ventricle (RV). The right pulmonary artery (RPA) and the left pulmonary artery (LPA) straddle the aorta. The pulmonary veins (PV) connect to the left atrium, which connects to the left ventricle.

Cardiac magnetic resonance, utilising cine imaging, can visualise the turbulence across the branch pulmonary arteries, identify residual ventricular septal defects, valve regurgitation, and/or stenosis. Cine cardiac magnetic resonance can quantify left and right ventricular volumes, ejection fraction, and ventricular hypertrophy. Phase-encoded velocity mapping can quantify the distribution of flow to each branch pulmonary artery and measure peak velocity across any narrowing. Velocity mapping can quantify the neoaortic regurgitant fraction and cardiac index. In addition, any residual shunt can be calculated by measuring flow across the neoaortic valve and the pulmonary valve. Coronary imaging can be used to identify any coronary artery abnormalities following transfer of the coronaries from the native aortic root to the neoartic root. Late gadolinium enhancement viability imaging and/or pharmacologic stress testing with dobutamine or adenosine may be utilised to identify myocardial scarring of the ventricles.Reference Taylor, Dymarkowski and Hamaekes 30 , Reference Dorfman and Geva 31