I. INTRODUCTION
In recent years, the production of more active and selective hydrodesulfurization catalysts able to remove the most refractory sulfur-containing molecules such as 4,6-dimethyldibenzothiophene has received attention due to the need to process heavier petroleum feeds, the declining trend of light oil supplies,1 and the stringent environmental regulations requiring sulfur contents close to zero sulfur ppm in the transport fuels.
For the hydrodesulfurization of petroleum fractions, Mo or W sulfides promoted by Co or Ni supported on γ-alumina are the most extensively used catalysts.Reference Song2–Reference Ren, Li, Feng, Wang, Zhang, Wen, Zhang and Shen6 Models for these catalysts have been proposed by Daage and Chianelli,Reference Daage and Chianelli7 and Topsøe et al.Reference Topsoe8 For these catalysts, complete sulfidation of the molybdenum phase leads to the so-called type II Co(Ni)–Mo–S structures that are more active than the partially sulfided type I, which strongly interact with the catalyst support via Mo–O bridges.Reference Hinnemann, Nørskov and Topsøe9,Reference Topsøe10 Type II well sulfided structures favor the presence of metallic states near the top basal plane of the MoS2 crystallites, which can have hydrogenating properties.Reference Hinnemann, Nørskov and Topsøe9,Reference Besenbacher, Brorson, Clausen, Helveg, Hinnemann, Kibsgaard, Lauritsen, Moses, Nørskov and Topsøe11 Ramos et al.Reference Ramos, Berhault, Ferrer, Torres and Chianelli12 have also shown for unsupported systems the existence of strong electron donation from Co to Mo and an enhanced metallic character associated with the Co9S8/MoS2 interface. Berhault et al.Reference Berhault, Perez De la Rosa, Mehta, Yácaman and Chianelli13 studied the structural role of cobalt and the influence of support interactions on the morphology and catalytic properties of Mo and CoMo catalysts supported on alumina and silica.
Development of better HDS catalysts requires to achieve (i) high dispersion of the Co(Ni)MoS active phase, (ii) complete sulfidation of the molybdenum and Co(Ni) precursor oxides phases, and (iii) high extent of promotion. It is well known that the strength of interaction between the support and the Co(Ni)–Mo supported phases has important effects on the above three parameters.
Alumina interacts strongly with the Co, Ni, and Mo oxide-supported phases, therefore, to achieve well-sulfided CoMo/Al2O3 and NiMo/Al2O3 HDS catalysts, it is necessary to modify the alumina surface with small amounts of another less interacting oxide to eliminate the most reactive alumina hydroxyl groups, which lead, during the catalyst preparation, to supported Mo oxide species difficult to reduce and sulfide. Many studies have been reported on the effect of different additives to alumina or silica to improve the catalyst performanceReference Breysse, Afanasiev, Geantet and Vrinat14–Reference Il Park, Nakano, Kim, Miyawaki, Yoon and Mochida17 or to characterize the surface properties.Reference Caillot, Chaumonnot, Digne, Poleunis, Debecker and Van Bokhoven18,Reference Mouat, George, Kobayashi, Pruski, Van Duyne, Marks and Stair19
Although it is known that the addition of SiO2 to the alumina surface improves the HDS catalyst performance,Reference Sánchez-Minero, Ramírez, Gutiérrez-Alejandre, Fernández-Vargas, Torres-Mancera and Cuevas-Garcia20,Reference Fernández-Vargas, Ramírez, Gutiérrez-Alejandre, Sánchez-Minero, Cuevas-García and Torres-Mancera21 a systematic study of the changes in activity, selectivity, dispersion, sulfidation, and extent of promotion for CoMo and NiMo hydrodesulfurization catalysts supported on Al2O3 and SiO2/Al2O3 has not yet been made. Accordingly, the aim of this work is to analyze how the HDS activity, selectivity, dispersion, sulfidation, and promotion of CoMo and NiMo HDS catalysts are affected by changing the nature of the catalyst support from pure Al2O3 to alumina grafted with 4 wt% SiO2. The state of the supported phases is investigated by combining X-ray photoelectron spectroscopy (XPS), transmission electron microscopy (TEM), and UV-vis-diffuse reflectance spectroscopy (UV-vis-DRS). For the evaluation of activity and selectivity, the catalysts were tested in the hydrodesulfurization of 4,6-dimethyldibenzothiophene.
II. MATERIALS AND METHODS
A. Preparation of supports and catalysts
To modify the surface of the γ-alumina support with SiO2, dry commercial γ-alumina (Sasol 2,5/210) was placed in a flask with 40 mL of anhydrous ethanol. To this solution, tetraethylorthosilicate (TEOS, 95%, Sigma-Aldrich, Saint Louis, Missouri) was added dropwise and stirred for 12 h at 78 °C. The amount of tetraethylorthosilicate was the necessary one to attain a loading of 4 wt% silica on the alumina surface. Then the solution was filtered under vacuum and the solid was dried at 100 °C for 24 h. Finally, the modified support was calcined at 550 °C for 4 h, using a heating ramp of 5 °C/min; 4 wt% SiO2 was enough to eliminate the most basic hydroxyl groups bonded to tetrahedral aluminum (IR band at 3767 cm−1),Reference Busca, Lorenzelli, Ramis and Willey22 as Fig. S1 shows. Hereafter, the silica-modified support is denoted as SAC.
All the catalysts were prepared with a Mo surface concentration of 2.8 Mo atoms/nm2 and the necessary amount of Co or Ni to obtain Ni/(Ni + Mo) or Co/(Co + Mo) ratios of 0.33. The catalysts were prepared conventionally by pore volume impregnation. The alumina (Al) or SiO2-modified alumina (SAC) supports were co-impregnated with aqueous solutions of ammonium heptamolybdate ((NH4)6Mo7O24·4H2O, 80% Aldrich, Saint Louis, Missouri) and nickel nitrate (Ni(NO3)2·6H2O, 98% Aldrich, Saint Louis, Missouri) or cobalt nitrate (Co(NO3)2·6H2O, 98% Aldrich, Milwaukee, Wisconsin). The impregnating solution was prepared in the following way: First, the desired amount of ammonium heptamolybdate was dissolved in 10 mL of water under agitation at 40 °C to obtain a solution of 8 × 10⁻⁵ Mo mol/mL. Then, 0.81 g of nickel nitrate or 0.82 g of cobalt nitrate was added. The pH of the resultant solution was 5. The impregnation of the support was made immediately after. At the conditions of the experiment, the solution was stable during the time of impregnation and no stabilizer was used. After impregnation, the catalysts were aged for 4 h, dried overnight at 100 °C, and calcined at 400 °C for 4 h, using a heating rate of 5 °C/min. Hereafter, the Ni- and Co-promoted catalysts supported on alumina will be named NiMoAl and CoMoAl, and their SiO2-modified counterparts NiMoSAC and CoMoSAC.
B. Characterization of catalysts
The textural properties (specific surface area, pore volume, and pore diameter) of the catalysts were obtained using an automatic Micromeritics TriStar 3000 nitrogen physisorption instrument, Micromeritics, Norcross, Georgia. Prior to the measurements, the samples were outgassed at 270 °C for 3 h in a Micromeritics Vac Prep 061 unit, Micromeritics, Norcross, Georgia.
The UV-vis DRS spectra of oxide catalysts were taken with a Cary 500 Varian spectrometer (Cary Instruments, Mulgrave, Australia) equipped with a diffuse reflectance sphere.
FTIR spectra of Al and SAC supports were collected using a Thermo Scientific Nicolet 6700 infrared spectrophotometer (Thermo Fisher, Madison, Wisconsin) with 4 cm−1 resolution and 100 scans per spectrum. A self-supported sample wafer of 5 mg/cm2 was outgassed in a special infrared cell connected to a high vacuum line. The sample was then heated at 450 °C for 2 h. Then, the sample was cooled to room temperature and the IR spectrum was collected.
A JEOL 2010 TEM (Akishima, Japan) operating at 200 kV with 1.9 Å point-to-point resolution was used for obtaining TEM micrographs of the sulfided catalysts. The samples were prepared by ultrasonically dispersing catalyst powder in heptane followed by ultrasonication for 20 min; then, a drop of the supernatant liquid was placed on a holey carbon film supported on a carbon-coated copper grid. For the statistical study of the distributions of size (length of the MoS2 crystallites) and stacking along the c axis, more than 300 crystallites of each sample were measured. The software used for processing the micrographs was ImageJ.
The system used for acquisition of XPS data was a seven-channel hemispherical spectrometer (model Alpha110) of Thermo Fisher (East Grinstead, U.K.) working with a monochromatic Al-Kα source with a photo-energy of 1486.7 eV at a take-off angle of 41°, operating at 1.2 × 10⁻⁹ torr. A glove box attached to the prechamber allowed to set samples in the system without exposing them to air. Due to the nonconductive nature of the samples, a flood gun for charging compensation was used during data acquisition.
The sulfided catalysts were transported under inert atmosphere and placed into the prechamber through the glove box. Then, they were outgassed at 3 × 10⁻⁷ torr for three hours. Then, the samples were transferred to the analysis chamber. The analysis began with survey acquisition at 50 eV of pass energy and 1 eV step size, followed by high-resolution scans of O 1s, Mo 3d, S 2p, Al 2p, and Co 2p and Ni 2p at 15 eV of pass energy and a step size of 0.1 eV. XPS data processing, including background removal and deconvolution of peaks, was performed using an interactive least-square computer program, AANALYZER® version 1.2, RDATAA (Robust Data Analysis), Chihuahua, Mexico. Prior to the analysis, shift correction of all spectra was done using Al 2p positioned at BE = 74.1 eV. The background was removed using Shirley–Sherwood and Shirley-Vegh-Salvi-Castle.Reference Herrera-Gomez, Bravo-Sanchez, Ceballos-Sanchez and Vazquez-Lepe23
The elemental composition (at.%) was obtained from the areas corresponding to each element in the survey spectra. Since there are several possible species for each element, the relative percent (rel.%) given in Table III of a given element is obtained by dividing its peak area by the total area formed by the different species of the same element present in the sample. For example, the relative percent of Ni in the NiMoS phase is obtained by the XPS ratio (NiNiMoS/NiT)100, where NiT = NiOX + NiNiMoS + NiXSY. The Ni atoms involved in the NiMoS phase were obtained multiplying the relative percent of Ni atoms in the NiMoS phase by the total theoretical Ni atoms divided by 100.
The elemental composition was calculated using the physical parameters described by Grant,Reference Grant24 where N A is the atomic density of the A element (proportional also to its stoichiometry),  ${{\delta {\sigma _{{\rm{cA}}}}} \over {\delta \Omega }}$ is the photoelectric differential cross-section of the atom, evaluated considering the correction for the effect of monochromator as described by Herrera-Gomez,Reference Herrera-Gomez25 where K A is the photoelectron kinetic energy, λA is the inelastic mean free path, which was calculated using NIST Electron Inelastic-Mean-Free-Path Database (Version 1.2) National Institute of Standards and Technology, Gaithersburg, Maryland. For the calculation of the relative percent, λA is the effective attenuation length and was calculated using NIST Electron Effective-Attenuation-Length Database (Version 1.3) National Institute of Standards and Technology, Gaithersburg, Maryland.
 $${N_{\rm{A}}} = {{{I_{\rm{A}}}{K_{\rm{A}}}} \over {{{\delta {\sigma _{{\rm{cA}}}}} \over {\delta \Omega }}{\lambda _{\rm{A}}}}}\quad .$$
C. Catalytic evaluation
Prior to the catalytic test, the catalysts were activated ex situ in a continuous flow reactor using 20 mL/min of a H2S (15 vol%)/H2 gas mixture at 400 °C during 4 h, with a heating ramp of 5 °C/min.
The reaction test was carried out in a batch Parr reactor operating at 320 °C and 1200 psig, using 200 mg of sulfided catalyst in 40 mL of 99%, Sigma-Aldrich, Saint Louis, Missouri containing 1000 ppm of sulfur as 97%, Aldrich, Saint Louis, Missouri. The main products from the HDS of 4,6-DMDBT were dimethyldiphenyl (DMDP), produced by the direct desulfurization route (DDS), and methylcyclohexyltoluene (MCHT) and dimethyldicyclohexyl (DMDCH), produced by the hydrogenation route (HYD). The main route of the reaction for the HDS of 4,6-DMDBT is the hydrogenation route because the direct desulfurization is sterically hindered by the presence of the methyl groups at positions 4 and 6.Reference Duayne whitehurst, Isoda and Mochida26–Reference Sánchez-Minero, Ramírez, Cuevas-Garcia, Gutierrez-Alejandre and Fernández-Vargas28 This emphasizes the importance of having catalysts with an enhanced hydrogenation function. Hereafter, k DDS is the rate constant for the direct desulfurization route, and k HYD represents the rate constant for the hydrogenation route (see Fig. S2 in the Supplementary Material). For the calculations of the rate constants, the following equations were established:
 $${r_{4,6}} = {{{\rm{d}}{C_{4,6}}} / {{\rm{d}}t}} = - \left( {{k_{{\rm{DDS}}}} + {k_{{\rm{HYD}}}}} \right){C_{4,6}}\quad ,$$
 $${r_{{\rm{DMDP}}}} = {{{\rm{d}}{C_{{\rm{DMDP}}}}} / {{\rm{d}}t = {k_{{\rm{DDS}}}}{C_{4,6}}\quad ,}}$$
 $${r_{{\rm{MCHT}}}} = {{{\rm{d}}{C_{{\rm{MCHT}}}}} / {{\rm{d}}t = {k_{{\rm{HYD}}}}{C_{4,6}} - {k_3}{C_{{\rm{MCHT}}}}\quad ,}}$$
 $${r_{{\rm{DMDCH}}}} = {{{\rm{d}}{C_{{\rm{DMDCH}}}}} / {{\rm{d}}t}} = {k_3}{C_{{\rm{MCHT}}}}\quad .$$
The reaction products were analyzed with an HP 6890 gas chromatograph (Wilmington, Delaware) equipped with a HP-1 column of 100 m length and 0.025 mm diameter, and a flame ionization detector. The samples of the reaction products were analyzed each hour during 6 h.
III. RESULTS AND DISCUSSION
A. Characterization of oxide catalysts
1. Nitrogen physisorption
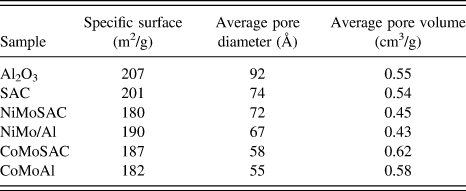
The textural properties (specific surface area, pore diameter, and pore volume) of supports and catalysts are shown in Table I. In general, a small decrease in the specific surface area and average pore diameter is observed when silica or the metallic phases are incorporated.
Textural properties of supports and catalysts and elemental analysis.

2. UV-vis-DRS
To find out if the incorporation of silica to the alumina support causes changes in the coordination of the supported metals, DRS spectra of the oxide samples were obtained.
The bands due to O−2 → Mo6+ charge transfer transitions for tetrahedrally coordinated Mo6+ (MoTd) appear in the 210–230 nm region, while the absorption in the 250–330 nm region is ascribed to octahedrally coordinated Mo6+(MoOh).Reference Weber29,Reference Fournier, Louis, Che, Chaquin and Masure30 For all the catalysts, the two absorption peaks overlapped into one (see Figs. S3(a) and S3(b) in the Supplementary Material)
The UV-spectra of the Mo oxide species in the CoMoAl catalyst showed a broad absorption band suggesting that both tetrahedral and octahedral molybdenum species are present. A mixture of tetrahedral and octahedral Mo species is also present in the NiMoAl catalyst. By contrast, for molybdenum supported on SiO2–Al2O3, NiMoSAC, and CoMoSAC catalysts, a narrower absorption band shifted to lower wavelengths was present. According to Fournier et al.,Reference Fournier, Louis, Che, Chaquin and Masure30 the position and the band width of polymolybdate species in octahedral coordination (MoOh) are affected by the aggregate size. So, the shift of the absorption from high to low wavelength may indicate the presence of smaller well-dispersed MoTd and MoOh species.
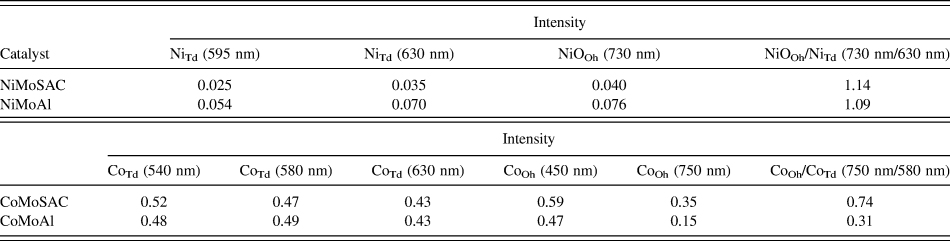
A doublet at 595 and 630 nm, ascribed to Ni tetrahedrally coordinated (NiTd) and an absorption at 730 nm, associated with octahedral nickel oxide species (NiOOh) are reported in the literature.Reference Viscarra Rossel, McGlynn and McBratney31 The DRS spectra of NiMoAl and NiMoSAC in the 500–800 nm region (see Fig. S3(c) in the Supplementary Material) and the intensities of each band are reported in Table II. The 730 nm (NiOOh)/630 nm (NiTd) intensity ratio is slightly higher for NiMoSAC, indicating a slightly higher proportion of nickel octahedrally coordinated compared to NiMoAl (Table II column 5).
DRS-UV-Vis results; Intensity of the bands assigned to nickel and cobalt tetrahedrally and octahedrally coordinated, respectively.

In the 400–800 nm region, for Co-promoted samples [Fig. S3(d) in the Supplementary Material], the addition of SiO2 produces a decrease of the triplet with maxima at 540, 580, and 630 nm associated with cobalt tetrahedrally coordinated.Reference Stranick, Houalla and Hercules32,Reference Herrera, Balzano, Borgna, Alvarez and Resasco33 For CoMoSAC, a significant increase in the absorption bands at 450 and 750 nm associated with octahedral Co species (CoOh) is observed. The results in Table II column 7 show that the CoOh (750 nm)/CoTd (580 nm) ratio is considerably higher for the CoMoSAC catalyst. Therefore, it appears that the incorporation of SiO2 to the alumina support induces a higher proportion of octahedrally coordinated Co species. This effect is not as clear for the Ni-promoted catalyst.
B. Characterization of sulfided catalysts
1. TEM
The performance of HDS catalysts depends, among other things, on the morphology and dispersion of the active phase (MoS2).
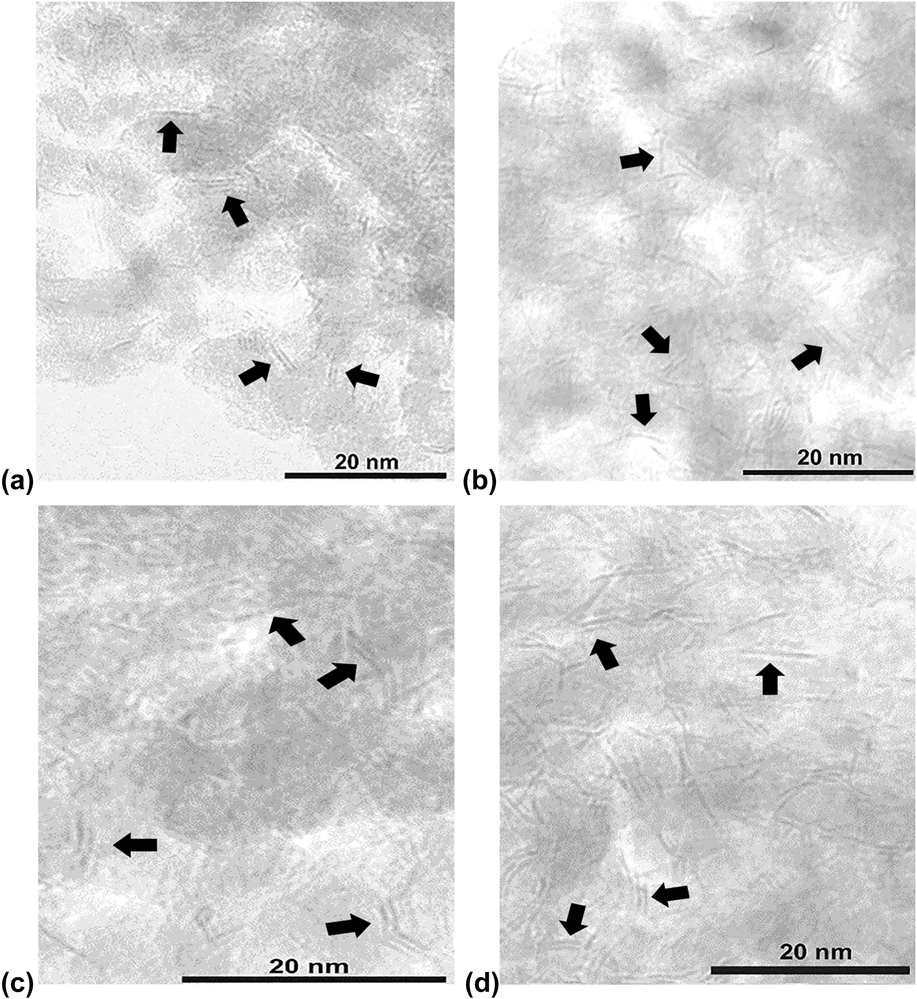
Micrographs of the supported MoS2 crystallites for the series of catalysts used here can be observed in Fig. 1. All the catalysts display different slab lengths. In general, a larger population with one layer and length lower than 5 nm is observed indicating that all the catalysts present well-dispersed MoS2 crystallites displaying the typical MoS2 slabs with an interplanar distance of 6.1 Å.Reference Kasztelan, Toulhoat, Grimblot and Bonnelle34–Reference Hensen, Kooyman, Van der Meer, Van der Kraan, De Beer, Van Veen, Van Santen, Hensen, Kooyman, Van der Meer and Van der Kraan36 The length and stacking distributions of the MoS2 crystallites are presented in Fig. S4 in the Supplementary Material. NiMoAl shows shorter MoS2 crystallites, between 21 and 40 Å, while the rest of the samples show maximum population of MoS2 crystallite lengths between 41 and 60 Å. NiMoSAC and CoMoSAC show higher stacking than the catalysts supported on γ-alumina (NiMoAl and CoMoAl), which display mostly single layer MoS2 crystallites.
TEM micrographs of sulfided catalysts (a) NiMoSAC, (b) NiMoAl, (c) CoMoSAC, and (d) CoMoAl.

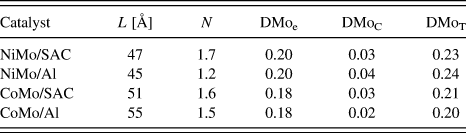
The fraction of Mo atoms in edges and corners of the MoS2 crystallites was estimated according to the MoS2 hexagonal geometrical model reported by Kasztelan et al.Reference Kasztelan, Toulhoat, Grimblot and Bonnelle34 These values are reported in Table III. In general, there is little difference between NiMoAl and NiMoSAC catalysts, although the former shows slightly better dispersion. The cobalt-based catalysts show practically the same dispersion.
Average length (L), average number of layers (N), and Mo distribution for MoS2 crystallites.

DMoe = Mo in edge/total Mo atoms; DMoC = Mo in corner/total Mo; DMoc+e = Mo in corner + Mo in edge/total Mo atoms.
To enquire more on the dispersion of the catalysts and to see if the incorporation of SiO2 to the alumina support affects the sulfidation of Mo and the formation of the so-called Ni(Co)MoS phase, XPS analysis of the sulfided samples was performed.
2. XPS
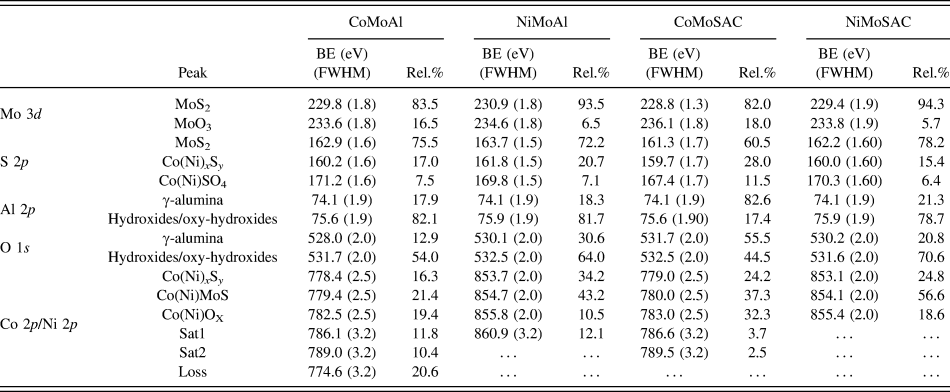
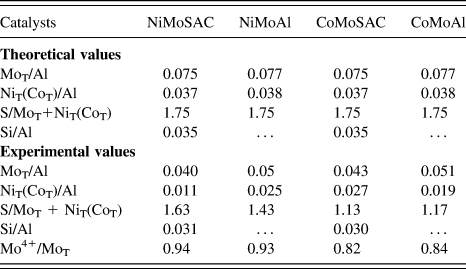
XPS is a suitable technique to explore the surface properties of HDS catalystsReference Toledo-Antonio, Cortés-Jácome, Angeles-Chávez, Escobar, Barrera and López-Salinas37–Reference Li, Li, Chu, Liu and Nie39 since it provides information on the electronic state and the distribution of the active metals on the solid surface. Concerning the modification of the alumina support surface, Table IV shows the Si/Al XPS ratio for NiMoSAC and CoMoSAC. Both catalysts have similar Si/Al ratio ∼0.03, which is close to 0.035, that is, the theoretical value assuming homogeneous distribution of SiO2 in the solid. This indicates that Si is well dispersed.
Binding energy (eV) with full width at half maximum and relative percentage of each species in sulfided catalysts.

The relative percent (rel.%) corresponds to the element and not to the chemical phase.
The sulfidation extent of molybdenum was estimated through the Mo4+/MoT ratio, and the fractions of NiMoS or CoMoS promoted phases by the NiNiMoS/NiT or CoCoMoS/CoT ratios, respectively.
a. S-species
Three sulfur species were found on the surface of the catalysts (Table IV). A peak at ∼160 eV corresponds to sulfur from sulfide phases (NixSy or CoxSy, respectively), that at ∼162.4 eV is ascribed to S2− and a small fraction of terminal  ${\rm{S}}_2^{2 - }$ of the MoS2 phase.Reference Qiu and Xu38 Finally, a small peak at ∼170.4 eV is assigned to sulfur from sulfate (NiSO4 or CoSO4, respectively).
b. Mo-species
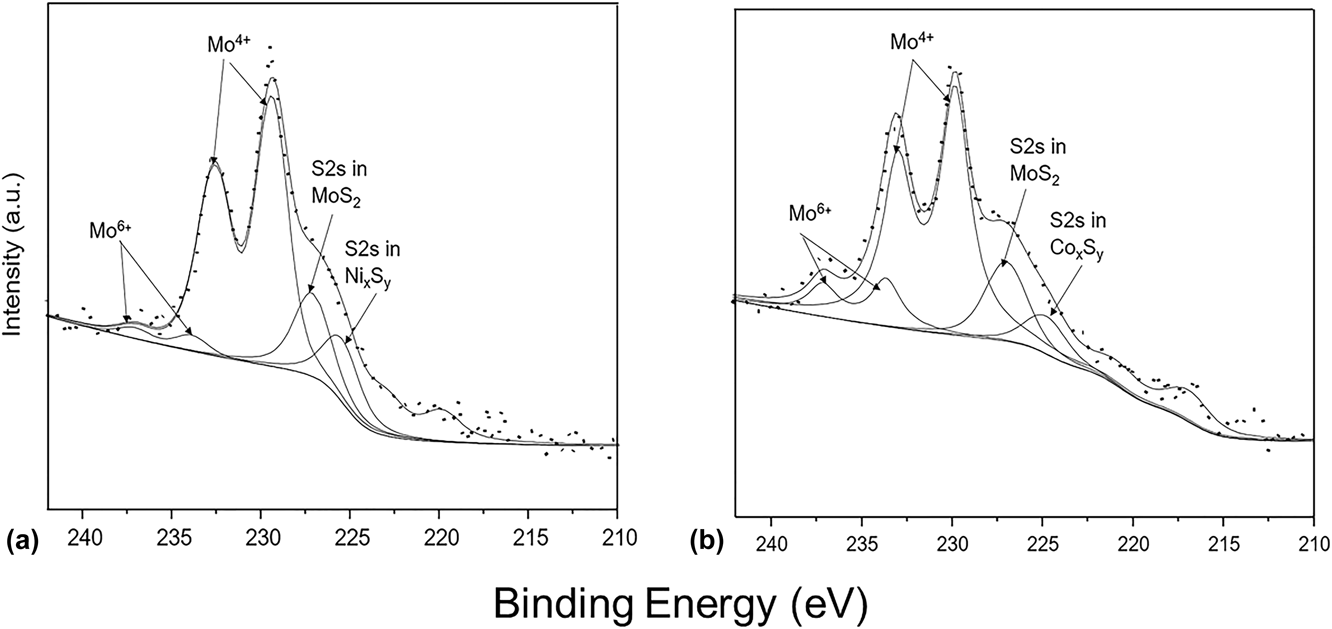
The deconvolution of the XPS Mo 3d–S 2s spectra is shown in Fig. 2 (Only spectra of the NiMoSAC and CoMoAl samples are shown). The XPS spectra in the region of S 2p, Ni 2p, and Co 2p for the NiMoSAC and CoMoAl catalysts are in Fig. S5 of the Supplementary Material. All spectra were fitted with two Mo 3d doublets with the characteristic ratio between spin–orbit doublet of 0.66. Based on the positions of Mo 3d 5/2, the BE at ∼229.9 eV is associated with Mo4+, which is characteristic of molybdenum sulfide (MoS2), and Mo6+ at 233.6 eV characteristic of Mo in MoO3. The binding energy values for the different atomic species reported in Table IV are in good agreement with those reported in the literature.Reference Qiu and Xu38,Reference Damyanova, Petrov and Grange40
XPS Mo 3d–S 2s spectra of the sulfided catalysts (a) NiMoSAC and (b) CoMoAl.

c. Ni(Co)-species
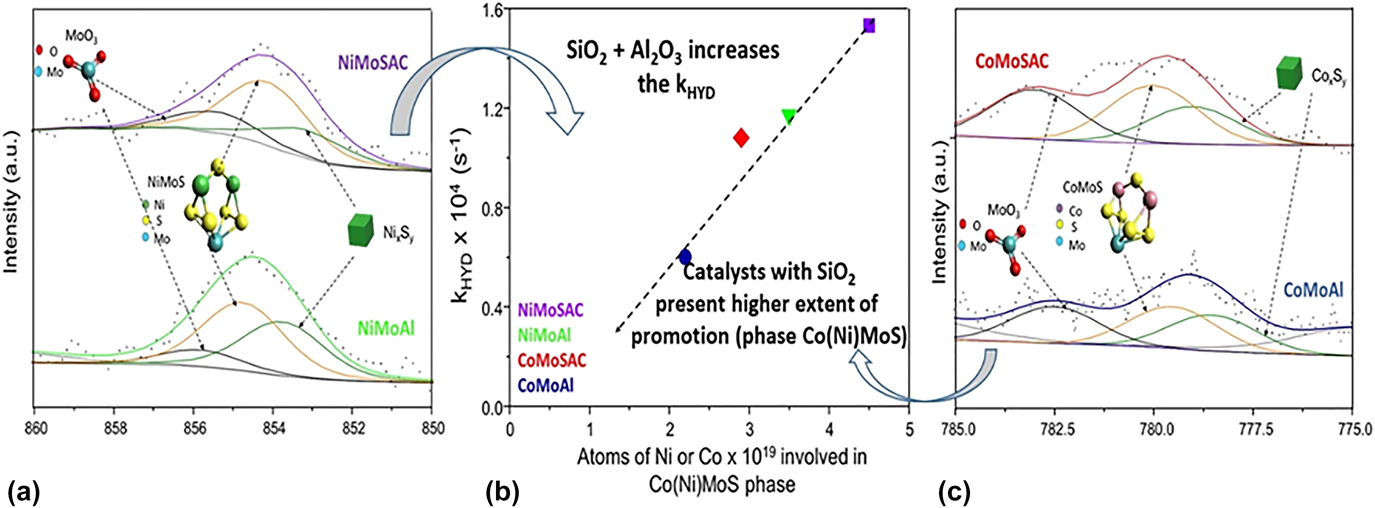
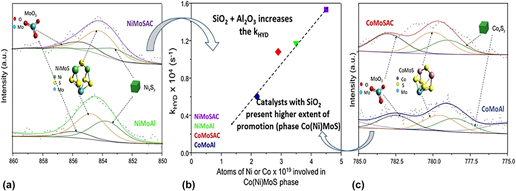
The Ni 2p and Co 2p spectra for the sulfided catalysts [Figs. 3(a) and 3(c)] show that not all the Ni(Co) and Mo atoms are sulfided and contributing to the promoted Ni(Co)MoS phase.
(a) XPS Ni 2p spectra of the sulfided catalyst, (b) relationship between hydrogenation rate constant (k HYD) versus Ni or Co atoms involved in the Co(Ni)MoS phase, and (c) XPS Ni 2p spectra of the sulfided catalyst.

Since Ni(Co)MoSReference Walton, Lauritsen, Topsøe and Besenbacher41 is the most active phase, it is important to determine the fraction of NiMoS or CoMoS phase in the sulfided catalysts. As reported before,Reference Le, Afanasiev, Li, Long and Vrinat42 the Ni 2p 3/2 level ascribed to the mixed NiMoS phase shows higher binding energies than nickel sulfide (853.6 eV) since the Ni atom transfers electronic density to its Mo neighbor atom.
For both core levels Ni 2p and Co 2p, the fitting was performed only in the 2p 5/2 branch, using Shirley–Sherwood background subtraction. As can be seen in Fig. 3(a), the Ni 2p spectra for NiMoSAC was decomposed by considering the presence of NixSy sulfide phases (Ni2S3, Ni9S8, or NiS) with binding energy at 853.1 eV, the so-called NiMoS phase with BE at 854.1 eV, and nickel oxide at 855.4 eV. Regarding nickel oxide, the BE at about 855.8 eV indicates Ni2O3 or Ni(OH)2 but is not compatible with NiO, which presents a lower BE (∼853.5 eV).
Meanwhile, the Co 2p spectrum was fitted considering a LMM Auger peak at 774.6 eV,Reference Cabrera-German, Gomez-Sosa and Herrera-Gomez43 cobalt sulfide phases CoxSy like Co2S3, Co9S8, or CoS (BE at 778.4 eV),Reference Toledo-Antonio, Cortés-Jácome, Angeles-Chávez, Escobar, Barrera and López-Salinas37,Reference Okamoto and Kubota44 a peak at 779.4 eV arising from the CoMoS phase, cobalt oxide (CoOX) with BE at 782.5 eV, which is close to that of Co in Co2O3 (781.4 eV) or Co(OH)2 (782 eV) but not with the BE of Co in CoO (780 eV),Reference Ramos, Berhault, Ferrer, Torres and Chianelli12 as shown in Fig. 3(c). Finally, two satellite peaks at 786.1 eV and 789.0 eV ascribed to Co2O3 and Co3O4, respectively (see Table IV).
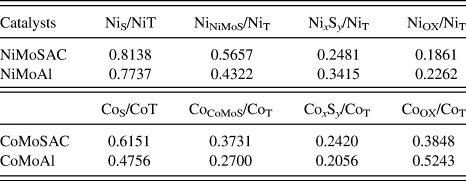
The quantitative analysis of the XPS results for the sulfided catalysts is summarized in Tables V and VI.
XPS: Atomic ratio results of sulfided catalysts (400 °C/4 h).

XPS analysis of nickel and cobalt species for sulfided catalysts.

NiS = sulfidic nickel = NixSy + NiNiMoS; CoS = sulfidic cobalt = CoxSy + CoCoMoS; NiT = total nickel = NiS + NiNiMoS + NiOX (oxidic nickel); CoT = total cobalt = CoS + CoCoMoS + CoOX (oxidic cobalt).
The values of the experimental MoT/Al ratios (Table V) indicate that Mo was better dispersed on the catalyst supported on Al2O3, in agreement with the DRS-UV-vis observations that show, for the oxide catalysts, the presence of relatively more Mo in tetrahedral coordination, indicating a good dispersion in the oxide state that was likely transferred to the sulfide state.
One could expect that the weaker interaction between the molybdenum species and the SiO2–Al2O3 carrier (SAC) would favor a better sulfidation of molybdenum; however, the Mo4+/MoT ratio shows that in fact, the sulfidation of molybdenum is the same for the catalysts with the same promoter and different supports, ∼0.94 for NiMoSAC and NiMoAl, and of ∼0.84 for CoMoSAC and CoMoAl (see Table V) indicating that, at the experimental conditions used here, the sulfidation of Mo is affected more by the type of promoter (Ni or Co) than by the type of support (Al2O3 or SiO2–Al2O3).
Interestingly and in line with the above result, no beneficial effect of the addition of silica to alumina was observed for nickel sulfidation (NiS/NiT). However, the cobalt sulfidation ratio, CoS/CoT, was higher for the catalysts containing SiO2 (see Table VI). This result could be associated with the fact that the incorporation of SiO2, which interacts preferably with the tetrahedral centers on alumina, prevents the formation of highly stable tetrahedral cobalt species and favors the formation of octahedrally coordinated cobalt species easier to sulfide.
Other important parameters for the catalyst performance are the NiNiMoS/NiT, or CoCoMoS/CoT ratios, that indicate the extent of promotion.Reference Walton, Lauritsen, Topsøe and Besenbacher41
Although the Ni sulfidation degree is almost the same for the catalysts with and without Si, a higher fraction of sulfidic Ni corresponding to NixSy (Ni2S3, Ni9S8, or NiS) is present in the catalyst supported on alumina (NiMoAl) compared to NiMoSAC (see Table V column 4). On the other hand, CoMoSAC and CoMoAl have almost the same fraction of sulfidic Co associated with CoxSy species (Co2S3, Co9S8, or CoS) segregated from the MoS2 phase (see Table VI column 4).
The results indicate that the incorporation of SiO2 to the surface of Al2O3 enhances the formation of the NiMoS or CoMoS phases (Table V column 3). This is understandable since SiO2 interacts with the OH alumina groups associated with tetrahedral Al, leading to a higher proportion of Mo and Co(Ni) in octahedral coordination, as the DRS-UV-vis results show for NiMoSAC and CoMoSAC. This favors the interaction between octahedral promoter and Mo species during the sulfidation step and therefore, the formation of the promoted CoMoS and NiMoS phases.
The fact that the extent of promotion, NiNiMoS/NiT or CoCoMoS/CoT, is higher for the catalysts based on nickel than for their cobalt counterparts (see Table V column 3) can be related to the reports that indicate that NiMo catalysts can incorporate the Ni promoter on three different edges of a dodecagonal NiMoS particle, in contrast with CoMo catalysts where the Co-promoter is incorporated only on the sulfur edge of a hexagonal CoMoS cluster.Reference Topsøe10,Reference Lauritsen, Kibsgaard, Olesen, Moses, Hinnemann, Helveg, Nørskov, Clausen, Topsøe, Lægsgaard and Besenbacher45
3. Catalytic activity
a. HDS of 4,6-DMDBT
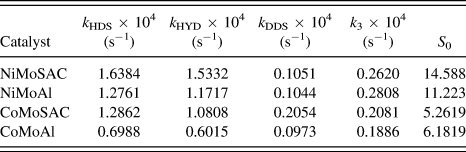
The values of the hydrodesulfurization rate constants at 320 °C and 1200 psig are shown in Table VII. The global reaction rate constant, k HDS, is higher when SiO2 is present in the catalyst and follows the order: NiMoSAC > NiMoAl and CoMoSAC > CoMoAl. There is a superiority of NiMo and CoMo catalysts supported on SiO2–Al2O3 over their counterparts supported on Al2O3 (see Table VII).
Pseudo-first-order reaction rate constants for the transformation of 4,6-DMDBT and initial HYD/DDS selectivity ratio, S 0, calculated for the batch reactor operating at T = 320 °C, P = 1200 psig.

S 0 = HYD/DDS initial selectivity ratio.
The results in Table VII also indicate that, for the NiMo catalysts, the incorporation of SiO2 to the support has no effect on the direct desulfurization rate constant, whereas for the CoMo catalysts, an improvement of the direct desulfurization rate constant is clear. This can be associated in part with the higher extent of sulfidation and promotion achieved in the cobalt promoted catalysts supported on SAC respect to those supported on Al. The values of the rate constants and initial selectivity confirm that 4,6-DMDBT is transformed mainly by the hydrogenation reaction route. The initial reaction selectivity for the Ni-based catalysts is higher for the catalyst supported on SiO2–Al2O3 than for its alumina-supported counterpart. By contrast, for the Co catalysts, the opposite occurs. This can be related in part to the higher promotion achieved for CoMoSAC that favors the DDS functionality respect to CoMoAl.
The observed raise in the hydrogenation rate constant with the addition of SiO2 can be related to a greater population of MoS2 crystallites with higher stacking and lower interaction with the support (Type II Co(Ni)MoS structures), as well as with an increased promotion respect to their alumina-supported counterparts (see Table VI). The good correlation between the degree of promotion with the hydrogenation rate constant displayed in Fig. 3(b), agrees with literature reports that indicate that promotion favors the appearance of brighter (more metallic) brim sites, which can perform hydrogenating reactions.Reference Besenbacher, Brorson, Clausen, Helveg, Hinnemann, Kibsgaard, Lauritsen, Moses, Nørskov and Topsøe11
The global hydrodesulfurization rate constant (k HDS = k DDS + k HYD) is also directly proportional to the fraction of promoter atoms (Ni and Co) present in the Ni(Co)MoS phase (see Fig. S6 in the Supplementary Material), indicating that for the HDS of 4,6-DMDBT, the fraction of promoter in the Ni(Co)MoS phases not only favors the direct desulfurization route but also enhances the performance of the sites responsible for the hydrogenation route.
The better catalytic performance of NiMoSAC and CoMoSAC with respect to NiMoAl and CoMoAl can be ascribed in part to the weaker interaction between molybdenum and the SiO2–Al2O3 carrier (SAC) that facilitates the formation of better sulfided Co(Ni)–Mo–S structures, favoring the formation of the sites responsible for the hydrogenation route, which is the main transformation route for the HDS of 4,6-DMDBT.
Grafting SiO2 onto the surface of alumina has two main effects on the performance of the catalysts. One of them is to decrease the interaction of Mo, Ni, and Co with the support leading to greater availability of Ni and Co to form the mixed Ni(Co)MoS active phase (as the XPS results show). The other effect is the elimination of the most reactive surface hydroxyl groups bonded to tetrahedral Al3+, as Fig. S1 shows.Reference Sánchez-Minero, Ramírez, Gutiérrez-Alejandre, Fernández-Vargas, Torres-Mancera and Cuevas-Garcia20 These hydroxyl groups are responsible for the strong interaction that leads, during the calcination of the catalyst precursors, to Co and Ni species difficult to sulfide. Therefore, grafting SiO2 to the alumina surface leads to more Co and Ni species available to form the active phase. On the other hand, it is well known that Co favors the direct desulfurization, whereas Ni is more used to improve the hydrogenating function of the catalyst.Reference González-Cortés46 Therefore, the difference in the effect on the direct desulfurization rate constant is not only associated with the greater promotion (as the XPS results show) but also mainly to the nature of the promoter.
IV. CONCLUSIONS
For CoMo and NiMo catalysts, grafting 4.0 wt% silica on the surface of the alumina support induces better catalytic performance in the hydrodesulfurization of 4,6-DMDBT.
The global rate constant (k DDS + k HYD) for the HDS of 4,6-DMDBT correlates well with the fraction of promoter present in the Co(Ni)MoS phases, as obtained from XPS, indicating that a high level of promotion is not only beneficial to the direct desulfurization route but also improves the performance of the sites responsible for the hydrogenation route.
The addition of SiO2 to the alumina support does not affect the degree of sulfidation of Mo (estimated as the Mo4+/MoT ratio), which is mostly affected by the type of promoter with Ni inducing a larger value of the Mo4+/MoT ratio.
The global sulfidation of the Ni species, estimated as the NiS/NiT ratio, is not affected by the addition of silica to the alumina support, but the sulfidation of cobalt is significantly improved. This can be related to the greater amount of tetrahedral Co species, difficult to sulfide, formed over alumina, which diminish when SiO2 is incorporated.
The extent of promotion (NiNiMoS/NiT) is larger for the Ni-promoted catalysts, in line with the fact that Ni compared to Co can promote a greater number of edges in the MoS2 nanoparticles.
The better performance of the NiMoSAC and CoMoSAC catalysts over their alumina-supported counterparts, NiMoAl and CoMoAl, seems to be mainly related to the higher extent of promotion and sulfidation achieved in the catalysts with SiO2, fact that is reflected in a greater rate constant for the hydrogenation route, which is the main transformation route for the HDS of 4,6-DMDBT.
Supplementary Material
To view supplementary material for this article, please visit https://doi.org/10.1557/jmr.2018.263.
ACKNOWLEDGMENTS
Adolfo-Romero Galarza acknowledges postdoctoral grant from CONACyT. We acknowledge financial support from DGAPA-UNAM, project PAPIIT-IN-113015. We thank Mariela Bravo-Sanchez (Universidad de Guadalajara) for her discussion about the XPS results, Ivan Puente for the TEM work, and Alberto Herrera-Gómez (CINVESTAV-Unidad Querétaro, Mexico) for providing computer program AANALYZER® version 1.2.