Chrononutrition concerns the timing of food intake within the 24-h cycle and its relation to sleep–wake and metabolic rhythms, including when daily intake begins, how long intake continues and how fasting is positioned across day and night(Reference St-Onge, Ard and Baskin1–Reference Longo and Panda3). These temporal characteristics complement conventional measures of energy intake, nutrient composition and diet quality(Reference Leech, Worsley and Timperio4). First eating time and breakfast omission have been examined in relation to mortality(Reference Kant and Graubard5–Reference Sun, Rong and Liu7). Eating-window duration, eating frequency and night-time fasting have also been studied in relation to mortality or biological ageing(Reference Mao, Grant and Kritchevsky8,Reference Wang, Zhang and Xu9) . However, a clock-time exposure recorded in free-living adults is not equivalent to a structured time-restricted-eating intervention. Observed intake timing can reflect work schedules and sleep timing(Reference Kecklund and Axelsson10). It can also reflect appetite, treatment routines, access to food and deliberate dietary choices. For chronic disease populations, the same recorded eating window may therefore arise from planned meal organisation or from symptoms and disrupted daily routines.
First eating time and eating-window duration describe related but non-identical aspects of daily intake. Two people who begin eating at the same clock time can have different windows because their final energetic intake occurs at different times; conversely, equal-duration windows can occupy different phases of the day. Evaluating either measure separately therefore does not identify the participant-level combination of start time and duration(Reference Leech, Worsley and Timperio4,Reference Leech, Worsley and Timperio11) . A joint classification instead asks whether recurring configurations distinguish groups of adults with similar daily intake schedules. Latent profile modelling can classify participants under distributional assumptions, whereas factor analysis represents covariance among variables through latent dimensions(Reference Leech, Worsley and Timperio11,Reference Fabrigar, Wegener and MacCallum12) . K-means was selected because the objective was transparent participant classification using two standardised continuous timing measures. Candidate-k diagnostics, minimum group size, interpretability and repeated-seed stability were used to assess the solution(Reference Hartigan and Wong13,Reference Rousseeuw14) .
The clinical meaning of an eating-timing configuration may differ across chronic diseases. In diabetes, glucose-lowering treatment and carbohydrate-distribution plans can shape meal schedules(Reference Evert, Dennison and Gardner15). In chronic kidney disease, therapeutic diets and treatment schedules can affect intake(Reference Ikizler, Burrowes and Byham-Gray16). Cancer and its treatment can reduce intake through anorexia, early satiety, gastrointestinal symptoms, fatigue and cachexia(Reference Fearon, Strasser and Anker17,Reference Muscaritoli, Arends and Bachmann18) . In CVD, hypertension and hyperlipidaemia, eating timing may more strongly reflect employment, household routine, sleep, co-morbidity and medication use(Reference St-Onge, Ard and Baskin1,Reference Kecklund and Axelsson10) . Existing mortality studies have generally examined individual timing measures in broad populations. It remains unclear whether joint timing configurations show comparable associations across distinct chronic disease contexts; here, heterogeneity refers specifically to variation across the six disease domains and across all-cause and cause-specific mortality outcomes.
Three methodological issues are particularly relevant. Dietary timing varies between days(Reference Dodd, Guenther and Freedman19). The National Health and Nutrition Examination Survey (NHANES) inference depends on preserving its complex sampling design(20). Analyses across several disease domains also require explicit control of multiplicity. Non-proportional hazards and incomplete behavioural covariates can obscure or destabilise average associations. We therefore used repeated dietary assessment, design-based survival models, multiple imputation and prespecified sensitivity analyses.
The NHANES provides nationally representative dietary recalls with clock-time records, extensive covariate measurement, complex-sample design variables and National Death Index linkage(20–Reference Moshfegh, Rhodes and Baer22). These features permit participant-level timing configurations to be derived independently of mortality and evaluated prospectively after baseline examination. We used standardised mean first eating time and eating-window duration to identify K-means patterns, selecting k = 3 from k = 2–6 by separation, cluster size, interpretability and stability across ten prespecified random seeds. We then compared all-cause mortality across six observed chronic disease domains and, second, heart disease mortality in the CVD and hypertension domains and cancer mortality in the cancer domain. The study examined whether 2-d eating-timing patterns carried consistent mortality information across these clinical contexts while accounting for survey design, missing covariates, multiple testing and departures from proportional hazards.
Methods
Study design and participants
We used NHANES 2005–2016 data linked to the Continuous NHANES Public-use Linked Mortality Files, 2019(20,21) . NHANES is a series of cross-sectional examinations of the non-institutionalised US civilian population conducted with a complex, multistage probability design. National Death Index linkage provides prospective mortality follow-up after each participant’s baseline examination. Reporting followed the STROBE-nut extension for nutritional epidemiology(Reference Lachat, Hawwash and Ocke23). Eligible participants were aged 20 years or older and had two reliable 24-h dietary recalls, valid first eating time and eating-window data, mortality status and examination-based follow-up, and complete dietary weight, stratum and primary sampling-unit information. Sequential exclusions are shown in Figure 1. The final primary sample comprised 26 712 adults. Counts throughout the participant-flow diagram are unweighted.
Participant flow diagram. Participant selection for the primary 2-d analysis in NHANES 2005–2016. Counts are unweighted, and two reliable dietary recalls were required. Examination-based follow-up was derived from PERMTH_EXM. The final 26 712 participants were classified as early-start (n 7183), intermediate (n 15 474) or late-start (n 4055). NHANES, National Health and Nutrition Examination Survey; PERMTH_EXM, months from examination to death or censoring.

Figure 1. Long description
The flowchart begins with NHANES 2005-2016 adults aged 20 years or older, totaling 34,180 participants. The first step excludes 3,613 participants due to unreliable or missing Day 1 dietary recall, resulting in 30,567 participants with reliable Day 1 dietary recall. The next step excludes 3,791 participants due to unreliable or missing Day 2 dietary recall, leaving 26,776 participants with reliable Day 2 dietary recall. Following this, 29 participants are excluded due to incomplete Day 1 and Day 2 first eating time and eating-window data, resulting in 26,747 participants with complete data. The subsequent step excludes 35 participants who do not meet mortality linkage or follow-up criteria, leading to 26,712 eligible participants. These participants are then categorized into three patterns: early-start pattern with 7,183 participants, intermediate pattern with 15,474 participants, and late-start pattern with 4,055 participants.
Eating-timing assessment
Dietary intake was collected using the US Department of Agriculture Automated Multiple-Pass Method; Day 1 was obtained in the mobile examination centre and Day 2 by telephone on a non-consecutive day(Reference Moshfegh, Rhodes and Baer22). For each reliable recall day, foods and beverages with positive recorded energy were treated as energetic intake events. Records at the same clock time were aggregated. First eating time was the earliest positive-energy event, last eating time was the latest event and the eating window was the elapsed interval from the first to the last event within that day. Eating frequency was the number of distinct clock times with at least 50 kcal(Reference Leech, Worsley and Timperio24). Night-time fasting was defined algebraically as 24 h minus the eating-window duration. Day-specific values were calculated before averaging Day 1 and Day 2 at the participant level. Thus, the primary exposure required two reliable days and did not substitute a single day when Day 2 was unavailable. Detailed definitions and data sources are provided in Supplementary Table 1.
Pattern derivation
Participant-level mean first eating time and eating-window duration were standardised to z scores so that both variables contributed on a comparable scale to Euclidean distance. K-means solutions with k = 2–6 were evaluated using average silhouette width, the ratio of between-cluster to total sum of squares, minimum cluster proportion, interpretability and stability across ten prespecified random seeds(Reference Hartigan and Wong13,Reference Rousseeuw14) . Mortality outcomes were not used to select the solution. The k = 3 solution balanced separation with adequate cluster sizes and yielded identical membership across the ten seeds (adjusted Rand index = 1·000). Patterns were ordered by first eating time and labelled early-start, intermediate and late-start. Candidate solutions and centres are reported in Supplementary Table 2 and Supplementary Figures 1 and 2; the 2-d and independent Day 1 profiles are compared in Supplementary Figure 4.
Chronic disease cohorts and mortality outcomes
Six overlapping baseline disease domains were defined from observed NHANES information: CVD (self-reported CHD, congestive heart failure, angina, heart attack or stroke), hypertension, diabetes, chronic kidney disease, cancer and hyperlipidaemia. Hypertension incorporated measured blood pressure, physician diagnosis and antihypertensive medication use(Reference Chobanian, Bakris and Black25). Diabetes incorporated physician diagnosis, glycaemic criteria and treatment(26). Chronic kidney disease was defined by estimated glomerular filtration rate below 60 ml/min per 1·73 m2 or urinary albumin:creatinine ratio of at least 30 mg/g(Reference Levey, Stevens and Schmid27,28) . Cancer was self-reported physician-diagnosed malignancy. Hyperlipidaemia incorporated lipids, diagnosis and lipid-lowering treatment(29). Full operational definitions are in Supplementary Table 1. Domain membership was based on observed baseline evidence and was not created by imputation.
Mortality status, follow-up and underlying cause of death came from National Death Index linkage(21). Primary follow-up used person-months from the mobile examination centre date to death or administrative censoring on 31 December 2019 (PERMTH_EXM), divided by 12. MORTSTAT identified participants assumed alive or deceased. All-cause mortality was examined in each disease domain. Secondary outcomes were heart disease mortality in the CVD and hypertension domains and cancer mortality in the cancer domain, using the public-use ICD-10-based UCOD_LEADING groups(21). In cause-specific Cox models, death from another cause was censored at the recorded death time.
Covariates
The adjustment set included age, age squared, sex, race/ethnicity, marital status, educational attainment, family income:poverty ratio, smoking, alcohol use, total physical activity, BMI, total energy intake, Healthy Eating Index-2015 score, sleep duration, Patient Health Questionnaire-9 score and coexisting chronic diseases other than the disease defining the analytic domain. HEI-2015 and PHQ-9 scoring followed their published specifications(Reference Krebs-Smith, Pannucci and Subar30,Reference Kroenke, Spitzer and Williams31) . Race/ethnicity was coded as Non-Hispanic White, Non-Hispanic Black, Mexican American, or Other races. Covariates were selected a priori to address demographic, socio-economic, behavioural, dietary, sleep, mental-health and co-morbidity-related confounding. Covariate definitions and coding are detailed in Supplementary Table 1.
Statistical analysis
The 12-year dietary weight was calculated as the NHANES 2-d dietary recall weight divided by six, following the combined-cycle weighting principle(20). For each completed dataset, the full survey design was constructed with dietary weights, strata and primary sampling units before restriction to each observed disease domain. Lonely primary sampling units were handled with the survey adjustment option(Reference Lumley32). Baseline continuous variables are presented as survey-weighted means with design-based standard errors and categorical variables as unweighted counts with survey-weighted percentages. Maximum pairwise standardised mean differences were calculated from unrounded weighted summaries (Table 1)(Reference Austin33). Weighted pattern profiles are shown in Table 2.
Weighted baseline characteristics according to 2-d eating-timing patterns (Mean values with their standard errors)

Table 1. Long description
A table comparing baseline characteristics across different eating-timing patterns. The table has 26 rows and 10 columns. Column headers are Characteristic, Level, Overall (n 26 721), Early-start (n 7183), Intermediate (n 15 474), Late-start (n 4055), and Maximum pair-wise SMD. Row labels include Age (years), Family income/poverty ratio, Sex, Race/ethnicity, Educational attainment, Marital status, Total physical activity (MET-min/week), Smoking status, Alcohol use, BMI (kg/m^2), Total energy intake (kcal/d), Healthy Eating Index-2015 score, Sleep duration (h/d), PHQ-9 score, CVD, Hypertension, Diabetes, Chronic kidney disease, Cancer, Hyperlipidaemia. Each row provides mean values and standard errors for each characteristic across different eating-timing patterns.
SMD, standardised mean difference; MET, metabolic equivalent; PHQ-9, 9-item Patient Health Questionnaire.
Values are survey-weighted mean (se) for continuous variables and unweighted n (survey-weighted %) for categorical variables, based on observed baseline data. Percentages use non-missing within-pattern denominators. SMD is the maximum absolute pairwise standardised mean difference across the three eating-timing patterns, calculated from unrounded weighted summaries. Variable-level missingness is reported in Supplementary Table 3.
Weighted eating-timing profiles of the K-means-derived patterns

Table 2. Long description
A table comparing eating patterns and their characteristics. The table has three rows and seven columns. The columns are labeled Pattern, n, Weighted share (percent), First eating time (h), Last eating time (h), Eating window (h), Night-time fasting (h), and Eating frequency, episodes/d. The rows are labeled Early-start, Intermediate, and Late-start. Row 1: Early-start, 7183, 30.2, 6.04, 20.67, 14.63, 9.37, 4.78. Row 2: Intermediate, 15474, 57.2, 8.41, 19.98, 11.57, 12.43, 4.19. Row 3: Late-start, 4055, 12.6, 11.50, 19.66, 8.16, 15.84, 3.24.
Values are survey-weighted participant-level means based on two reliable dietary recalls. First eating time and eating-window duration were z-standardised before K-means clustering. Night-time fasting was calculated as 24 h minus eating-window duration.
Missing covariates were multiply imputed by chained equations under a conditionally missing-at-random assumption(Reference Rubin34–Reference White, Royston and Wood36). Thirty datasets were generated with twenty iterations using predictive mean matching for continuous variables, logistic regression for binary variables and polytomous regression for unordered multi-category variables. Eating-timing variables, pattern assignment, mortality outcomes, follow-up, survey-design variables, dietary weights, age, sex, race/ethnicity, cycle and observed disease-domain indicators were not imputed. Missingness and imputation methods are reported in Supplementary Table 3. Survey-weighted Cox models were fitted separately in every completed dataset. Log-hazard-ratio coefficients and covariance matrices were then combined using Rubin’s rules with Barnard–Rubin degrees of freedom(Reference Rubin34,Reference Barnard and Rubin37) .
Early-start was the reference pattern. Model 1 included eating-timing pattern, Model 2 additionally included age, age squared, sex and race/ethnicity, and Model 3 included the complete adjustment set. Sequential estimates are in Supplementary Table 4. The primary multiplicity family comprised the six Model 3 all-cause global two-degree-of-freedom tests; their twelve pairwise contrasts formed a separate family. The three estimable cause-specific global tests and six pairwise contrasts formed corresponding secondary families. Benjamini–Hochberg false-discovery-rate correction was applied within each prespecified family, while raw P values were retained (Supplementary Table 5)(Reference Benjamini and Hochberg38).
The proportional-hazards assumption for eating pattern was assessed by jointly testing pattern-by-log(time) terms within the survey-weighted, multiply imputed framework(Reference Grambsch and Therneau39). A global interaction P < 0·05 indicated that one constant hazard ratio (HR) was insufficient. HR were estimated at the prespecified 1-, 5- and 10-year time points, with corresponding curves from 0·5 to 15 years (Supplementary Table 8 and Supplementary Figure 3). Model-warning coefficients were mapped to model-matrix terms, and diagnostic refits were used only to evaluate exposure-estimate stability (Supplementary Table 9). All tests were two-sided. Analyses used R version 4.5.1 with the survey, survival, mice, mitools, dplyr, ggplot2, officer and flextable packages(40).
Sensitivity analyses
Prespecified sensitivity analyses replaced examination-based follow-up with interview-based follow-up, removed physical activity from Model 3, used complete cases, added categorical NHANES cycle and applied 12- and 24-month landmark exclusions (Supplementary Table 6). For each landmark analysis, participants who died within the first 12 or 24 months were excluded, and follow-up for survivors was re-indexed from the corresponding landmark. An independent Day 1 analysis used the 12-year Day 1 recall weight, separately standardised and clustered Day 1 timing variables, and an independent 20-dataset imputation (Supplementary Table 7). For the cancer-mortality late-start contrast, an E-value quantified the minimum exposure–confounder and confounder–outcome associations required to explain the estimate or move the nearest confidence limit to the null (Supplementary Table 10)(41). The E-value does not address multiplicity, reverse causation, exposure measurement error or model instability.
Ethics
NHANES 2005–2010 was approved under National Center for Health Statistics Research Ethics Review Board Protocol #2005–06 and NHANES 2011–2016 under Protocol #2011–17(42). All participants provided written informed consent. This study used publicly available de-identified data and required no additional institutional review.
Results
Study population and eating-timing patterns
The primary sample included 26 712 adults and accumulated 224 837·9 person-years of examination-based follow-up, during which 3279 deaths occurred (Figure 1). The overlapping disease domains comprised 2987 participants with CVD (1172 deaths), 11 308 with hypertension (2365 deaths), 4879 with diabetes (1198 deaths), 4729 with chronic kidney disease (1602 deaths), 2633 with cancer (811 deaths) and 18 777 with hyperlipidaemia (2540 deaths).
The early-start, intermediate and late-start patterns included 7183, 15 474 and 4055 participants and represented 30·2 %, 57·2 % and 12·6 % of the weighted population, respectively (Table 2). Their weighted mean first eating times were 6·04, 8·41 and 11·50 h, and mean eating-window durations were 14·63, 11·57 and 8·16 h. Thus, progressively later first intake coincided with a shorter eating window and longer night-time fasting. In Supplementary Figure 1, the clusters remained continuum-like rather than completely separated; nevertheless, the k = 3 solution was stable across seeds and retained adequate group sizes (Supplementary Table 2 and Supplementary Figure 2).
Baseline characteristics varied across patterns (Table 1). Compared with early-start, the late-start group was younger (weighted mean 40·67 v. 49·31 years), had a lower family income:poverty ratio (2·40 v. 3·27), consumed less energy (1849·67 v. 2298·22 kcal/day) and had a lower Healthy Eating Index-2015 score (46·53 v. 51·71). The late-start group also had lower weighted physical activity and differed in smoking, alcohol use, educational attainment, marital status and disease prevalence.
Physical activity had the highest covariate missingness (26·6 %); missingness and imputation methods are summarised in Supplementary Table 3.
All-cause mortality
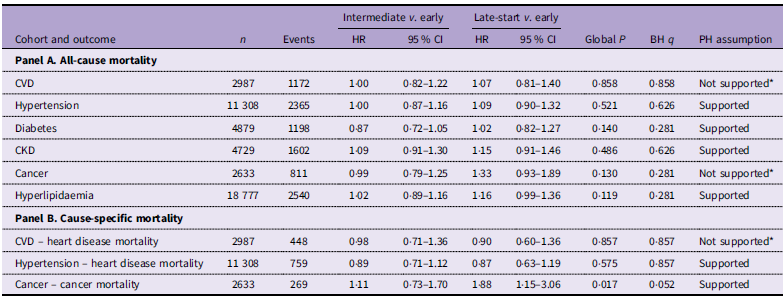
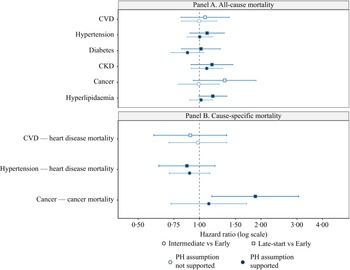
None of the six Model 3 global tests for all-cause mortality met the prespecified Benjamini–Hochberg false-discovery-rate threshold (global q values 0·281–0·858; Table 3 and Figure 2). The point estimates were generally imprecise and included the null. Representative contrasts were intermediate v. early-start in diabetes (HR 0·87, 95 % CI 0·72–1·05; global q = 0·281), late-start v. early-start in cancer (HR 1·33, 95 % CI 0·93–1·89; global q = 0·281) and late-start v. early-start in hyperlipidaemia (HR 1·16, 95 % CI 0·99–1·36; global q = 0·281). Sequential models showed that several crude associations were attenuated after demographic and full adjustment (Supplementary Table 4).
Survey-weighted associations of eating-timing patterns with mortality (hazard ratios and 95 % confidence intervals)

Table 3. Long description
A table comparing hazard ratios and confidence intervals for all-cause and cause-specific mortality across different health conditions and eating-timing patterns. The table is divided into two panels: Panel A and Panel B. Panel A focuses on all-cause mortality, while Panel B focuses on cause-specific mortality. Each panel includes columns for cohort and outcome, number of participants (n), number of events, hazard ratios (HR) with 95 percent confidence intervals (CI) for intermediate versus early-start, HR with 95 percent CI for late-start versus early-start, global P value, BH q value, and proportional hazards assumption. Panel A includes rows for cardiovascular disease (CVD), hypertension, diabetes, chronic kidney disease (CKD), cancer, and hyperlipidaemia. Panel B includes rows for CVD-heart disease mortality, hypertension-heart disease mortality, and cancer-cancer mortality. Each row provides specific values for the respective cohorts and outcomes.
BH, Benjamini–Hochberg; PH, proportional hazards; PHQ-9, 9-item Patient Health Questionnaire; NHANES, National Health and Nutrition Examination Survey; PSU, primary sampling unit; MI, multiple imputation; FDR, false discovery rate; HR, hazard ratio; CKD, chronic kidney disease.
Model 3 adjusted for age, age squared, sex, race/ethnicity, marital status, educational attainment, family income:poverty ratio, smoking, alcohol use, total physical activity, BMI, total energy intake, Healthy Eating Index-2015, sleep duration, PHQ-9 score and coexisting chronic diseases other than the disease defining the analytic domain. The full NHANES design used the 12-year 2-d dietary weight, strata and PSU; disease cohorts were analysed as survey domains. Covariates were multiply imputed in thirty datasets, and estimates were pooled using Rubin’s rules with Barnard–Rubin degrees of freedom. Early-start was the reference pattern. Global P values are MI-adjusted 2-df tests of both eating-pattern coefficients; BH q values were calculated separately for the six all-cause and three cause-specific models.
Survey-weighted associations of eating-timing patterns with mortality. Hazard ratios and 95 % CI compare intermediate and late-start patterns with the early-start reference in six chronic disease all-cause mortality domains (Panel A) and three cause-specific mortality models (Panel B). Model 3 adjusted for age, age squared, sex, race/ethnicity, marital status, educational attainment, family income:poverty ratio, smoking, alcohol use, total physical activity, BMI, total energy intake, Healthy Eating Index-2015, sleep duration, Patient Health Questionnaire-9 score and coexisting chronic diseases other than the disease defining the analytic domain. The full NHANES design used the 12-year 2-d dietary weight, strata and primary sampling units; disease cohorts were analysed as survey domains. Covariates were multiply imputed in thirty datasets, and estimates were pooled using Rubin’s rules with Barnard–Rubin degrees of freedom. The x-axis is logarithmic, and the dashed line denotes HR = 1. Circles represent intermediate v. early-start, and squares represent late-start v. early-start. Filled symbols indicate that the proportional-hazards assumption was supported; open symbols indicate that it was not supported. Constant HR in the latter models are overall summaries and are complemented by Supplementary Table 8 and Supplementary Figure 3. HR, hazard ratio; MI, multiple imputation; NHANES, National Health and Nutrition Examination Survey; PH, proportional hazards.

Cause-specific mortality
There was no clear evidence that eating-timing pattern was associated with heart disease mortality in the CVD or hypertension domains; both global q values were 0·857 (Table 3 and Figure 2). In the cancer domain, 269 cancer deaths occurred. Compared with early-start, the late-start pattern had an HR of 1·88 for cancer mortality (95 % CI 1·15–3·06; P = 0·012), whereas intermediate had an HR of 1·11 (95 % CI 0·73–1·70). The global P value was 0·017, but the global q was 0·052 and the late-start pairwise q was 0·073 (Supplementary Table 5). The cancer result therefore did not meet the prespecified false-discovery-rate threshold and was treated as a disease-context-specific suggestive association.
Sensitivity and time-varying analyses
Using interview-based follow-up, omitting physical activity, complete-case restriction and categorical-cycle adjustment did not materially alter the overall pattern of all-cause results (Supplementary Table 6). The cancer-mortality late-start estimate was 1·88 (95 % CI 1·15–3·06) with interview-based follow-up, 1·86 (1·15–3·01) without physical activity, 2·57 (1·51–4·37) in complete cases and 1·91 (1·17–3·11) after cycle adjustment. After exclusion of deaths within 12 months it was 1·74 (1·03–2·93), and after exclusion within 24 months it attenuated to 1·72 (0·93–3·18). The independent Day 1 analysis did not reproduce this association (HR 1·04, 95 % CI 0·49–2·22; global P = 0·180; Supplementary Table 7 and Supplementary Figure 4). The E-value was 3·16 for the point estimate and 1·57 for the confidence-limit estimate (Supplementary Table 10).
Proportional hazards were not supported for CVD all-cause mortality (interaction P = 0·006), cancer all-cause mortality (P = 0·024) or CVD heart disease mortality (P = 0·018). For late-start v. early-start, the corresponding HR at 1, 5 and 10 years were 1·82, 0·94 and 0·71 in the CVD all-cause model; 2·04, 1·13 and 0·88 in the cancer all-cause model; and 1·62, 0·76 and 0·55 in the CVD heart disease model. Intermediate-pattern HR at the same times were 1·25, 0·97 and 0·87; 1·01, 0·99 and 0·98; and 1·10, 0·96 and 0·91, respectively (Supplementary Table 8 and Supplementary Figure 3). These trajectories weakened or crossed the null, so the constant HR in Table 3 summarise follow-up but do not describe a uniform association over time. Diagnostic refits resolved the recorded numerical warnings with little change in the exposure estimates and were not substituted for the primary models (Supplementary Table 9).
Discussion
Principal findings
Two reliable dietary recalls identified three reproducible and readily interpretable eating-timing configurations representing 30·2 %, 57·2 % and 12·6 % of the weighted population. Across six chronic disease domains, none of the all-cause mortality global tests met the prespecified false-discovery-rate threshold; all global q values were at least 0·281. The late-start pattern showed a suggestive association with cancer mortality (HR 1·88, 95 % CI 1·15–3·06), but the global q of 0·052 and pairwise q of 0·073 did not reach the prespecified threshold, the CI crossed the null after the 24-month landmark and the association was not reproduced in the independent Day 1 analysis. In addition, CVD all-cause, cancer all-cause and CVD heart disease models showed time-varying associations, with late-start estimates weakening or crossing the null between 1 and 10 years. Collectively, the results do not support eating-timing patterns as universal mortality predictors across chronic diseases.
Interpretation across chronic disease contexts
Eating timing can integrate daily organisation, social schedules, treatment routines, sleep timing, appetite and symptom burden. Its clinical meaning is therefore likely to depend on why a person eats at a particular time, not only on the clock time itself. In diabetes, meal timing may be shaped by glucose monitoring and medication-food coordination(Reference Evert, Dennison and Gardner15). In chronic kidney disease, dietary restrictions and treatment schedules can reorganise intake(Reference Ikizler, Burrowes and Byham-Gray16). In CVD, hypertension and hyperlipidaemia, work, sleep, co-morbidity and household routines may be prominent determinants(Reference St-Onge, Ard and Baskin1,Reference Kecklund and Axelsson10) . These mechanisms offer a coherent explanation for the absence of one common direction across the six domains. They also distinguish free-living observational timing patterns from monitored time-restricted-eating interventions, which have different exposure definitions and clinical contexts(Reference Sutton, Beyl and Early43–Reference de Cabo and Mattson45).
The cancer-mortality signal requires particular restraint. Cancer and its treatment can alter appetite, taste, gastrointestinal tolerance, fatigue and body weight, while cachexia can reduce meal size and disrupt intake(Reference Fearon, Strasser and Anker17,Reference Muscaritoli, Arends and Bachmann18) . A late-start, shorter-window configuration may consequently identify participants with greater symptom or treatment burden. The attenuation after early-death exclusion is compatible with illness-related changes in eating timing, although it does not establish reverse causation. The E-value indicates the minimum strength of residual confounding, on the risk-ratio scale, needed to explain the point estimate or shift the nearest confidence limit to the null; it does not test whether such confounding exists(41). More importantly, the FDR threshold was not met and the Day 1 result was null and imprecise. These findings do not justify advising people with cancer simply to begin eating earlier or extend their eating window. Instead, an observed late and short pattern may prompt assessment of appetite, nausea, fatigue, unintentional weight loss, depressive symptoms, treatment adverse effects and access to nutritionally adequate meals(Reference Muscaritoli, Arends and Bachmann18).
Methodological implications for chrononutrition research
The contrast between the 2-d and Day 1 solutions illustrates the influence of within-person day-to-day variation. In the 2-d analysis, the early-start group began at 6·04 h and represented 30·2 % of the weighted population; in the independent Day 1 analysis, it began at 3·25 h and represented only 9·3 %. The more extreme Day 1 centre and different group shares indicate that a single recall can produce materially different participant classifications. Repeated assessments are therefore important when timing configurations are intended to represent habitual behaviour(Reference Dodd, Guenther and Freedman19). The 2-d average remains a limited snapshot, but it reduces reliance on one potentially atypical day and aligns the exposure with the 2-d dietary weight(20).
Several analytic choices also changed the evidential interpretation. Incorporating strata and primary sampling units produced uncertainty appropriate to the NHANES design(20,Reference Lumley32) . Multiple imputation retained participants with incomplete covariates, while complete-case and no-physical-activity analyses showed how missingness assumptions influenced precision(Reference Rubin34–Reference White, Royston and Wood36). Global tests and prespecified false-discovery-rate families prevented an isolated pairwise P value from becoming the article’s main conclusion(Reference Benjamini and Hochberg38). Finally, the pattern-by-log(time) assessment identified three settings in which a single constant HR concealed attenuation or crossing over follow-up(Reference Grambsch and Therneau39). Chrononutrition mortality studies should therefore report design-based variance, joint exposure tests, multiplicity handling and time-varying estimates when proportional hazards are not supported, rather than treating a single adjusted HR as sufficient.
K-means provided a transparent classification using two continuous timing characteristics and yielded identical membership across repeated seeds(Reference Hartigan and Wong13,Reference Rousseeuw14) . Its moderate separation nevertheless indicates that these groups summarise a continuum of free-living schedules rather than discrete biological phenotypes. The labels are descriptive, and their centres can shift when the recall basis changes. Latent profile methods could characterise distributional uncertainty, while factor analysis instead represents covariance through latent dimensions; such methods answer related but not identical questions(Reference Leech, Worsley and Timperio11,Reference Fabrigar, Wegener and MacCallum12) . The present findings support clear reporting of the clustering estimand, candidate-solution diagnostics, group sizes, centre stability and recall-day dependence.
Strengths, limitations and nutritional relevance
Strengths include a large national sample, two reliable recalls for the primary exposure, National Death Index linkage, explicit NHANES design-based analyses, observed disease-domain definitions, 30-dataset multiple imputation, prespecified global and FDR tests, independent Day 1 clustering, landmark exclusions and time-specific follow-up of proportional-hazards failures. These features allowed the study to distinguish absence of a consistent association from imprecision, multiple-testing artefacts and non-constant hazards.
Several limitations constrain inference, and each has a corresponding mitigation. First, two recalls cannot represent long-term eating habits and may misclassify participants. Requiring 2 d and comparing an independently derived Day 1 solution reduced reliance on one recall but could not measure long-term stability; non-differential misclassification would generally be expected to weaken associations, whereas illness-related recording could introduce less predictable bias. Second, established disease can alter eating behaviour. The 12- and 24-month landmarks reduced the contribution of deaths soon after baseline, and attenuation of the cancer estimate after 24 months increased uncertainty about temporality. Third, physical activity had substantial missingness. Multiple imputation was the primary approach, with a model excluding physical activity and complete-case analysis as sensitivity checks; validity still depends on the conditional missing-at-random assumption and adequate imputation-model specification.
Fourth, cancer stage, recurrence, treatment, medication timing, shift work, chronotype, food insecurity, weight change and detailed symptom measures were unavailable. Broad adjustment and the E-value quantified some implications of residual confounding but cannot remove it or determine its direction. Fifth, testing multiple domains and contrasts increases false-positive risk; prespecified global tests and separate FDR families materially reduced this risk, and the cancer result was labelled suggestive because q values remained above 0·05. Sixth, the proportional-hazards assumption was not supported in three models; reporting all prespecified 1-, 5- and 10-year estimates showed that constant HR could obscure attenuation or crossing. Seventh, K-means imposed mutually exclusive groups on moderately separated data; candidate-k diagnostics, minimum group size and ten-seed stability supported reproducibility without implying discrete biology. Finally, NHANES represents non-institutionalised US adults, and disease domains overlap, limiting generalisation to institutionalised populations, other countries or mutually exclusive diagnoses.
The clinical implication is assessment rather than prescription. Eating timing should not be used as a universal mortality-screening measure across chronic diseases, and an observational late or short eating window is not an indication for time-restricted-eating treatment. Repeated timing assessment combined with disease-specific clinical information may nevertheless identify disrupted daily intake that warrants nutritional evaluation. In personalised nutritional care, a late or short eating window should prompt assessment of whether the pattern reflects preference and routine or appetite loss, treatment toxicity, fatigue, sleep disruption, socio-economic constraint or progressive disease.
Conclusion
In a nationally representative cohort with 2-d dietary assessment, three reproducible eating-timing patterns were identified, but they were not uniformly associated with mortality across chronic disease populations after survey-design and multiplicity adjustment. A late-start, shorter-window pattern showed a suggestive association with cancer mortality; this finding did not meet the prespecified FDR threshold, attenuated after exclusion of early deaths and was not reproduced in the independent Day 1 analysis. Several all-cause associations also varied over follow-up. Eating timing may therefore represent a context-dependent marker of daily organisation and disease burden rather than a universal prognostic or therapeutic target. Repeated timing measurements and disease-specific clinical characterisation are needed before translating these observational patterns into nutritional recommendations.
Supplementary material
For supplementary material/s referred to in this article, please visit https://doi.org/10.1017/S0007114526108332
Data availability statement
The NHANES 2005–2016 demographic, examination, questionnaire and dietary datasets used in this study are publicly available from the National Center for Health Statistics NHANES website. Mortality outcomes are available in the Continuous NHANES Public-use Linked Mortality Files, 2019 (doi: 10.15620/cdc:117142). No special permission is required to access these public-use data. The analysis code and derived, non-identifiable output files are available from the corresponding author upon reasonable request.
Acknowledgements
The authors thank the National Center for Health Statistics and the NHANES participants and staff for making these public-use data available.
RH: writing – original draft, methodology, investigation and formal analysis. MH: writing, investigation and formal analysis. RZ: writing – review and editing, supervision, resources and conceptualisation.
This research received no specific grant from any funding agency, commercial or not-for-profit sectors.
The authors declare no conflicts of interest.