Introduction
Bipolar disorder leads to extreme and erratic shifts of mood, thinking, and behavior and has a lifetime prevalence of 1–4.5% (Merikangas et al. Reference Merikangas, Akiskal, Angst, Greenberg, Hirschfeld, Petukhova and Kessler2007). This prevalent, complex, and clinically challenging disorder is associated with increased risks of dying not only by suicide, which is roughly 20 times more common in this population, but also from prevalent medical disorders with a consequent shortening in life expectancy of 10–13.6 years relative to the general population of same age (Ösby et al. Reference Ösby, Brandt, Correia, Ekbom and Sparén2001; Tondo et al. Reference Tondo, Lepri and Baldessarini2007; Chang et al. Reference Chang, Hayes, Perera, Broadbent, Fernandes, Lee, Hotopf and Stewart2011; Laursen, Reference Laursen2011; Leboyer et al. Reference Leboyer, Soreca, Scott, Frye, Henry, Tamouza and Kupfer2012; Cipriani et al. Reference Cipriani, Hawton, Stockton and Geddes2013). Excited or manic states are characterized by extremes of energy and activity, as well as risk-taking, impulsive actions, substance abuse, and rapid or irrational thinking, sometimes with psychotic delusions (Goodwin & Jamison, Reference Goodwin and Jamison2007). Poor judgment and risk-taking often lead to devastating economic, occupational, and interpersonal problems. At the stage of treatment engagement, the manic syndrome is generally already escalated and the expectation is prompt alleviation, which can only be managed by selecting an antimanic treatment with high potency. Since bipolar disorder is a recurrent and life-long illness, the treatment of acute manic or mixed episodes also provides a ‘portal of entry’ to establish a foundation of treatment aimed at subsequent maintenance and relapse prevention. Accordingly, besides efficacy, acceptability of selected treatment is critical, not only for prompt alleviation of manic syndrome but also for the long-term prophylaxis against emerging episodes, disability, and premature death by associated medical causes as well as suicide (Ahrens et al. Reference Ahrens, Müller-Oerlinghausen, Schou, Wolf, Alda, Grof, Grof, Lenz, Simhandl, Thau, Volk, Wolf and Wolf1995; Leboyer et al. Reference Leboyer, Soreca, Scott, Frye, Henry, Tamouza and Kupfer2012; Cipriani et al. Reference Cipriani, Hawton, Stockton and Geddes2013). Available antimanic treatments include lithium, valproate and carbamazepine, which have been considered ‘mood stabilizers’ (MSs); and several ‘atypical’ or ‘second-generation’ antipsychotic drugs (SGAs) (Yildiz et al. Reference Yildiz, Vieta, Leucht and Baldessarini2011a ; Baldessarini, Reference Baldessarini2013).
Evidence-based comparisons among these and other treatments are not readily accessible, since most of the accumulated randomized controlled trial (RCT) evidence is against placebo (Yildiz et al. Reference Yildiz, Vieta, Leucht and Baldessarini2011a ). In situations where an active comparator is used, the sample size is often not calculated for a test of superiority or non-inferiority between the two active treatments, but rather for superiority of an experimental treatment to placebo, with the active comparator serving as ‘assay sensitivity’ for the trial's integrity (Vieta & Cruz, Reference Vieta and Cruz2012). Standard pair-wise meta-analyses (SPM) can overcome the problem associated with power for such active treatment comparisons. However, since SPM cannot integrate all evidence from several comparators and many available drugs have not been compared head-to-head, a hierarchy on comparative efficacy cannot be obtained. A meta-analytic technique known as network analysis or multiple-treatments meta-analysis (MTM), enables indirect comparisons among competing interventions by combining findings from separate trials involving a common comparator (Salanti et al. Reference Salanti, Higgins, Ades and Ioannidis2008). Though relying on strong assumptions, MTM allows integration of all available evidence, maximizes power, increases precision, and enables evidence-based hierarchies of comparative efficacy, acceptability and safety of competing interventions (Caldwell et al. Reference Caldwell, Ades and Higgins2005; Glenny et al. Reference Glenny, Altman, Song, Sakarovitch, Deeks, D'Amico, Bradburn and Eastwood2005; Salanti et al. Reference Salanti, Marinho and Higgins2009).
In an attempt to update and recapture hierarchies on efficacy and acceptability of antimanic treatments, we constructed a comprehensive network involving all candidate antimanic treatments, and performed MTM on continuous and categorical measures of efficacy as well as risk of all-cause discontinuations.
Methods
Search strategy and selection criteria
We searched the PubMed/Medline; EMBASE; PsycINFO; ClinicalTrials.gov; Cochrane Central Register of Controlled Trials; and Controlled-trials.com databases to identify RCTs of orally administered, putative antimanic drugs for adults with acute bipolar-I mania available up to 15 January 2014. Search-terms were: ‘bipolar AND mania’, and names of individual antipsychotics, anticonvulsants, lithium, or other drugs. Search results were supplemented by reports identified through previous reviews, conference proceedings, and by data requested from pharmaceutical companies and authors. A flow diagram is provided in Appendix 1 (the Appendices are available as supplementary online material).
We included published and unpublished RCTs that compared a test-agent with placebo or an active comparator as monotherapy, with blinded outcome assessment. The requirement for blindness led to exclusion of three randomized but open, head-to-head trials of lithium v. valproate (Bowden et al. Reference Bowden, Göğüş, Grunze, Häggström, Rybakowski and Vieta2008, Reference Bowden, Mosolov, Hranov, Chen, Habil, Kongsakon, Manfredi and Lin2010; Mosolov et al. Reference Mosolov, Kostiukova, Kapiletti, Belen'kaia, Shafarenko and Fedotov2009). We further excluded trials involving participants with hypomania or mild mania, or with type II or unspecified (NOS) bipolar, or schizoaffective disorders (McElroy et al. Reference McElroy, Martens, Creech, Welge, Jefferson, Guerdjikova and Keck2010a , Reference McElroy, Martens, Winstanley, Creech, Malhotra and Keck b ). We also excluded trials involving add-on or combination treatments and those permitting adjunctive use of psychotropic agents other than hypnotic sedatives for sleep or antiparkinsonism drugs for extrapyramidal side effects. Through that requirement, besides numerous trials with a combination or add-on design, four apparently single-agent trials permitting use haloperidol or chlorpromazine, as needed were excluded (Brown et al. Reference Brown, Silverstone and Cookson1989; Garza-Treviño et al. Reference Garza-Treviño, Overall and Hollister1992; Ortega Soto, Reference Ortega Soto1993; Shafti & Shahveisi, Reference Shafti and Shahveisi2008). Since similarity of trial circumstances and patient characteristics is fundamental for MTM, we only included trials which evaluated manic symptom improvement via a scale specifically developed for mania, providing quantifiable data. This requirement led to exclusion of one head-to-head trial of lithium v. carbamazepine (Lerer et al. Reference Lerer, Moore, Meyendorff, Cho and Gershon1987); and another on ziprasidone v. olanzapine, terminated early without efficacy analysis (Pfizer, 2008). We further excluded trials comparing different dosing schedules or immediate- v. slow-release formulations of the same drug, or trials without a control group.
As we aimed to evaluate antimanic drugs' efficacy for acute treatment, we targeted outcome assessments at 3 or 4 weeks. If 3 or 4 weeks’ data were not available, we used data at the points closest to 3 weeks over 1–8 weeks.
We considered 18 orally administered antimanic drugs used as monotherapies, including all flexible-dose studies since in these studies dose of test drug(s) was titrated up to adequate dose according to individual patients’ needs. For fixed-dose studies, we included target doses up to maximum doses as indicated in the international consensus study of antipsychotic dosing (Gardner et al. Reference Gardner, Murphy, O'Donnell, Centorrino and Baldessarini2010). Bearing in mind FDA recommendations on placebo equivalence or non-equivalence we did not set a minimum dose for any drug tested against placebo. Comparability of doses in studies involving two active agents was evaluated on the basis of international agreements on antipsychotic and mood stabilizer dosing (Gardner et al. Reference Gardner, Murphy, O'Donnell, Centorrino and Baldessarini2010; Baldessarini, Reference Baldessarini2013). In situations where an unfairly low dosing strategy may potentially affect ranking by efficacy among proven antimanic treatments these comparisons were to be excluded from the MTM. However, no study was excluded for this reason since a few identified low dosing schedules involved both of the compared drugs or a drug with previously proven inefficacy (Goldsmith et al. Reference Goldsmith, Wagstaff, Ibbotson and Perry2003; Yildiz et al. Reference Yildiz, Vieta, Leucht and Baldessarini2011a ).
Outcome measures and data extraction
The primary outcome was improvement in manic symptoms, which was assessed by the Young Mania Rating Scale (YMRS; 11 items, scoring range: 0–60) or the Mania Rating Scale developed from the Schedule for Affective Disorders and Schizophrenia, Change Version (MRS; 11 items, range: 0–53), as change in total score from baseline to endpoint (Endicott & Spitzer, Reference Endicott and Spitzer1978; Young et al. Reference Young, Biggs, Ziegler and Meyer1978). If data from these scales were not available, we used change in total score by another scale developed for mania, and then ratings with these scales at study endpoint. In the present network, in only one study the Beigel–Murphy Manic State Rating Scale (MSRS; Beigel & Murphy, Reference Beigel and Murphy1971) was used; data was presented as endpoint scores (Shafti, Reference Shafti2010). Except for this and one additional study providing endpoint scores with the MRS (Freeman et al. Reference Freeman, Clothier, Pazzaglia, Lesem and Swann1992), all included RCTs provided data on the primary outcome as the mean change in YMRS or MRS total scores.
Intention-to-treat (ITT) datasets were used whenever available. Secondary outcomes were the rate of attaining response (usually defined as ⩾50% reduction of initial mania scores), and all-cause discontinuation rates. For all but two comparisons, standard deviation (s.d.) for change in scores was available. In these two occasions, missing s.d.s were estimated through the mean s.d. of the other included studies.
Meta-analytic calculations
MTM or network analysis integrates evidence by using both direct comparisons available in the conducted RCTs, and also indirect comparisons hypothetically made between competing interventions by using a third, common, comparator (Salanti et al. Reference Salanti, Higgins, Ades and Ioannidis2008; Kriston & Yildiz, in press). Since the main principle enabling indirect comparisons is transitivity, or the assumption that trials are virtually exchangeable in subject samples, design, conduct, and outcome measures, we first aimed for utmost similarity of the trials to be included in the network (Lu & Ades, Reference Lu and Ades2004; Glenny et al. Reference Glenny, Altman, Song, Sakarovitch, Deeks, D'Amico, Bradburn and Eastwood2005).
For MTM, we applied random-effects modeling for multi-arm studies with a Bayesian approach, using WinBUGS 1.4.3 software (Biostatistics Unit, Cambridge University, UK) based on Markov-chain Monte Carlo methods (Lu & Ades, Reference Lu and Ades2004; Caldwell et al. Reference Caldwell, Ades and Higgins2005; Ades et al. Reference Ades, Sculpher, Sutton, Abrams, Cooper, Welton and Lu2006). WinBUGS codes are provided in Appendix 2. Bayesian hierarchical modeling enables utilization of all available information provided in the entire data network for computing each parameter without any duplication (Ades et al. Reference Ades, Sculpher, Sutton, Abrams, Cooper, Welton and Lu2006). Thus, for evidence structures comparing multiple treatments, including three-arm studies, a Bayesian approach is particularly suitable for estimating effect-size parameters. Our primary outcome was the standardized mean difference (SMD) as Hedges’ adjusted-g between competing interventions. For the computations of SMD we used a modified version of the mixed treatment comparisons model originally defined for dichotomous data by Ades et al. (Reference Ades, Welton and Lu2014; https://www.bris.ac.uk/cobm/research/mpes/mtc.html). We established the prior distribution for random-effects s.d., using a formula to convert log-odds ratio (OR), for response with drug v. placebo or active comparator, to SMD (Chinn, Reference Chinn2000). For categorical measures of response, we used OR instead of relative risk (RR), which in the case of MTM could lead to reversal of treatment effects (Eckermann et al. Reference Eckermann, Coory and Willan2009). For this aim, we used a mixed treatment comparisons model for dichotomous data by Ades et al. (Reference Ades, Welton and Lu2014). Both types of effect sizes are reported with their 95% credible intervals (CrI). To rank the treatments we used the surface under the cumulative ranking (SUCRA) probabilities (Salanti et al. Reference Salanti, Ades and Ioannidis2011). Ranking probabilities provide simple and appealing statements, such as ‘treatment A has 30% chance to be the best’ (Salanti et al. Reference Salanti, Ades and Ioannidis2011). However, since SUCRA probabilities can be sensitive to small changes in the posterior distribution of effect sizes (either the mean or the variance), and high probabilities in low ranks do not necessarily indicate the most effective treatments (Salanti et al. Reference Salanti, Ades and Ioannidis2011), we provided effect sizes of pairwise comparisons, along with measures on probabilities.
We also calculated absolute differences in responder rates (RD), with associated number-needed-to-treat (NNT), the estimated number of patients to be treated for one additional patient to benefit from a particular drug v. placebo or an active comparator (Altman, Reference Altman1998). For the computations of RD and NNT within the context of MTM we employed an approach described by Woo et al. (Reference Woo, Tomlinson, Nishikawa, Kowgier, Sherman, Wong, Pham, Ungar, Einarson, Heathcote and Krahn2010), and selected the most extensively tested antimanic agent: lithium, as a standard for an auxiliary estimate of average responder rate. Of note, choice of reference treatment, unless it is an outlier, has no influence on the computed values of RD and NNT. To avoid misinterpretation, NNT values are reported only if significant with the entire 95% CrI being above or below zero.
The underlying assumption of transitivity suggests that there is no imbalance in distribution of potential effect modifiers across the pairwise comparisons in the network (Yildiz et al. Reference Yildiz, Vieta, Correll, Nikodem and Baldessarini2014b ). If the transitivity assumption held, there would not be major disagreements or inconsistency between direct and indirect evidence. We assessed network consistency by testing agreement between direct and indirect evidence for each pair of drugs with both direct and indirect evidence (Dias et al. Reference Dias, Welton, Caldwell and Ades2010). If direct evidence as denoted by μ exist for comparisons between drug A v. drug B, drug B v. drug C, and drug C v. drug A, a consistency parameter ConsABC of the loop A,B,C is defined as follows:
 $$\eqalign{& {\rm Cons}_{{\rm ABC}} = \mu _{{\rm AB}} + \mu _{{\rm BC}} + \mu _{{\rm CA}} \cr & {\rm Var(Cons}_{{\rm ABC}} ) = {\rm Var(}\mu _{{\rm AB}} ) + {\rm Var}(\mu _{{\rm BC}} ) + {\rm Var}(\mu _{{\rm CA}} ).} $$
If the computed 95% CrI of ConsABC does not include zero, an inconsistency on the loop A,B,C is significant. This approach can be extended to loops consisting of more than three drugs. However, in the dense network structures as considered here, with employment of longer loops, it is unlikely to detect any additional signs of inconsistency. As such, we examined three-treatment loops. For further assessment of network consistency, we carried out an auxiliary, pairwise meta-analysis using the same random-effects Bayesian approach with their 95% CrI for estimates as in the overall MTM, but without transitivity of effect allowed (i.e. no influence of indirect evidence on results of direct comparisons), to permit a sensitive comparison with the MTM results (Spiegelhalter et al. Reference Spiegelhalter, Best, Carlin and van der Linde2002; Lu & Ades, Reference Lu and Ades2004; Ades et al. Reference Ades, Sculpher, Sutton, Abrams, Cooper, Welton and Lu2006). For further assessment of network consistency, parameters of Deviance Information Criterion (DIC) and residual deviance (D res) were computed in order to measure model fit (Dias et al. Reference Dias, Welton, Caldwell and Ades2010; Jonas et al. Reference Jonas, Wilkins, Bangdiwala, Bann, Morgan, Thaler, Amick and Gartlehner2013).
As employed in the MTM of antipsychotics in patients with schizophrenia (Leucht et al. Reference Leucht, Cipriani, Spineli, Mavridis, Orey, Richter, Samara, Barbui, Engel, Geddes, Kissling, Stapf, Lässig, Salanti and Davis2013), we performed several post-hoc sensitivity analyses on the primary outcome. These were conducted by (1) excluding studies with unusually high or low treatment effects; (2) excluding haloperidol to rule out differences in its dosing as a potential source of bias; (3) excluding placebo to examine if hypothetical increases in placebo-associated responses over trial years might have reduced the apparent efficacy of newer drugs; and (4) excluding candidate drugs which are not considered as first-generation antipsychotic (FGA) or SGA or MS to test validity of class effect via a group-based comparison. Since all included studies but one (Kakkar et al. Reference Kakkar, Rehan, Unni, Gupta, Chopra and Kataria2009) employed an ITT-based last observation carried forward (LOCF) approach, we did not require sensitivity analysis by exclusion of studies not analyzed on an ITT basis. Likewise, since all studies but one (Shafti, Reference Shafti2010), used a similar rating methods for the primary outcome assessment, we did not require sensitivity analysis for the rating scale used. Unfair dose comparisons, dissimilar diagnostic criteria or trial durations, incomparable methods for concealing treatment allocations or to provide blinding were additional potential effect modifiers considered. However, the network was quite homogeneous, with a trial duration of 3 or 4 weeks in 94%, and employment of recent DSM diagnostic criteria in 98% of trials; unreported allocation concealment or unfair dose comparisons being identified in only 9% and 4% of the included RCTs, respectively (Spitzer et al. Reference Spitzer, Endicott and Robins1978; APA, 2000; Li et al. Reference Li, Ma, Wang, Zhu, Peng and Gu2008).
We planned several multiple-treatment meta-regressions (MTR) a priori on the primary outcome for: (1) presence of psychotic features, (2) presence of mixed-state diagnosis, (3) all-cause discontinuation rates, (4) publication year, and (5) funding source. For the meta-regression analysis we employed the random-effects model as described in Jonas et al. (Reference Jonas, Wilkins, Bangdiwala, Bann, Morgan, Thaler, Amick and Gartlehner2013), using WinBUGS 1.4.3 software (Appendix 2). The continuous covariates were centered at their mean values to improve model convergence. Finally, we explored presence of publication bias or small study effects with a funnel plot technique expanded to MTM (Moreno et al. Reference Moreno, Sutton, Ades, Stanley, Abrams, Peters and Cooper2009; Chaimani & Salanti, Reference Chaimani and Salanti2012). Statistical significance required two-tailed p < 0.05.
Results
This updated network by differential exclusion of all add-on or combination trials (N = 15 RCTs, 32 study arms, 13 treatments), and also four apparently single-agent trials (N = 4, eight study arms, Lerer et al. Reference Lerer, Moore, Meyendorff, Cho and Gershon1987; Brown et al. Reference Brown, Silverstone and Cookson1989; Ortega Soto, Reference Ortega Soto1993; Pfizer, 2008); along with further consideration of three recent cariprazine (Knesevich et al. Reference Knesevich, Papadakis, Bose, Andor and Laszlovszky2009; Bose et al. Reference Bose, Starace, Wang, Diaz, Goodman, Ruth, Németh and Laszlovszky2012; Calabrese et al. Reference Calabrese, Keck, Starace, Lu, Ruth, Laszlovszky, Nemeth and Durgam2013), one licarbazepine (Novartis, 2007), two tamoxifen (Zarate et al. Reference Zarate, Singh, Carlson, Quiroz, Jolkovsky, Luckenbaugh and Manji2007; Yildiz et al. Reference Yildiz, Guleryuz, Ankerst, Ongür and Renshaw2008), and one verapamil (Janicak et al. Reference Janicak, Sharma, Pandey and Davis1998) trials (N = 7 RCTs, 13 study arms, four new treatments), is different than the previous one in 53 data points deriving from 29 comparisons (Cipriani et al. Reference Cipriani, Barbui, Salanti, Rendell, Brown, Stockton, Purgato, Spineli, Goodwin and Geddes2011).
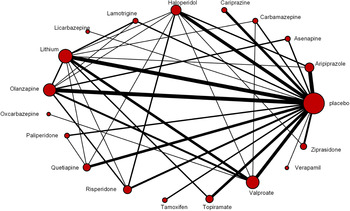
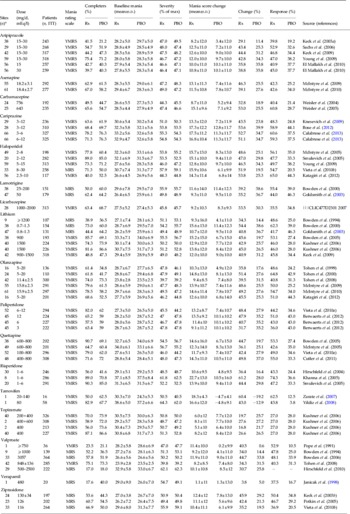
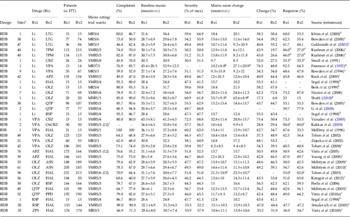
The present total of 57 studies, reported up to 15 January 2014, involved 95 direct comparisons with 14256 randomized participants (Fig. 1). Study and patient characteristics of the included RCTs are reported in Tables 1 and 2. Bipolar I manic or mixed state was diagnosed with DSM-IV or DSM-IV-TR in 91%, DSM-III-R in 6%, Research Diagnostic Criteria (RDC) in 2%, and a Chinese version of DSM-IV (excluding patients with hypomania or first mania) in 1% of the comparisons (Spitzer et al. Reference Spitzer, Endicott and Robins1978; APA, 2000; Li et al. Reference Li, Ma, Wang, Zhu, Peng and Gu2008). Except for one head-to-head comparison of lithium v. olanzapine (Shafti, Reference Shafti2010), all studies used YMRS or MRS for dimensional measurement of manic syndrome severity. One study was single-blinded with allocation concealed from the assessors; the rest (99%) were double-blinded. For all placebo-controlled studies, and all but seven head-to-head studies some explanatory information on the method of allocation concealment was provided. While 64% of the comparisons in the network were against placebo, in 87%, a pharmaceutical company provided funding. In all but four included RCTs, study duration for the primary endpoint was 3 or 4 weeks. Mean (± s.d.) age of trial participants was 38.9 ± 12.3 years. The proportion of male patients was similar in placebo controlled (53%) and head-to-head (48%) trials. Trial completion rates per study arm could be obtained for all comparisons but one (Kakkar et al. Reference Kakkar, Rehan, Unni, Gupta, Chopra and Kataria2009); and averaged 64% in drug v. placebo, and 72% in head-to-head comparisons. With reported and tabulated study and patient characteristics this reasonably homogenous network consisted of 19 joints of candidate antimanic treatments or placebo, as monotherapy in an ITT based analytic sample of 13920 manic patients with 128 data points (number of study arms) (Tables 1 and 2; Fig. 1).
Network of antimanic treatment comparisons. The size of the nodes corresponds to the number of trials involving that treatment. Directly comparable treatments are linked with a line, the thickness of which corresponds to the number of trials assessing that comparison.

Characteristics of included randomized, placebo-controlled single-agent trials of acute mania (61 comparisons from 41 studies

s.d., Standard deviation; Rx, treated with study drug; PBO, placebo. Test drugs are listed alphabetically.
Ratings and changes are based on mania ratings by: YMRS (Young Mania Rating Scale: 11 items, range 0–60) or MRS (Mania Rating Scale: 11 items, range 0–53) from the Schedule for Affective Disorders and Schizophrenia–Change Version. Response is defined as ⩾50% improvement in the mania rating scale used relative to baseline.
References for included studies are provided in Appendix 4.
a In studies where actual site numbers are not reported, they are estimated as twice the reported number of countries.
Characteristics of randomized, single-agent trials comparing two active drugs for treatment of acute mania (34 comparisons; 16 from three-armed placebo controlled trials)

Studies listed as based on comparisons.
s.d., Standard deviation; Rx, treated with study drug. RDB, Randomized double blind. RO, Randomized open. Drugs: APZ, aripiprazole; ASN, asenapine; CBZ, carbamazepine; HAL, haloperidol; Li, lithium; OLZ, olanzapine; OxCBZ, oxcarbazepine; PPD, paliperidone; QTP, quetiapine; RSP, risperidone; TPM, topiramate; VPA, valproate; ZPS, ziprasidone.
Ratings and changes are based on mania ratings by: YMRS (Young Mania Rating Scale: 11 items, range 0–60) or MRS (Mania Rating Scale: 11 items, range 0–53) from the Schedule for Affective Disorders and Schizophrenia–Change Version or MSRS (Beigel-Murphy Manic State Rating Scale: 26 items, range 0–130).
Unless otherwise specified response is defined as ⩾50% improvement in the mania rating scale scores administered as relative to baseline.
References for included studies are provided in Appendix 4.
a In studies where actual site numbers are not reported, they are estimated as twice the reported number of countries.
b Lithium arm from the same study with two active controls published separately.
c Indicates results from placebo-controlled studies with two active treatment arms.
d Indicates pooled results.
e Response is defined as moderate improvement with CGI (Clinical Global Impressions Scale).
f Freeman et al. (Reference Freeman, Clothier, Pazzaglia, Lesem and Swann1992) used a software system that unit normalized the MRS scores.
g Actual score at the end point; please note that smaller score at the end point reflects larger improvement.
h Same study tabulated three times as it has three comparisons between three active drugs.
i Mania score change results are at 3 weeks; and response indicates rate of remission (defined as YMRS of ⩽12) at 12 weeks.
j Mania score change is defined as least squares mean and response is defined as ⩾70% improvement with the YMRS at 6 weeks end point.
Assessment of antimanic drugs efficacy
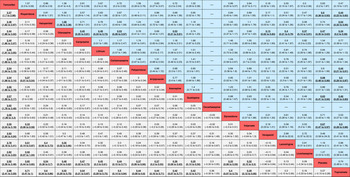
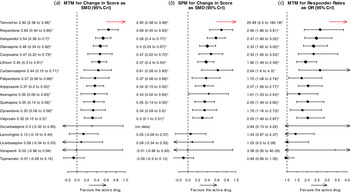
MTM indicated superior improvement in manic symptom ratings (based on SMD and CrI) over placebo for 13 drugs: aripiprazole (0.37, 0.2–0.55), asenapine (0.36, 0.08–0.63), carbamazepine (0.44, 0.15–0.71), cariprazine (0.47, 0.22–0.73), haloperidol (0.54, 0.38–0.7), lithium (0.45, 0.3–0.61), olanzapine (0.48, 0.34–0.62), paliperdone (0.37, 0.08–0.66), quetiapine (0.35, 0.14–0.56), risperidone (0.65, 044–0.85), tamoxifen (2.92, 2.38–3.48), valproate (0.32, 0.15–0.5), and ziprasidone (0.33, 0.08–0.59); and lack of efficacy for 5 others: oxcarbazepine (0.3, −0.35 to 0.95) lamotrigine (0.13, −0.16 to 0.44), licarbazepine (0.09, −0.34 to 0.53), topiramate (0.07, −0.15 to 0.28), and verapamil (−0.02, −0.96 to 0.94) (Figs 2 and 3). We created hierarchies of effect sizes on the basis of SUCRA rankings for all outcomes, and also provided point estimates as SMD or OR with their CrI. Among clinically used antimanic treatments, improvements in manic symptom ratings were comparable for all drugs except risperidone v. aripiprazole (0.27, 0.01–0.54) and v. valproate (0.33, 0.06–0.58), both significantly favoring risperidone.
Efficacy and all-cause discontinuation of antimanic drugs. Drugs are reported in the order of SUCRA–based efficacy ranking. Comparisons between treatments should be read from left to right and the estimate is in the cell in common between the column-defining treatment and the row-defining treatment. For efficacy, standard mean differences (SMDs) with 95% credible intervals (CrI) higher than 0 favor the column-defining treatment. For all-cause discontinuation, odds ratios (ORs) with CrI lower than 1 favor the raw-defining treatment and ORs with CrI higher than 1 favor the column-defining treatment. To obtain SMDs for comparisons in the opposite direction, negative values should be converted into positive values, and vice versa. To obtain ORs for comparisons in the opposite direction, reciprocals should be taken. Significant results are in bold and underlined.

Forest plots for efficacy of antimanic drugs compared with placebo. Treatments are ranked by the point estimates on the primary outcome. (a) Standardized mean differences [SMD, with 95% CrI (horizontal bars)] in reduction of mania symptom ratings between 18 candidate antimanic agents v. placebo, based on the multiple treatment meta-analysis (MTM); (b) the same measures analyzed by the standard pair-wise meta-analysis (SPM) with a Bayesian approach; (c) differences in drug–placebo response rates for the same antimanic agents as odds ratio (OR) with 95% CrI (horizontal bars), based on MTM. Vertical lines at SMD = 0.0 and OR = 1.0 indicates no drug v. placebo difference. (*) Indicates significantly superior effect compared to placebo.

MTM based on the categorical responder rates (OR) validated effectiveness of the same 13 agents and lack of effect in the five others (Fig. 3). However, when effect size estimates for the categorical responder rates and their corresponding NNT values were considered, no significant differences between any of the clinically available effective drugs could be detected. Hierarchies by SUCRA rankings as well as OR-based point estimates between competing interventions and their corresponding NNT values are available in Fig. 1 of Appendix 3.
Assessment of all-cause discontinuations
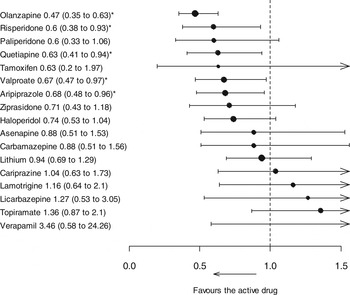
All-cause discontinuation (dropout) was used as a measure of acceptability and Fig. 2 (upper triangle) provides ORs with their CrI based on this measure. Aripiprazole (0.68, 0.48–0.96), olanzapine (0.47, 0.35–0.63), quetiapine (0.63, 0.41–0.94), risperidone (0.60, 0.38–0.93), and valproate (0.67, 0.47–0.97) indicated significantly less all-cause, short-term discontinuation rates compared to placebo. Among drugs in clinical use, olanzapine was associated with significantly lower short-term discontinuation rates than haloperidol (0.63, 0.42–0.94), asenapine (0.53, 0.31–0.91), carbamazepine (0.53, 0.28–0.97), lithium (0.49, 0.33–0.73), and cariprazine (0.45, 0.25–0.81). Other drugs did not differ by acceptability. Fig. 4 presents a forest plot for all drugs listed from the most to least acceptable as compared to placebo according to their OR-based point estimates.
Forest plot for all-cause discontinuation rates of antimanic drugs compared with placebo. Treatments are ranked by the point estimates as odds ratio (OR) with 95% credible interval (horizontal bars), based on MTM. Vertical line at OR = 1.0 indicates no drug v. placebo difference. (*) Indicates significantly less all-cause discontinuation rates compared to placebo.

Sensitivity analyses
Considering that the unusually large effect size observed with tamoxifen, and the small effect size with topiramate might have artificially affected and skewed the computations made in the context of MTM, we performed a sensitivity analysis by excluding these outliers (Appendix 3: Fig. 2). This network without outliers yielded the exact same SUCRA-based as well as point estimate-based rank orderings by drug efficacy as SMD with the whole network (Figs 3 and 5; Appendix 3: Fig. 2). This analysis also confirmed the SMD-based superior effect estimates for risperidone against aripiprazole and valproate as detected in the complete network, and further found risperidone to be superior to ziprasidone (0.32, 0.03–0.6) and quetiapine (0.30, 0.04–0.56), as well as haloperidol over valproate (0.23, 0.02–0.43). Both networks were in full agreement in regard to significance or insignificance of the pooled drug effects against placebo.
Forest plot for efficacy of antimanic drugs compared with placebo without outliers. Treatments are ranked by the point estimates as SMD with 95% credible interval [horizontal bars], based on the MTM. Vertical line at SMD = 0.0 indicates no drug v. placebo difference. (*) Indicates significantly superior effect compared to placebo.

In the present network 15 data points involved haloperidol. For ruling out differences in administered haloperidol doses as a potential source of bias, we repeated MTM for the primary outcome by excluding the haloperidol node from the network. This analysis also confirmed the original results by the entire network on the effectiveness and ineffectiveness of the individual drugs against placebo, as well as the superiority of risperidone over aripiprazole and valproate (Appendix 3: Fig. 3). The network without haloperidol node further indicated a minor but significant difference for olanzapine over valproate (0.2, 0.01–0.37).
The next sensitivity analysis considered if claimed increase in placebo responses, which itself was tested in a meta-regression analysis by publication year, might be related to reduced efficacy of newer drugs. For this analysis we ran MTM on the primary outcome after excluding 41 data points involving placebo treatments. Given that two thirds of the available RCTs in acute bipolar mania involved a placebo treatment, exclusion of the placebo node from the network resulted in 14 remaining joints. While in this analysis, risperidone was no longer significantly superior against aripiprazole and valproate, several new significant contrasts between antimanic treatments emerged. However, neither our previous standard meta-regression analysis (Yildiz et al. Reference Yildiz, Vieta, Tohen and Baldessarini2011b ), nor the present one by a MTM approach, validated a steady increase in the placebo-associated responses or reduction in the treatment contrasts over time (see the section on meta-regressions). As such, while meaningfulness of this sensitivity analysis for assessing efficacy of antimanic treatments has been called into question, it may contribute by illustrating how ignorance of the major part of the evidence by placebo treatment may potentially change the results of evidence synthesis (Cipriani et al. Reference Cipriani, Furukawa, Salanti, Geddes, Higgins, Churchill, Watanabe, Nakagawa, Omori, McGuire, Tansella and Barbui2009; Yildiz et al. Reference Yildiz, Vieta, Correll, Nikodem and Baldessarini2014b ). SUCRA-based rank orderings over the network without a placebo node as well as the point estimates between competing interventions are provided in Appendix 3: Fig. 4.
Comparative efficacy assessments of FGA v. SGAs v. MSs
In a sensitivity analysis, considering drugs in groups of FGA, SGAs, and MSs, we tested superiority of one group to another. This analysis by class effect confirmed antimanic effectiveness of the sole FGA haloperidol with SMD and CrI of 0.54 (0.39–0.69); SGAs 0.44 (0.36–0.51); and MSs 0.39 (0.28–0.49) compared to placebo, with no indication of significant differences among each other. With a perspective for future development of clinically usable brain penetrable protein kinase C inhibitors, we repeated the same analysis considering tamoxifen within the group of MSs. This analysis did not change the conclusion on group-based comparisons, but the point estimate-based rank ordering with SMD values and CrI of 0.60 (0.41–0.81) for MSs; 0.56 (0.27–0.84) for FGA; and 0.48 (0.32–0.63) for SGAs.
Meta-regression analysis
Informed by our previous standard meta-analysis indicating greater drug–placebo contrasts in the presence of psychosis (Yildiz et al. Reference Yildiz, Vieta, Tohen and Baldessarini2011b ), we examined if such a moderator effect survives when head-to-head RCTs are involved in the context of MTR. This analysis revealed that psychosis was no longer acting as a potential moderator. Subgroup analysis considering antipsychotics and MSs separately also did not distinguish any significant effect of psychosis on the computed treatment contrasts (Appendix 2: Table 1). Various other MTR models considering mixed-state diagnosis, all-cause discontinuation rates, publication year, and sponsorship, as potential effect-modifiers did not reveal significance (Appendix 2: Table 1).
Publication bias
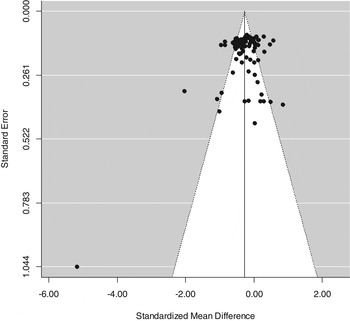
Finally, we explored presence of publication bias or small study effects with a funnel plot technique expanded to MTM. As visible in the depicted funnel plot, the observed asymmetry was primarily caused by one small study (Zarate et al. Reference Zarate, Singh, Carlson, Quiroz, Jolkovsky, Luckenbaugh and Manji2007), suggesting a small study effect rather than publication bias (Fig. 6).
The funnel plot for assessing presence of publication bias or small study effects. Asymmetry observed in the funnel plot primarily caused by one small study.

Consistency checking
By considering each of the primary and secondary outcomes we checked consistency in the three treatment loops. For the primary outcome as SMD all of the 32 loops, but one was found consistent. In regard to the secondary outcomes three of the 22 loops on responder rates, and two out of 30 loops on all-cause discontinuation rates were inconsistent; overall, indicating a good fit for our model. Likewise, the model fit as assessed by the consistency parameters of DIC and D res was good for all of the networks, examined (Appendix 2: Table 2). Pairwise comparisons by the random-effects Bayesian approach, also confirmed compatibility between the direct and indirect evidence (Fig. 3).
Discussion
This updated and homogenous network confirmed effectiveness of 13 antimanic treatments and provided evidence-based hierarchies on their efficacy and acceptability. For the primary outcome as SMD, the hierarchies indicated by the SUCRA probabilities were in full agreement with the point estimates on all effective antimanic drugs (Figs. 2 and 3). Point estimates for the SMDs against placebo for the 12 effective antimanic drugs in clinical use ranged from 0.32 to 0.66 with no indication of superiority of one to another, but for risperidone over aripiprazole and valproate. MTM based point estimates computed relative to placebo were compatible with the present Bayesian analysis and a recent frequentist SPM (Yildiz et al. Reference Yildiz, Vieta, Leucht and Baldessarini2011a ). However, numerous disagreements between the present and a previous MTM of antimanic drugs (Cipriani et al. Reference Cipriani, Barbui, Salanti, Rendell, Brown, Stockton, Purgato, Spineli, Goodwin and Geddes2011) were detected on both SUCRA-based and point estimate-based ranking by efficacy, as well as on the reported pair-wise effect-size estimates. In the earlier MTM, haloperidol was found superior to seven other agents (aripiprazole, asenapine, carbamazepine, lithium, quetipaine, valproate, ziprasidone); and both olanzapine and risperidone over two other treatments (valproate, ziprasidone) (Cipriani et al. Reference Cipriani, Barbui, Salanti, Rendell, Brown, Stockton, Purgato, Spineli, Goodwin and Geddes2011). Disagreements between the present and previous network were indeed unsurprising given that 41% of the evidence structure at 53 data points was different. Besides, the initial network including add-on and combination treatments combined their findings with data attained in monotherapy trials (e.g. haloperidol node included data derived not only from trials of haloperidol but also haloperidol plus lithium or divalproex). The previous network also differentially considered chemically similar drugs jointly in the same node (e.g. data from RCTs involving paliperidone as monotherapy or add-on were incorporated in the joint for risperidone) (Cipriani et al. Reference Cipriani, Barbui, Salanti, Rendell, Brown, Stockton, Purgato, Spineli, Goodwin and Geddes2011). Consequently, while the effect estimate for risperidone in the present network derived solely from the trials involving risperidone as monotherapy, in the previous network it involved risperidone plus lithium or divalproex or carbamazepine and paliperidone plus lithium or divalproex as well as RCTs of risperidone and paliperidone, as monotherapy (Cipriani et al. Reference Cipriani, Barbui, Salanti, Rendell, Brown, Stockton, Purgato, Spineli, Goodwin and Geddes2011). Indeed, where similar trial circumstances and objective outcome measures operate, MTM allows consideration of add-on and monotherapy trials in the same network, so long as justified by a relevant clinical research question and identity of each treatment is respected (Mauri et al. Reference Mauri, Polyzos, Salanti, Pavlidis and Ioannidis2008). However, considering that add-on trials of acute mania have special characteristics, often involving patients unresponsive to previous treatments (Yildiz et al. Reference Yildiz, Vieta, Correll, Nikodem and Baldessarini2014b ), we did not consider them jointly with the monotherapy trials.
The present MTM identified five drugs: aripiprazole, olanzapine, quetiapine, risperidone, and valproate with lower all-cause discontinuation rates compared to placebo. It is likely that acceptability of a drug, especially in the short term, reflects a fine-tuning between the drug’ efficacy, speed of action, and tolerability based on favorably limited adverse effects. Yet, short-term acceptability may not generalize to longer treatment. Notably, olanzapine had significantly less all-cause discontinuation rates than asenapine, carbamazepine, cariprazine, haloperidol, and lithium. However, olanzapine risks weight gain and metabolic syndrome in the longer term (Centorrino et al. Reference Centorrino, Masters, Talamo, Baldessarini and Öngür2012; Grande et al. Reference Grande, Bernardo, Bobes, Saiz-Ruiz, Alamo and Vieta2014; Mizuno et al. Reference Mizuno, Suzuki, Nakagawa, Yoshida, Mimura, Fleischhacker and Uchida2014). Given that short-term choices often end up as long-term treatments (Vieta et al. Reference Vieta, Langosch, Figueira, Souery, Blasco-Colmenares, Medina, Moreno-Manzanaro, Gonzalez and Bellivier2013), our findings on acute discontinuation rates should be interpreted with caution by considering undesirable drug effects also for the long term.
The analysis by drug class indicated comparative efficacy profiles for SGAs, MSs, and haloperidol. Group-based effect-size measures computed in the context of MTM were comparable with the previously reported SMDs and 95% confidence intervals (CIs) of 0.38 (0.26–0.50) for MSs; 0.40 (0.32–0.47) for SGAs; and 0.54 (0.34–0.74) for FGA, by frequentist SPM (Yildiz et al. Reference Yildiz, Vieta, Leucht and Baldessarini2011a ).
Sensitivity analysis conducted by excluding outliers yielded consistent SUCRA-based and point estimate-based rankings, and between-drug effect sizes, in support of internal validity of the reported findings (Appendix 3: Fig. 2). Likewise, exclusion of the haloperidol node yielded effect sizes compatible with the entire network (Appendix 3: Fig. 3). However, removal of the placebo node, resulting in loss of one third of the data points and five nodes from the entire network, skewed the findings on drugs with small treatment effects and less data points (e.g. ziprasidone; Appendix 3: Fig. 4).
The present network is meticulously structured with utmost care for similarity and comprehensiveness. Consistency of the network and internal validity of the present results was supported by several tests of consistency checking and sensitivity analyses. A number of clinical parameters were examined in several MTR models, but none was identified as an effect modifier (Appendix 2: Table 1), indicating a proper base for the MTM assumptions and indirect comparisons.
Robust analytic information obtained through advanced meta-analytic approaches can contribute to guide clinical decisions and reimbursement policies. However, their findings are based on RCT-based evidence; and RCT settings may not adequately represent real-world clinical samples (Yildiz et al. Reference Yildiz, Undurraga, Vieta, Popovic, Wooderson, Young, Yildiz, Nemeroff and Ruiz2014a , Reference Yildiz, Vieta, Correll, Nikodem and Baldessarini b ). Accordingly, this critical information can most efficiently be used by concurrent consideration of other accumulated data on a given drug's receptor or post-receptor level effects with consequent clinical reflections in light of patient's individual needs. Looking at the example of haloperidol and lithium or valproate, one may visualize how ranking by efficacy may be challenged by other sources of evidence as for detrimental effects of haloperidol in brain in contrast to lithium or valproate (Drevets et al. Reference Drevets, Price, Simpson, Todd, Reich, Vannier and Raichle1997; Bachmann et al. Reference Bachmann, Wang, Yuan, Zhou, Li, Alesci, Du and Manji2009; Machado-Vieira et al. Reference Machado-Vieira, Manji and Zarate2009; Vernon et al. Reference Vernon, Natesan, Crum, Cooper, Modo, Williams and Kapur2012). In conclusion, integrated information processing, supported by quantitative evidence-based point estimates for efficacy and safety, enriched by other data pertaining to drug-associated risks and benefits, and consideration of the needs and responses of individual patients should guide decisions for a skilful clinical care.
Supplementary material
For supplementary material accompanying this paper please visit http://dx.doi.org/10.1017/S0033291714001305.
Acknowledgments
We thank Drs Joris Berwaerts, Charles Bowden, Paul Keck Jr., Bernard Lerer, Roger McIntyre, Harrison G. Pope Jr., Steven Potkin, Gary S. Sachs, Alan Swann, Richard Weisler, and their colleagues, as well as representatives of Abbott, Bristol-Myers Squibb, Eli Lilly, Forest, Lundbeck, GlaxoSmithKline, Johnson & Johnson, Novartis, and Pfizer Corporations for sending us missing information on their published or unpublished trials.
No specific funding was received for this work.
Declaration of Interest
A. Yildiz has received research grants from and/or served as a consultant or speaker for Abdi Ibrahim, Actavis, Ali Raif, AstraZeneca, Bristol-Myers-Squibb, Janssen-Cilag, Pfizer, Sanofi-Aventis, and Servier Corporations. C. U. Correll has been a consultant or advisor to or has received honoraria from: Actelion, Alexza, AstraZeneca, Bristol-Myers-Squibb, Cephalon, Eli Lilly, Gerson Lehrman Group, Genentech, IntraCellular Therapies, Lundbeck, Medavante, Medscape, Merck, Novartis, Ortho-McNeill/Janssen/Johnson & Johnson, Otsuka, Pfizer, ProPhase, Roche, Sunovion, Takeda, Teva and Vanda. He has received grant support from Bristol-Myers-Squibb, Janssen/Johnson & Johnson, and Otsuka. E. Vieta has received grants and honoraria related to consultancy or advisory boards from several pharmaceutical companies, including Adamed, Alexza, Almirall, AstraZeneca, Bristol-Myers-Squibb, Cephalon, Eli Lilly, Ferrer, Forest Research Institute, Gedeon Richter, Glaxo-Smith-Kline, Janssen, Jazz, Johnson & Johnson, Lundbeck, Merck Sharpe & Dohme, Novartis, Otsuka, Pfizer, Roche, Sanofi, Senovel, Servier, Shering-Plough, Shire, Sunovion, Takeda, Teva, and United Biosource Corporation. M. Nikodem, R. J. Baldessarini, and the immediate family members of all authors have no current financial relationships with commercial entities that might represent potential conflicts of interest in this work.