


INTRODUCTION
A central feature of political science is the dynamic interdependence among political actors. Citizens, elites, governments, and countries all display intergroup connections because group members repeatedly face common sets of choices. Furthermore, the decisions made by one actor in a group often influence those of the others. As a result, many critical issues that political scientists study—such as collective action problems, international cooperation, and economic development—are influenced by the flow of ideas, information, and resources between those connected political actors. Yet while scholars are often able to observe the flow of information itself, empirically identifying the underlying network of connections—usually the concept of chief theoretical interest—is more difficult, especially if that network changes over time. In this research we introduce to the discipline a general method for inferring a dynamic network connecting political actors based only on observable information about the repeated choices that those actors make.
The methodology we introduce is applicable to a wide range of research areas across political science. However, to demonstrate its utility, we focus the bulk of our attention on one notable instance of this phenomenon: the diffusion of public policies across the American states. A considerable amount of scholarship documents how policies, norms, agreements, and even wars diffuse across political boundaries. Indeed, Graham, Shipan, and Volden (Reference Graham, Shipan and Volden2013) identify more than 800 articles from the past 50 years on diffusion processes in American politics, comparative politics, and international relations. A central theme in all of this work is that peer governments are connected to one another by their repeated policy decisions. However, observing systematic patterns in those connections over time—who tends to lead and who tends to follow—is a difficult task. We provide a means of doing so here by inferring a policy diffusion network based on the adoption of many policies over time. Moreover, we demonstrate how and why this dynamic network is crucial to understanding the diffusion process.
In what follows we demonstrate the significance of policy diffusion network inference and analysis. We begin by grounding the concept of a diffusion network in the theoretical framework of diffusion studies. We highlight that several scholars have suggested the existence of a diffusion network in theory, but never had the means of empirically measuring the ties in the network. Then we describe our network inference methodology; recently developed in machine learning, it can be used to infer a latent diffusion network from data consisting of binary diffusion “cascades.” Next we apply the algorithm to infer our network of state policy diffusion. Then we illustrate how including information from the inferred diffusion network as a covariate in well-known policy diffusion studies improves model fit. Following that, we present an analysis of the factors that predict the formation of diffusion ties between states. Finally, we close with a discussion of the broad applicability of the methodology to many different research areas in political science.
CONCEPTUALIZING A POLICY DIFFUSION NETWORK
The institution of federalism provides an ideal environment for diffusion processes by encouraging member governments to compete with or learn from one another. The American states represent an important example of such an environment (e.g., Berry and Berry Reference Berry and Berry1990; Gray Reference Gray1973; Shipan and Volden Reference Shipan and Volden2012; Walker Reference Walker1969). Indeed, the states are connected in many ways, including shared history and culture, the exchange of goods, migration of citizens, and overlapping media markets. A key result of these connections is that states look to each other when making policy. Due to myriad competitive, cooperative, and imitative forces, policy innovations regularly spread throughout the American states, and scholars have worked for decades to develop theoretical and empirical tools to understand and evaluate the various forces that underlie diffusion episodes. This has proven to be a difficult task because it requires conceptual and empirical separation of policy adoption, in which a state passes a new law as a result of internal and/or external determinants, and policy diffusion, which specifically refers to the external influence that other states exert on adoption in the state.
The broad arc of the literature on policy diffusion has moved from an initial interest in looking for consistent patterns of diffusion between states across multiple policies to the application of new methodologies or measurement strategies to single-policy diffusion episodes and finally to a renewed interest in the general patterns across policies. This return of the pendulum to detecting persistent pathways of diffusion results from recent theoretical and methodological advancements that provide the impetus for reexamining the foundational questions posed at the outset.
In his pioneering study, Walker (Reference Walker1969) stated his primary goals as (1) determining whether a group of policy leaders existed and, if so, (2) how policies spread from these pioneering states to the rest of the American states. After his innovation scores provided an affirmative answer to the first question, he moved to developing a theoretical and empirical approach for determining the existence of “more or less stable patterns of diffusion of innovations among the American states” (Walker Reference Walker1969, 888). He theorized that these patterns would reflect both geographic proximity and states’ locations within various national communication channels formed by associations of state officials, organized interests, consultants, and academics. Given the limitations of the time, his empirical analysis focused on the presence of regional groupings. He found that while regional groupings existed, the evidence clearly pointed to additional influences that blurred these regional distinctions.Footnote 1 While subsequent work by Gray (Reference Gray1973) offered a number of important critiques of Walker’s (Reference Walker1969) approach, it continued to conceptualize diffusion as reflective of “regional or professional communication networks [that] may produce distinctive diffusion patterns” (1176).
While these critiques stunted the pursuit of comparing innovativeness across states, the literature continued to pursue the idea of evaluating patterns of policy diffusion. Event history analysis (EHA), introduced for the study of policy diffusion by Berry and Berry (Reference Berry and Berry1990) in their analysis of the diffusion of state lottery adoptions, has been the primary vehicle for this pursuit as it offers the opportunity to simultaneously account for time-varying internal and external determinants of policy adoption. It addresses many of the concerns raised by Gray (Reference Gray1973) and others about Walker’s (Reference Walker1969) innovation scores and led to the development of a robust literature on policy adoption. During this era, researchers almost exclusively focused on one policy at a time since that fit within the EHA framework. Furthermore, while these researchers highlighted the role of a variety of internal determinants of adoption, the central external determinant of interest was geographic contiguity, which was meant to capture diffusion between neighboring states. Despite notable exceptions such as Mintrom and Vergari’s (Reference Mintrom and Vergari1998) study of policy entrepreneurs’ connections across states or Grossback, Nicholson-Crotty, and Peterson’s (Reference Grossback, Nicholson-Crotty and Peterson2004) evaluation of ideological similarity with previous adopters, the vast majority of studies continued to examine only contiguity. A common finding in this work is that the probability of adoption increases as more of a state’s neighbors adopt the policy (but see Mooney Reference Mooney2001).
After dominating the field for more than twenty years, single policy EHA studies began to run their course in terms of pushing the boundaries of knowledge. Researchers responded by moving in different directions, including a microlevel approach that examines the internal legislative processes that influence policy adoption (Karch Reference Karch2007) and studying how policy characteristics affect the overall rate of diffusion (Boushey Reference Boushey2010; Nicholson-Crotty Reference Nicholson-Crotty2009). Other researchers pushed forward on studying the patterns of interstate diffusion in creative ways: the incorporation of Geographic Information Systems (GIS) to develop more nuanced measures of economic diffusion pressures between contiguous states (Berry and Baybeck Reference Berry and Baybeck2005), the consideration of policy adoption and expansion to separate the role of economic and social learning forces behind diffusion (Boehmke and Witmer Reference Boehmke and Witmer2004), and the examination of bottom-up or top-down diffusion between cities, states, and the Federal government (Shipan and Volden Reference Shipan and Volden2006).
One of the biggest innovations during this period was the development of the dyadic EHA approach by Volden (Reference Volden2006). The dyadic EHA eschews adoption as its outcome of interest and instead considers whether a policy change by a state moves it closer to the policies of other states. An increase in policy similarity between pairs of states serves as the dependent variable and the dyadic structure facilitates evaluating whether a state moves its policy closer to those of other states whose policy differs (Boehmke Reference Boehmke2009). This allows the consideration of a variety of absolute and relative characteristics of state dyads, including contiguity, but also ideological similarity and policy success in states that might be emulated. This approach has been applied to health policy in the United States (Volden Reference Volden2006) as well as to unemployment policy in OECD countries (Gilardi Reference Gilardi2010).
Studies like these have prompted a new wave of theoretical arguments to explain patterns of diffusion, whether through competition between states (Baybeck, Berry, and Siegel Reference Baybeck, Berry and Siegel2011), learning and free-riding across states facing uncertainty about a policy’s value (Volden, Ting, and Carpenter Reference Volden, Ting and Carpenter2008), or through changes in public opinion resulting from constituent learning through policy choices in nearby states (Pacheco Reference Pacheco2012). These theoretical advances have, in turn, resulted in new ways to examine diffusion empirically.
Despite the major strides these and other studies have taken to further our understanding of policy adoption, they have still done so in the context of a single policy. Even the dyadic EHA approach usually considers policy similarity based on multiple components of a single policy. So while the literature has made significant progress identifying the existence of diffusion pathways, we still know relatively little about their persistence. Put differently, almost no systematic progress has been made towards answering Walker’s (Reference Walker1969) second question about general patterns of policy diffusion. While scholars have recently returned to the collection and analysis of large numbers of policies (Boehmke and Skinner Reference Boehmke and Skinner2012b ; Boushey Reference Boushey2010; Nicholson-Crotty Reference Nicholson-Crotty2009), they have not yet used these databases to uncover persistent connections between states through public policy diffusion. Yet this approach seems to be most consistent with what Walker (Reference Walker1969), Gray (Reference Gray1973), and others had in mind at the founding of this literature.
Indeed, the patterns of policy diffusion between the American states serve as a perfect opportunity for identifying the presence and structure of a dynamic, latent, policy diffusion network. The structure of such a network has been one of the driving forces in the literature for half a century, yet methodological and data limitations placed critical restrictions on the ability of researchers to estimate and evaluate such a network more than one policy at a time. As we describe below, the recent combination of technical advances and accumulation of data on the timing of adoptions for scores of policies provides the information necessary to solve this problem.
To our knowledge the latent network that we estimate on these data provides the first empirical measure of the full state-to-state policy diffusion network. The intuition behind the meaning of this network, however, parallels that of the much-used contiguity network. Just as a state becomes more likely to adopt a policy when its neighboring states have previously done so, it should be more likely to adopt a policy when any state to which it is connected in its general diffusion network has already done so. After estimating this network, we therefore explore its structure in a number of ways. First, we identify leader states and compare the structure of the network to one specified solely by contiguity. Then we show that supplementing existing studies with information about prior adopters in this latent network improves our ability to predict the adoption of specific policies. We then investigate the structure of this network by evaluating the ability of theoretically important covariates to explain diffusion ties.
POLICY DIFFUSION NETWORK INFERENCE IN THE AMERICAN STATES
Gomez-Rodriguez, Leskovec, and Krause (Reference Gomez-Rodriguez, Leskovec and Krause2010) consider the problem of inferring latent diffusion pathways connecting units (e.g., states or countries) based on data recording the times at which those units adopted or were infected with some attribute (e.g., a policy), over several attributes. Two non-policy-adoption examples are data on when a collection of people fell ill over several ailments or data on when news websites reported a given story over several stories. These cascades, as they are termed, exhibit the footprint of a hidden diffusion network connecting the units under study. Information on policy adoption for several states or countries and several policies constitutes data of this type. Here we use Gomez-Rodriguez, Leskovec, and Krause’s (Reference Gomez-Rodriguez, Leskovec and Krause2010) latent network inference algorithm, called NetInf, to infer policy diffusion networks connecting the American states over time.
The NetInf algorithm is derived and described in detail in the Online Appendix. Here we give a broad overview of its major steps. The inferential task is the identification of a latent, directed network (i.e., each tie has a sender and a receiver) that can be used to explain a dataset with several cascades, where each cascade is a recording of when units (e.g., states) exhibited some dichotomous attribute (e.g., a policy adoption). Each cascade is stylistically represented as a tree, in which there is a branch for each diffusion instance whereby the attribute (e.g., policy) spreads from the origin (i.e., sender) of the branch to the destination (i.e., receiver). The network being inferred constrains the trees that can be used to construct the cascade such that only edges in the network can be used to construct the trees. The network is tied to the set of cascades in that the algorithm will attempt to find edges that can be used in trees to explain many cascades. The structure of this algorithm actually fits quite closely with Walker’s (Reference Walker1969) description of the ideal way to represent state-to-state policy diffusion:
At the top of the tree would be a set of pioneering states which would be linked together in a national system of emulation and competition. The rest of the states would be sorted out along branches of the tree according to the pioneer, or set of pioneers, from which they take their principal cues (Walker Reference Walker1969, 893).
Here we apply NetInf to a moving window of policy adoptions on the 187 policies included in the database introduced by Boehmke and Skinner (Reference Boehmke and Skinner2012b ) to infer an evolving state-to-state policy diffusion network for the years 1960–2009.Footnote 2 Before presenting our application further, we define some useful terminology. We infer a different network in each year (t). The diffusion ties (i.e., edges) that we infer are directed, identifying for each pair of states (i, j), whether policies diffuse from i to j, from j to i, both, or neither. For a directed edge i → j, which indicates that policies diffuse from i to j, we refer to i as the source and j as a follower. Thus, if the edge i → j exists in the network at time t, then we say i is a policy source for the follower j at time t.Footnote 3
NetInf Overview
Now that the broad structure of the algorithm and components of our application have been described, we present a few critical details on how edges in the diffusion network are selected along with an illustrative example. Three main factors contribute to the likelihood that state i will be identified as a source for j. Collectively, these factors ensure that NetInf is picking up patterns consistent with the definition of policy diffusion given above, rather than just chance sequential adoption of the same policy by two states.
-
(1) The number of times i adopts a policy before j. NetInf uses edges it infers to explain the individual cascades, but an edge from i to j can only be used if i adopts before j. The number of times i adopts before j represents a ceiling on the number of times NetInf can use an edge from i to j in a cascade-specific tree.
-
(2) The length of time between i ’s adoptions and j ’s adoptions. The wait times are parameterized as exponentially distributed, which means short times are more likely than long times. Thus, NetInf would prefer to use single edges to explain short times between adoptions, and chains of edges to explain longer times. The degree to which NetInf prefers short to long times is governed by the tunable exponential rate parameter used in the algorithm.
-
(3) The precision with which an adoption by i predicts an adoption by j. NetInf uses a probability model in which adoption by sources is used to predict adoptions. If state i simply adopts a lot of policies early, a result will be many i-then-j sequences, but also many policies for which i adopts and j does not, which will penalize the probability model’s likelihood with false positives.
NetInf iteratively adds the edge that performs the best on the three factors above, weighted according to the underlying probability model (detailed in the Online Appendix). To smooth things out, the NetInf probability model also includes a very low, but nonzero, probability that a state will adopt a policy when one of its sources has not previously adopted (i.e., the cascade can jump without an edge in the network). Another feature to note is that NetInf prefers nonredundancy in forming the network. That is, if an edge has been added to the network that can be used to explain an adoption, NetInf will prefer to add an edge that explains other adoptions that are not yet adequately explained by existing edges.
An Example: West Virginia, 1975–2009
We illustrate the edge ranking and selection procedure using the case of identifying sources for West Virginia over the period 1975–2009. West Virginia adopted 39 policies over this time period. The first step in ranking and identifying potential sources for WV is to ask which states adopted several of those 39 policies prior to WV adopting. Among the other 49 states, the largest number of pre-WV adoptions we observe is 17. Colorado, California, and Connecticut all adopted 17 of the 39 policies adopted by WV before WV adopted them. This makes CO, CA, and CT strong potential sources for WV because each could be used to explain 17 of WV’s policy adoptions. As it turns out, all three of the edges CO → WV, CT → WV, and CA → WV are added to the diffusion network that covers the period 1975–2009. The CO → WV edge is the 46th (out of 300) added to the network for that period, the edge CT → WV is the 67th, and the edge CA → WV is the 112th. Note that the number of edges identified is a tunable parameter of NetInf , so if we had asked for only 100 or 50 edges, we would have excluded the CA → WV and the CT → WV edges, respectively. We also consider one more potential source state, Delaware, which adopted 16 policies prior to WV in this period, but is not identified as a source for WV.
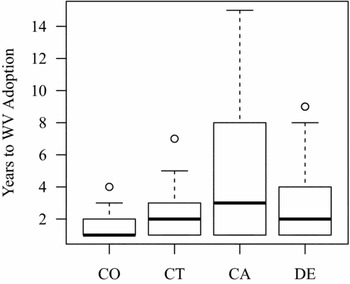
In serving as potential sources for WV, CO, CA, CT, and DE are all high relative to other potential sources on the first point listed above: the number of i-then-j sequences. The source quality ranking of CO > CT > CA > DE results from their performance on the second two factors. Figure 1 depicts the distributions of years between the three potential source states and WV’s adoptions for the policies in which the potential sources adopt before WV. The graph shows that WV adopted very shortly after CO in nearly all 17 instances. There were several longer lags for CT, more longer lags for DE, and many long lags for CA (e.g., 5–10 years). Thus, CO performs the best on criterion 2 (the length of time between i’s and j’s adoptions).
Pre-WV Adoption Times, 1975–2009

Last, CO, CT, CA, and DE adopted 57, 56, 68, and 53 policies, respectively, over the 1975–2009 period. These adoption frequencies factor in on the third criterion, the precision of an adoption by i in predicting an adoption by j. Because CA adopted 18–20 percent more policies than CO, CT, or DE, policy adoption by CA is less effective at predicting an adoption by WV than are adoptions by CO or CT.Footnote 4
To understand why DE is not identified as a source, we need to dig a bit deeper into the comparative pre-WV adoption timing. Recall that NetInf prefers to use edges to span short time periods in diffusion trees. In understanding how NetInf chooses between potential sources, it is important to consider which potential source regularly adopts prior to the follower state, and relatively close to the follower state’s adoption. Looking at WV’s adoptions, we see that CO, CT, CA, and DE were the most recent prior adopting states for 11, 8, 10, and 3 policies, respectively. Because NetInf prefers to use edges for short diffusion times, DE is not a good candidate source relative to other states.
Network Inference Over Time
In order to represent variation in the network over time, we apply NetInf to a moving window of policy adoptions. There are many ways we could divide the data in order to use NetInf to infer a different network for each year. We base our approach on how the networks and measures computed on them would likely be used in future research. We expect, and later suggest, that scholars will use the diffusion networks in the same way they use geographic neighbors in statistical models of the adoption of new policies. That is, statistical models will use the number of state s’s sources that have adopted the policy prior to t to predict whether s will adopt that policy at time t.
To avoid endogeneity in the use of the network at t to predict adoption at t, we specify our time-varying network inference to assure that only policy adoptions prior to time t are used to inform the structure of the diffusion network at time t. An edge from i to j at t can be interpreted as indicating that the policy has frequently spread from i to j in the period immediately preceding t. This way, we can be certain that a state’s policy adoption at time t is not used, via the inferred network, to predict that same policy adoption at time t.Footnote 5
Tuning NetInf
We set three parameters in the network inference procedure. First, we need to define the number of preceding years of adoptions that will be used to infer the network for time t. Second, we need to define the number of edges we want to infer. Third, we need to tune the rate parameter of the exponential distribution used by NetInf to calibrate how long it takes for policies to diffuse from one state to another. The exponential distribution gives the distribution of diffusion times between states, provided that there is an edge connecting them. Higher rates place a higher penalty on the addition of edges to the network along which it takes a long time for policies to diffuse.
The procedure we use to select the values of these three parameters is fully described and illustrated in the Online Appendix. To give an overview, we use a grid search on a range of the number of edges from 100 to 1,000, the time interval from 5 to 50 years, and the exponential rate parameter from 0.125 to 1 (i.e., an average diffusion time of 1–8 years). We infer a new time series of networks for each combination of tuning parameter values and evaluate the fit of an event history model, which does not include any other state covariates, in which we use the inferred networks to predict policy adoptions. Our process of tuning NetInf represents a combination of theoretical and data-driven considerations. We rely upon prior theoretical expectations regarding the appropriate ranges in which we expect to find the optimal parameter values. We use a data-driven approach to identify the best set of parameters within these ranges. The only condition under which we would explore a broader range of the parameters is if we found a boundary solution in the grid search (e.g., if the best rate parameter were 0.125, corresponding to an 8-year average diffusion time).Footnote 6
The networks that we use in the analysis that follows are those that result in the best fit over the grid of tuning parameter values. The network that results in the best predictive fit across all parameters is one with 300 edges and defined over 35 years of policy adoptions. Because we evaluate the tuning parameters, including the time interval, based on the effectiveness of the inferred ties in predicting future adoption cascades, we are not surprised to find that the best-performing time interval is relatively long. Ties identified in relatively long time intervals will be those that are robust to historical fluctuations in political, social, and economic conditions.Footnote 7 The fit is not particularly sensitive to the rate parameter, but the network using a rate of 0.5 results in the best fit. This value corresponds to diffusion episodes that take, on average, two years. An average of approximately 1,900 adoption instances over an average of approximately 120 policies is used to infer the network for each year (precise distributions of these quantities are provided in the Online Appendix).
DESCRIPTIVE ANALYSIS OF THE POLICY DIFFUSION NETWORK
In this section we conduct descriptive and exploratory analyses of the network we have inferred. First, we demonstrate that the network is quite distinct from a set of relations recording geographic contiguity. Second, we summarize the outgoing and incoming diffusion ties of each state over five-year periods. Third, we provide an external empirical validation of the network by comparing it to newspaper reports of state-to-state emulation during the same time period.
Geographic Contiguity
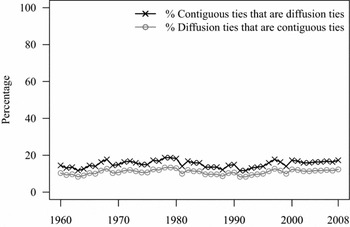
The first descriptive feature of the diffusion network that we consider is its similarity to a network of geographic contiguity relations among states. Figure 2 plots the percentage of contiguity relations between states that are identified as diffusion ties (black line) and the percentage of inferred diffusion ties that are between contiguous states (gray line). Both of these percentages hover between 10 and 20 percent between 1960 and 2009. This indicates that the overwhelming majority of policy diffusion relations exist between states that are not geographically contiguous. Therefore, although geographic contiguity represents a good first start, ties between neighboring states are not a comprehensive proxy for the policy diffusion network.
Comparison of Diffusion Relations with Geographic Contiguity

State-Level Activity in Diffusion Pathways
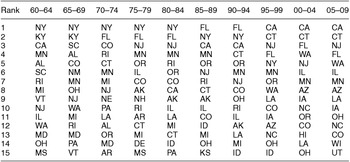
Ranking states based on their innovativeness is a research problem that dates back at least to Walker (Reference Walker1969). Table 1 presents the top 15 states based on the number of states to which they send diffusion ties over five-year periods. In their time-aggregated measures of policy innovativeness, Walker (Reference Walker1969) and Boehmke and Skinner (Reference Boehmke and Skinner2012b ) find {CA, NJ, OR, NY, CT} and {CA, NJ, IL, NY, OR} to be the top five states, respectively. Many of these states are at the top of our list in each five-year period. Only Florida emerges as an outlier with respect to previous rankings: Walker (Reference Walker1969) and Boehmke and Skinner (Reference Boehmke and Skinner2012b ) rank Florida as 13th and 12th, respectively, whereas we find Florida to be in the top five for nearly every five-year period, and at the top of the list for a decade.
Top 15 States Based on the Total Number of Diffusion Ties Sent to Other States within Five-Year Periods

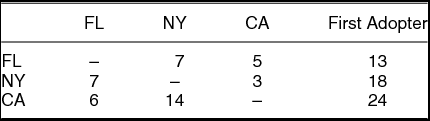
To venture an explanation as to why Florida emerges as an innovator in our analysis, but not in previous studies, we present Table 2, which details how often each of the three top innovators (New York, California, and Florida) were first adopters, and also how often the other two did not adopt. We see from this table that, even though Florida is the least frequent first adopter among the three, the policies for which it is the first adopter are, at a very high rate, never adopted by New York or California. Thus, although Florida does not stand out as a notably frequent first adopter, it is often placed at the root of cascade trees because other frequent adopters are not innovators in policy areas led by Florida. This inference regarding Florida highlights a primary strength of NetInf : A state will not be deemed innovative based solely on the speed with which it adopts policies. Rather, a state is deemed innovative if its adoption serves to explain adoptions by other states that cannot be explained with reference to other early adopters.
Top Innovators from the Inferred Diffusion Network

Note: The entry in row i, column j of the state × state elements of this table gives the number of policies for which state i was the first adopter and state j never adopted. The last column gives the total number of policies for which state i was the first adopter.
Media-based Validation of the Policy Diffusion Network
We have not yet connected the diffusion ties we have inferred with any real-world instances of state-to-state policy emulation. Given the high profile status of several areas in state law, selected major policy decisions at the state level are afforded in-depth press coverage (Tan and Weaver Reference Tan and Weaver2009). As we show below, newspaper articles often indicate when a substantial portion of a state law has been modeled after another state’s policy. We identified accounts of policy emulation in journalistic coverage of state policymaking by searching LexisNexis Academic for newspaper articles containing the phrase, “modeled after a/an ***”, where “***” was the name of a state, for all 50 states.Footnote 8 LexisNexis covers newspaper articles going back to 1981. We then counted the number of stories that report the emulation of each states’ policies. These documented instances of policy emulation can serve as the basis for a qualitative validation of the inferred network. If the news media accurately reports some (possibly biased) sample of actual policy emulation instances, then we should observe a positive association between the number of diffusion ties sent by a state and the number of media reports of that state being emulated by others.
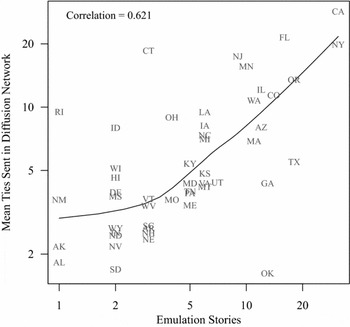
Figure 3 depicts the bivariate relationship between the number of emulation stories identified and the average number of ties sent by each state in the inferred diffusion network, averaged over 1981–2009. On the linear scale, we find a strong correlation of r = 0.72. However, two outliers—New York and California—have approximately twice as many emulation stories as any other state, so we also consider the correlation on the log scale, which produces a slightly more moderate correlation of 0.621. Both the Pearson’s correlation coefficient and Spearman’s rank-based correlation are statistically significant at the 0.01 level.Footnote 9 The positive relationship between emulation reports in the media and average ties sent in the inferred diffusion network indicates that the diffusion relationships we identify align with in-depth journalistic accounts of state-to-state policy diffusion.
Association Between Inferred Diffusion Ties and Media Reports of Emulation

APPLYING THE INFERRED NETWORK TO MODELS OF POLICY DIFFUSION
Most policy diffusion studies examine the influence of state-level features on the adoption of new policies as well as the influence states have on one another, primarily via contiguity. Our network of policy diffusion across the 50 states provides a novel opportunity to account for cross-state dependencies in these studies. To that end, we incorporated the inferred policy diffusion network into EHA models of diffusion for four separate policies: lotteries (Berry and Berry Reference Berry and Berry1990), Indian gaming (Boehmke Reference Boehmke2005), capital punishment (Boehmke Reference Boehmke2005), and restaurant smoking bans (Shipan and Volden Reference Shipan and Volden2006). In addition to these policy-specific EHA models, we also replicated Boehmke and Skinner’s (Reference Boehmke and Skinner2012a ) “pooled event history analysis” (PEHA) model fit to data on 151 different policies diffusing over the period 1960–1999 (see also Boehmke Reference Boehmke2009).
To conserve space, we present the details of these applications of the inferred diffusion network in the Online Appendix. Briefly, they yield two primary contributions to research on state policy diffusion. First, they illustrate how the diffusion network can be integrated as a covariate in conventional diffusion models. We demonstrate that doing so produces statistically and substantively significant estimates of the effect of network ties on adoption and improves model fit. The second contribution stems from the fact that NetInf does not condition on covariates, making it possible that the ties inferred by NetInf arise from some underlying covariates that induce regular patterns of policy diffusion. Our replications show that the inferred ties are not simply an artifact of the covariates already known to influence policy adoption; rather, our diffusion network is a uniquely important aspect of the diffusion process.Footnote 10
UNDERSTANDING THE INFERRED NETWORK
Similar to other forms of latent variable (e.g., estimated legislator ideal points), the diffusion network we have identified likely arises from a complex combination of states’ attributes and their relationships to each other, drawing from political, economic, and geographic factors. In our final analysis, we evaluate the structure of our inferred network through the lens of extant theoretical expectations about the identities of leaders and followers. We do so via multilevel logit models of source-follower ties over the period 1960–2009.
Theoretical Framework
The concepts of exploration and exploitation, referring to the processes of individual independent innovation and interactive emulation, respectively (Lazer and Friedman Reference Lazer and Friedman2007), lie at the heart of social theories of problem solving and behavioral choice (see, e.g., Akers et al. Reference Akers, Krohn, Lanza-Kaduce and Radosevich1979; Berkes Reference Berkes2009; Kirke Reference Kirke2004; Rice et al. Reference Rice, Grant, Schmitz and Torobin1990). Sometimes referred to as social learning (Ellison and Fudenberg Reference Ellison and Fudenberg1995; Hummon Reference Hummon2000), a growing body of research addresses how networks will and should be organized to cope with uncertainty regarding optimal decisions (Mason and Watts Reference Mason and Watts2012). The theoretical framework of policy diffusion in the American states bears a strong resemblance to the general literature on learning in networks. Indeed, incomplete information underpins Walker’s (Reference Walker1969) theory of policy diffusion and much of the subsequent research (e.g., May Reference May1992; Mooney Reference Mooney2001; Volden Reference Volden2006). States do not have the time or resources to fully evaluate all possible solutions to their pressing policy problems. Walker and others therefore suggest that states may act according to Simon’s (Reference Simon1976) concept of satisficing, in which they attempt to identify policies that will improve their lot even if they may not constitute the optimal policy. To accomplish this, states rely on a set of heuristics to identify policies for possible adoption. Most importantly, states will look to the actions of other states as a source of information. These may be neighboring states, states with similar characteristics and therefore similar policy needs, or states with more extensive resources that act as leaders by investigating new policies.
We draw our explanatory variables intended to capture states’ capacity to innovate and learn from other states from among those commonly used in the literature. For example, Walker (Reference Walker1969) argues that more populous, wealthier states typically have the resources and motivation to learn about policies on their own and scholars using EHA have continued to include these variables. We also consider legislative professionalism, which diffusion scholars have more recently used as a measure of legislative capacity (see, e.g., Shipan and Volden Reference Shipan and Volden2006). Because previous EHA studies overwhelmingly focus on monadic policy diffusion, scholars typically use these variables to test whether greater resources lead states to adopt new polices faster. Because we seek to explain their effect on the diffusion network, however, we have the opportunity to separate their distinct effects on leaders and followers. If diffusion occurs according to an informational process, then states with greater capacity will tend to be leaders since they can investigate policies on their own more thoroughly. This also suggests that states with greater resources can process more information and consider policy solutions in more states simultaneously. We therefore expect that states with greater resources are more likely to be sources, but also to identify other states as sources.
Beyond resource effects, however, we also want to capture Walker’s idea of peer states. When identifying sources, states may look beyond the wealthiest states to states that have similar characteristics and whose choices may reflect more upon their specific circumstances. The process according to which similar nodes are more likely to form ties in a network is referred to as homophily, and is one of the most common effects found in research on social networks (Fowler et al. Reference Fowler, Heaney, Nickerson, Padgett and Sinclair2011). The identity of peer states likely goes beyond measures of capacity or expertise, however, so we also consider the role of factors for which similarity may matter in and of itself. In particular, we consider similarity in terms of ideology and racial diversity. Ideology plays a crucial role in the types of policies states seek to adopt. With incomplete information, then, states may look to the policies adopted by ideologically similar states rather than to those of dissimilar states since the former has a greater chance of providing a solution consistent with the preferences of its citizens. A number of studies have demonstrated that ideology influences whether a state will copy the policy adopted by another state (e.g., Grossback, Nicholson-Crotty, and Peterson Reference Grossback, Nicholson-Crotty and Peterson2004; Volden Reference Volden2006; Volden, Ting, and Carpenter Reference Volden, Ting and Carpenter2008). We also consider the role of racial and ethnic diversity. States with more heterogeneous populations face distinct policy challenges so we expect that states will use diversity in defining their peer network.
The most studied concept of peer states is geographic proximity. While Walker (Reference Walker1969) focused largely on regional clusters of states with a small number of their members serving as leaders, more developed theories have emerged over the years. Many focus on the role of contiguity explicitly, whether as a source of information transmission about public opinion (Boehmke Reference Boehmke2005; Pacheco Reference Pacheco2012) or as a facilitator of cross-border economic activity (Baybeck, Berry, and Siegel Reference Baybeck, Berry and Siegel2011; Berry and Baybeck Reference Berry and Baybeck2005). While contiguity remains the workhorse variable for interstate diffusion, we also want to leverage the fact that our network considers the relationship between all pairs of states to examine the role of geographic proximity above and beyond contiguity. To do this we include a measure of distance between state capitals to test whether states have a regional tendency when determining their peers.
Modeling Strategy
In order to test for the effects of capacity and homophily on the leader-follower relationship, we include variables corresponding to each and enter them into our model in three ways. We start with variables on total state population and income from the Bureau of Economic Affairs, legislative professionalism (King Reference King2000), Berry et al.’s (Reference Berry, Ringquist, Fording and Hanson1998) citizen ideology (the revised 1960–2010 series), partisan control of state government (Klarner Reference Klarner2003), and racial diversity using Hero and Tolbert’s (Reference Hero and Tolbert1996) formula applied to Census data. For each variable, we include its value in the potential source state to model which states tend to be emulated, its value in the potential follower state to capture the tendency of states to identify sources, and as a relative measure using their absolute difference (for continuous variables) or product (for the partisan control) to assess homophily. We expect that the measures of capacity have positive effects; that the relative measures of ideology and diversity exert negative effects (since larger values correspond to greater difference between the two states); and that shared borders and geographic proximity have positive effects. Of course, homophily likely extends beyond ideology and diversity, so we also expect that the absolute difference between these variables has a negative effect. We have no specific expectation about the role of ideology on its own in the source or follower state.
In order to evaluate these predictions, we estimate a multilevel, over-time, logit model of the diffusion network.Footnote 11 In accordance with the structure of this network, each observation corresponds to whether one state considers a second state as a source. We therefore have dyadic data, which facilitates the inclusion of characteristics of each state separately as well as their relative characteristics. In order to account for dependence between observations we include two (non-nested) random effects: one for each state when it is the follower, choosing its peer network, and another when it is a potential source for other states. We also include, but do not report, a set of fixed effects for each year.Footnote 12 Finally, recall that, as we noted in the previous section, the NetInf algorithm does not condition on underlying covariates. As such, anything that would predispose two states to prefer the same policies might induce the appearance of diffusion ties among them. Measures of partisanship and political ideology would be chief among these common exposures when it comes to policymaking, which suggests some initial caution in interpreting these results.
Results
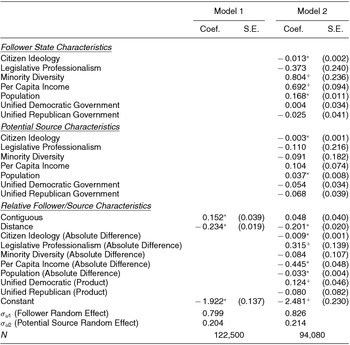
We report the results of this estimation in Table 3. Overall, they indicate the importance of capacity, political homophily, and geographic proximity. The results for capacity stand out as especially strong, with more populous states more likely to serve as sources and to identify other states as sources and larger and wealthier states to identify other states as sources. Further, we find strong evidence of homophily, with larger absolute differences between states decreasing the probability of each state choosing the other as a source. Interestingly, though, legislative professionalism does not conform to this pattern. The effects for sources and followers are not statistically significant and the difference term has a positive effect—indicating heterophily—which is only significant according to the parametric p-values, indicating that states rely more on states with different values of professionalism.
Multilevel Logit Models of State Policy Diffusion Ties

Notes: Observations are dyadic. The dependent variable indicates whether potential source state is a source for a follower state in a given year. We use the network with 300 edges over 35 years of policy adoptions. Multilevel logit coefficients are reported with standard errors in parentheses. + indicates statistical significance at the 0.05 level (two-tailed) according to just the parametric p-values from the multilevel logit. * indicates statistical significance at the 0.05 level according to the QAP p-values and the parametric p-values. QAP p-values derived from 500 network permutations.
Citizen ideology also produces results consistent with expectations. In particular, ideological distance has a negative and significant effect, demonstrating strong ideological homophily in diffusion. We also find that more liberal states have fewer sources and serve as sources less often. Analogous results are obtained based on government control: unified Democratic states identify similar states as sources more often than states with divided government, but the effect is only statistically significant according to the parametric p-values. No effects emerge among unified Republican states.
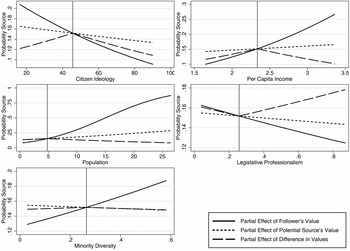
In order to substantively interpret these coefficient estimates, we present a series of graphs that translates them into expected probabilities of source-follower ties. We first examine the homophily effects in Figure 4. To calculate these probabilities we set every continuous variable at its mean value and every dichotomous variable at its modal value in 1985. We set the estimated random effects at their mean of zero. We then present partial effects for each set of variables: one changing just the value in the state seeking sources, one changing the value in potential sources, and one changing the absolute difference between them.
Estimated Substantive Effects of Absolute Difference Variables

Consider first the top left graph for the effects of ideology. The baseline condition involves citizen ideology at its mean value, represented by the vertical line. Moving ideology in a potential follower decreases the probability of identifying sources when the state becomes more liberal and increases it when the state becomes more conservative. A similar result occurs for the ideology of potential source states: more liberal states get chosen less often and more conservative states more often. Of course, both of these manipulations also increase ideological distance, which has a negative effect on source selection. The combined effect of making the potential source more liberal leads to an even greater decrease than either alone whereas making it more conservative leads to a less severe decrease. In terms of magnitude, the effects range from zero to about 30% relative to the baseline probability of about 15%.
The other graphs show similar patterns for per capita income, population, and minority diversity. The magnitudes do differ quite a bit, with population showing very large effects for a handful of large states and diversity producing a relatively small effect (note that the scales of the graphs differ to enhance readability). Interestingly, across all five plots, the follower state effect generally appears largest in magnitude, the homophily effect typically lies in the middle, and the potential source state effect is the smallest. Consistent with the individual coefficients, the results for legislative professionalism do not fit our expectations. While generally insignificant and small in magnitude, we find these results puzzling and hope to explore them in future work. One possible explanation rests in the high correlation of professionalism with population (0.72 in our sample).
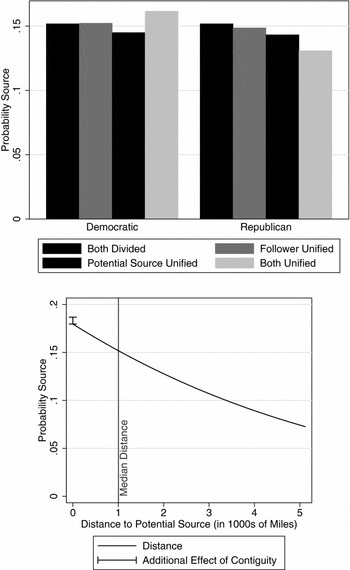
We present the results for the other variables in Figure 5. Unified government control has a small effect, generally less than one or two percentage points. The biggest effects occur for same unified governments, with Democratic states most likely to choose other Democratic states as sources, but Republican states less likely to choose other Republican states. The bottom graph shows the effect of geographic distance and contiguity. Increasing distance by a thousand miles leads to an approximately two and a half percentage point drop in the probability of choosing a state as a source whereas contiguity leads to a minuscule change once we account for distance—the small capped bar at the minimum of 40 miles represents the estimated additional effect of contiguity.
Estimated Substantive Effects of Selected Variables

NETWORK INFERENCE IN POLITICAL SCIENCE
This research makes several substantive contributions to the literature on public policy diffusion in the American states. However, the network inference methodology is sufficiently general that it has the potential to impact several other research areas in political science. The obvious domain in which NetInf is applicable is the literature on policy diffusion at the national level. Graham, Shipan, and Volden (Reference Graham, Shipan and Volden2013) report that from 1958 to 2008, major political science journals published 307 policy diffusion articles in comparative politics and 226 in international relations (as well as 189 in American politics). However, political scientists also study many other phenomena that are comprised of a fixed set of actors (e.g., citizens, legislators, countries) who make repeated sequential decisions. NetInf would be fruitfully applied in these domains to infer the connections between these actors.
Consider the study of international agreements and organizations. Shared affiliations in these institutions have been used as a proxy for ties between countries (e.g., Dorussen and Ward Reference Dorussen and Ward2008). This measure has drawn criticism due to the largely static nature of membership in these institutions. As Hafner-Burton, Kahler, and Montgomery (Reference Hafner-Burton, Kahler and Montgomery2009) point out, “[a]lthough mutual membership in international institutions may lead to more opportunities for mutual interaction. . .it does not necessarily lead to positive ties, as is often assumed in international relations. . . . [M]embership may offer a static view of world politics” (578–79). NetInf could solve this problem by constructing a dynamic network based on countries’ repeated decisions to join intergovernmental organizations, trade agreements, and/or other international institutions (i.e., the cascades through which affiliations spread across countries).
Another possible use for NetInf is to infer connections among legislators. In American politics, a long tradition of work examines legislative “cue-taking,” or the process by which legislators look to other members in making voting and cosponsorship decisions (e.g., Kingdon Reference Kingdon1973; Matthews and Stimson Reference Matthews and Stimson1975). Network analysis has recently been employed to study legislators’ interactions in the American (Tam Cho and Fowler Reference Tam Cho and Fowler2010) and cross-national (Ringe, Victor, and Gross Reference Ringe, Victor and Gross2013) contexts. However, a common means of understanding how cue-taking operates is through the use of legislator characteristics as covariates in regression models (e.g., Box-Steffensmeier, Arnold, and Zorn Reference Box-Steffensmeier, Arnold and Zorn1997). This is a useful approach, but due to the lack of a tie measurement method, it necessarily conflates sequence with cue-taking. NetInf could solve this problem. Indeed, NetInf has recently been applied to data on cosponsorship in the U.S. Senate with the aim of identifying the Senate influence network (Denny Reference Denny2014).
Finally, political scientists and communication scholars are interested in intermedia agenda setting, or how media outlets interact through picking up stories from one another (e.g., Denham Reference Denham2014; Golan Reference Golan2006). NetInf has the potential to infer a network of media outlet influence, which could be useful for studies that examine the media’s impact on public attention to issues. Specifically, it could help scholars understand which outlets, news mediums, or people are most influential in setting the news agenda (e.g., Neuman et al. Reference Neuman, Guggenheim, Jang and Bae2014). In fact, the example that Gomez-Rodriguez, Leskovec, and Krause (Reference Gomez-Rodriguez, Leskovec and Krause2010) use to introduce NetInf is the cascading of news articles among online media outlets over a one-year period.
Network inference has the potential to impact many areas across political science. Many important political phenomena are driven by patterns of influence and emulation. Thus, political science routinely confronts the fact that the individual decisions of a collection of actors affect, and are affected by, other actors. NetInf is a useful means of dynamically measuring these relationships.
CONCLUSIONS
A half-century of research has examined the causes and consequences of policies diffusing across national and subnational boundaries. However, until now scholars have not had an ideal means of measuring the precise patterns though which policies diffuse. Geographic contiguity is one important factor, but does not capture the complete network of policy diffusion. In this research, we introduce a network inference methodology to political science and use it to infer a policy diffusion network connecting the American states.
We offer three broad contributions to the state politics literature. First, in contrast to common assumptions in research on state policy diffusion, we find that the overwhelming majority of diffusion ties connects states that are not geographic neighbors. Second, we show that the policy diffusion network we infer can improve explanatory models of policy adoption within specific policy areas. Our replications of previously published diffusion models indicate that when sources in a state’s policy diffusion network adopt a policy, the likelihood of adoption significantly increases by a comparable amount to adoption by contiguous neighbors. Third, we present empirical models of the ties in the inferred networks to evaluate a number of theoretical perspectives on diffusion. Perhaps most interestingly, the results highlight the role of internal capacity and pairwise similarity, which tend to dominate. States with greater resources tend to have more peers, but all states favor other states that share similar demographic and political features. We also find evidence of leadership, with larger and wealthier states more often chosen as sources. While we have focused on extant theories, we hope that the availability of our estimates and future applications of NetInf provide the impetus to test existing and develop new theories of interstate policy diffusion.
The current research opens the door to several future directions in methodology and state policy diffusion research. First, and chief among them, is extending the NetInf algorithm to simultaneously infer covariate-based commonalities in policy adoptions as well as the underlying diffusion network. This would present the opportunity to precisely differentiate between diffusion ties and patterns that are attributable to covariates. A second worthwhile extension of NetInf would be to incorporate whether policy innovations succeed or fail by some metric, which would allow us to evaluate the degree to which diffusion depends upon the result of the innovation. Third, our tracing of diffusion accounts in LexisNexis is rather limited, but demonstrates the feasibility of defining diffusion networks through the analysis of textual sources. Finally, though our work utilizes what is, to our knowledge, the most comprehensive database of state policy adoptions currently available, there are many more policies that could be traced through the states. An expanded policy database would permit fine-grained inference of policy-specific diffusion networks connecting the states and the chance to identify different structures by policy type.
A final contribution of this research is the introduction of the NetInf technology to political science. While we illustrate its applicability in the context of state policy diffusion, it has broad potential for research in American politics, comparative politics, and international relations. The discipline often studies political actors who repeatedly face the same choices and make them in sequence. This means that interdependence between actors and the emergence of leaders and followers are likely to influence the processes under study. NetInf helps to empirically recover this interdependence so that researchers can better understand its causes and consequences.
SUPPLEMENTARY MATERIALS
To view supplementary material for this article, please visit http://dx.doi.org/10.1017/S0003055415000040




Comments
No Comments have been published for this article.