Introduction
It has been well established that very young children have a strong advantage over adults in the acquisition of new phonological categories (Flege, Reference Flege and Birdsong1999; Munro, Flege & MacKay, Reference Munro, Flege and MacKay1996; Oyama, Reference Oyama1976). This reflects how phonetic sensitivity changes from language-general to language-specific as native language development proceeds (Jusczyk, Reference Jusczyk1997). Research in this domain has mostly focused on infants acquiring their native language, and on adults acquiring a non-native language. Relatively little is known about the phonological system of older children (Walley, Reference Walley1993), even though perceptual openness and plasticity are known to extend beyond the first years of life (Ohde, Haley & McMahon, Reference Ohde, Haley and McMahon1996; Walley & Flege, Reference Walley and Flege1999). As such, there is a gap in our knowledge of the nature of phonological representations in the native (L1) and non-native (L2) lexicons of children who are no longer toddlers, but have not yet reached adolescence. It is precisely in childhood, however, that speakers often engage in their initial stages of school-based second language learning. This study aims to partly fill this gap by examining the phonological and phonetic representations of 9–12-year-old monolingual Dutch children in their native language and in a non-native language with which they are familiar. We report the results of native (Experiment 1) and non-native (Experiment 2) mispronunciation-detection tasks in which the vowels of the target words were replaced by other vowels from the same language. A third (discrimination) experiment tested to what extent participants were able to distinguish between the English vowels in a more auditorily oriented task. The results provide insight into the development of native and non-native speech perception.
Vowel and consonant perception in infants has been examined in a large number of recent studies (e.g., Bosch, Reference Bosch, Braddick, Atkinson and Innocenti2011; Kuhl, Stevens, Hayashi, Deguchi, Kiritani & Iverson, Reference Kuhl, Stevens, Hayashi, Deguchi, Kiritani and Iverson2006; Polka, Rvachew & Molnar, Reference Polka, Rvachew and Molnar2008). These studies show that infants and toddlers quickly become sensitive to mispronunciations of familiar words (Swingley & Aslin, Reference Swingley and Aslin2000). For example, 18–23-month-old English-speaking infants look longer at a target picture when the initial consonant in an auditory prompt is pronounced correctly than when it is mispronounced (e.g., ball pronounced as [ɡɑːɫ], Swingley & Aslin, Reference Swingley and Aslin2000). Similar effects have been found for Dutch-speaking 19-month-olds for words in which a word-initial or word-medial segment was replaced (Swingley, Reference Swingley2003). Although much attention has been paid to these rapid improvements in early stages, children's speech perception abilities continue to develop throughout childhood. For instance, 14-month-old Dutch children have been reported to show an asymmetry in their detection of stop–fricative substitutions: they were sensitive to substitutions of fricatives by stops, but not to substitutions of stops by fricatives (Altvater-Mackensen & Fikkert, Reference Altvater-Mackensen and Fikkert2010). This asymmetry was also observed for 18-month-olds, but not for 25-month-olds (suggesting that, at that age, their representations have become more specific, Altvater-Mackensen, Reference Altvater-Mackensen2010).
Even after 25 months of age, however, considerable developments take place. Walley and Flege (Reference Walley and Flege1999) report a study in which a group of five- and nine-year-old English-speaking children and adults were asked to identify stimuli on native and non-native vowel continua. The slopes of participants’ vowel identification functions were shallowest for the five-year-old children and became increasingly steeper with age, especially for the native continuum. These findings show that subtle, but considerable, improvements are made even after the age of five. Furthermore, Hazan and Barrett (Reference Hazan and Barrett2000) asked children from different age groups (6;0–7;6 (group 1), 7;6–9;6 (2), 9;6–10;6 (3), 10;6–11;6 (4), and 11;6–12;6 (5)) and adults to perform phoneme categorization tasks involving synthetic continua between different consonants. Although children's performance increased with age, the 12-year-old children (i.e., group 5) did not categorize the phonemic contrasts as consistently as the adults. As the authors point out (Hazan & Barrett, Reference Hazan and Barrett2000, p. 393), these results are in line with an earlier study by Parnell & Amerman (Reference Parnell and Amerman1978), who reported that children aged 11–12 years (with a mean age of 11;3) performed similarly to adults in terms of phoneme identification accuracy, but were slightly less consistent than adults in their responses when multiple instances of the same acoustic stimulus item were presented.
Developmental changes in perception, however, extend even beyond childhood. Adults have been reported to outperform 14–15-year-olds (age range: 14;0–15;11) on a consonant identification task in non-words degraded by noise and reverberation (Johnson, Reference Johnson2000). Some studies have even reported differences in performance on a plosive voicing contras between children in the age range between nine and 17 years, and adults (Flege & Eefting, Reference Flege and Eefting1986). Taken together, the results of these studies suggest that children and young adolescents differ from adults in their speech sound perception and word recognition of L1.
These observations are important because the gradual development of speech perception in the L1 has been argued to result in considerable influences on the development of an L2 system. Flege's (Reference Flege and Strange1995, Reference Flege and Birdsong1999) Speech Learning Model of native and non-native perception describes how speech sound representations develop, focusing especially on the interplay between phoneme categories in the L1 and L2. This model describes how speech sound category development in the L2 is influenced by the restructuring of the phonetic space that has taken place in the L1. Research on adults supports this view as adults commonly have considerable difficulties with non-native contrasts (e.g., Aoyama, Flege, Guion, Akahane-Yamade & Yamada, Reference Aoyama, Flege, Guion, Akahane-Yamade and Yamada2004; Broersma, Reference Broersma2005; Escudero, Broersma & Simon, published online July 11, Reference Escudero, Broersma and Simon2012). A large number of studies have shown that adult non-native speakers can have difficulty distinguishing between words containing non-native contrasts. For example, eye-tracking experiments and lexical decision tasks have shown that native Japanese speakers’ recognition of words containing the non-native /r/–/l/ contrast (e.g., lock–rock) is hindered by lexical competition between minimal pair members (e.g., Cutler & Otake, Reference Cutler and Otake2004; Cutler, Weber & Otake, Reference Cutler, Weber and Otake2006; see also Goto, Reference Goto1971). Similarly, native speakers of Spanish performing a Dutch word learning task have been reported to have lower performance on the recognition of minimal pairs of non-words involving non-native vowel contrasts than on pairs involving native contrasts (Escudero et al., published online July 11, Reference Escudero, Broersma and Simon2012). Moreover, even highly proficient bilinguals do not always achieve native phoneme perception (Sebastián-Gallés, Echeverría & Bosch, Reference Sebastián-Gallés, Echeverría and Bosch2005).
The literature discussed here demonstrates that L1 exposure has a strong influence on the potential acquisition of L2 speech sound contrasts, and that this influence is gradual, in the sense that it may be stronger or weaker depending on learner and context factors (Flege, Reference Flege and Strange1995, Reference Flege and Birdsong1999). Because of these gradual influences of L1 phonology on L2 phonology, it is unclear how the phonological systems of children's L1 and L2 interact in the early stages of second language acquisition, especially when second language exposure only takes place relatively late in childhood. The current study focuses on the speech sound representations in a group of children with ages between nine and 12 years. This is an important stage in development because it is around this age that Dutch-speaking children in Flanders engage in the first stages of school-based education on English. Importantly, most children will have been exposed to small amounts of English throughout their lives through, for instance, media. This combination of informal exposure and the early stages of L2 education make the amount and type of experience at this age rather unclear. However, this type of second language learner of English constitutes a significant, if not the largest, portion of L2 learners of English in Flanders and The Netherlands (as well as in many traditional “English as a Foreign Language” countries, including many European countries). The interaction between L1 and L2 phoneme representations at this age is bound to have a strong influence on the future development of L2 phonology.
With respect to children in the specific age group that was tested here (9–12-year-olds), data by Flege, Munro and MacKay (Reference Flege, Munro and MacKay1995) show that Italian adults who immigrated to Canada between the ages of nine and 12 years still have an advantage in terms of perceived foreign accent over individuals who immigrated at a later age. This shows that around the age of 9–12 years, the production (and presumably perceptual) systems are still relatively plastic. At the same time, the data presented by Flege et al. (Reference Flege, Munro and MacKay1995) also show that only a small part of this group eventually managed to attain native-like pronunciation when rated for perceived foreign accent later in life. This shows that the language systems of children in this age range have undergone changes that prevent these children from acquiring native-like skills in an additional language.
This study used a mispronunciation-detection task to measure L1 and L2 speech perception. Specifically, we investigated whether 9–12-year-old native speakers of Dutch reject words in which the vowel is mispronounced in Dutch and in English. The mispronunciation-detection task has been successfully applied by, for instance, Mani and Plunkett (Reference Mani and Plunkett2007), to reveal the phonological specificity of vowels in lexical representations. Unlike Mani and Plunkett, however, we used overt responses as the dependent variable (rather than gaze). If listeners have a detailed and solid phonological representation of a particular vowel, then a familiar lexical item in which this vowel is replaced by another vowel will be rejected, because there is a mismatch between the perceived phonetic realization and the vowel's stored phonological representation. Two specific aims can be identified. First, in Experiment 1, we investigated to what extent children reject mispronounced words as “incorrect” in a metalinguistic judgment task in their native language. On the basis of previous studies discussed above, we expected that 9–12-year-old children have built well-developed representations for the sounds of their native language. Moreover, their lexical representations contain specific representation of these phonemes and so we predicted that they would generally be able to detect mispronunciations in their native language. The comparison between the child and the adult groups will provide insight into where these school-age children are on the developmental track to proficient adult performance in their L1.
Second, in Experiment 2, we investigated how much detail children's representations of non-native words contain and whether children are sensitive to changes in vowel substitutions involving contrasts which do or do not occur in their native language. Two factors could contribute to potential errors in such a task. First, children's phonological system has already been tailored to their native language. It is therefore expected that the children are, to some extent, insensitive to a number of important L2 contrasts which do not occur in their native language. The small amount of exposure that they have had to English vowels might thus have caused those phonetic forms to have been mapped onto their L1 phonemic representations. Second, children's L2 lexicons might not contain sufficient detail about particular words to reject mispronunciations, i.e., a child might just be unsure whether a certain word should be pronounced with /ɛ/ or with /ɪ/. In infant research a similar account of the lack of sensitivity to certain phoneme substitutions has been proposed (Swingley & Aslin, Reference Swingley and Aslin2002): their lexical representations could be un(der)specified. These un(der)specified word forms can exist, because infants’ or toddlers’ lexicons are small and hence contain fewer minimal pairs than adults’ lexicons (though see Swingley & Aslin, Reference Swingley and Aslin2000, who did not find evidence that 18–23-month-old children's performance on a mispronunciation task was related to their vocabulary size).
Besides addressing these two main issues, the current investigation also aims to contribute to our understanding of an interesting recurrent finding. In infant vowel perception, a group for which the role of the mental lexicon is limited, asymmetries in the perception of phoneme pairs have been observed in a large number of studies (Best & Faber, Reference Best and Faber2000; Bohn & Polka, Reference Bohn and Polka2001; Polka & Bohn, Reference Polka and Bohn1996; Polka & Werker, Reference Polka and Werker1994; Slobodan, Kiss, Morse & Leavitt, Reference Slobodan, Kiss, Morse and Leavitt1978), reviewed in Polka and Bohn (Reference Polka and Bohn2003, Reference Polka and Bohn2011). Polka and Bohn (Reference Polka and Bohn2003) found that both English and German infants showed the same perceptual asymmetries. For German /u/–/y/, both groups detected a change from /y/ to /u/ more easily than a change in the opposite direction. For English /ɛ/–/æ/, a change from /ɛ/ to /æ/ was more easily detected than one from /æ/ to /ɛ/ in a discrimination task. Polka and Bohn (Reference Polka and Bohn2003) propose that these as well as nearly all of the asymmetries reported in the studies mentioned above can be explained by referring to the location of the vowels in the vowel space. Specifically, changes from more central to more peripheral vowels are more easily discriminated than changes from more peripheral to more central vowels. They argue that peripheral vowels act as natural referent vowels – and introduce this approach as the NRV (Natural Referent Vowel) framework – which attract the listener's attention and provide stable perceptual forms (Polka & Bohn, Reference Polka and Bohn2003, Reference Polka and Bohn2011). It remains an open question, however, whether asymmetries are related to phonological representations in the mental lexicon, or whether such asymmetries are phonetic in nature.
Directional asymmetries have not only been reported to occur in listeners’ native language, but also in non-native languages. Polka and Bohn (Reference Polka and Bohn2011) report on a study in which adult native Danish listeners were presented with sequences of four /dVt/ syllables, in which the vowel was either Southern British English (SBE) /ɒ/ or SBE /ʌ/ in all four tokens, or in which a change occurred from /ɒ/ to /ʌ/, or vice versa. The SBE contrast /ɒ/–/ʌ/ is absent in Danish, which has no contrast in that area of the vowel space. In line with the NRV framework, they found that changes from more central /ʌ/ to more peripheral /ɒ/ were more frequently detected than changes in the opposite direction in a go/no go discrimination task in which participants had to respond by indicating for each trial whether the vowel in a sequence of four /dVt/ syllables had changed or not. Similarly, English adults were tested on the German /u/–/y/ and /ʊ/–/ʏ/ contrast in /dVt/ syllables and again changes from the more central vowels /y/ and /ʏ/ to the more peripheral /u/ and /ʊ/ were more easily detected. This asymmetry was not observed for a group of native German listeners, who did not make errors in either direction. In this study, we will compare the results of the non-native mispronunciation task (Experiment 2) to the specific predictions of the NRV framework to examine potential patterns of asymmetries in school-age children.
In order to address these research questions, a group of Dutch-speaking children and a group of adults performed Dutch and English mispronunciation-detection tasks (Experiments 1 and 2). A third task (Experiment 3) consisted of a Four-Interval-oddity (4I-oddity) discrimination task involving the vowel contrasts used in Experiment 2. The latter experiment was conducted because the potential acceptance of mispronounced words involving a non-native vowel contrast in Experiment 2 could be attributed either to underspecified lexicons and/or phonological representations or to the listeners’ failure to discriminate between the vowels involved in the first place.
We investigated to what extent 9–12-year-old children, who have only a limited vocabulary in English and have not received any formal pronunciation training, will accept more mispronunciations of familiar English words than experienced L2 adult learners. These children were expected to perform worse when performing in an English experiment compared to a Dutch one, since it is hypothesized that the 9–12-year-old children in this study have not yet built fully distinct categories for contrastive L2 sounds.
Experiment 1: Dutch
Participants
The participants were 26 monolingual native speakers of Dutch, aged between nine and 12 years, recruited in three schools in Flanders. The school heads and teachers reported that none of the children had any hearing deficits or learning or concentration difficulties. Ten children were recruited in the East-Flemish dialect region, the remaining 16 in the Brabant area. A control group of sixteen 18–20-year-old adult monolingual native speakers of Dutch also performed the experiment. Eight of them came from the East-Flemish dialect area, the remaining eight came from the area of Brabant.
Materials
Auditory stimuli
All stimuli were monosyllabic Dutch words, which were either unaltered or changed; in the latter case the target vowel was replaced by another vowel. The experiment consisted of two parts: a part focusing on the Dutch front vowels (Part 1) and a part focusing on the Dutch back vowels (Part 2). The Dutch vowel inventory is provided in Appendix A, Table A, which can be consulted online in the supplementary materials.
In Part 1 of the experiment the focus was on four Dutch vowels, /ɛ, ɪ, ʏ, y/, which can be characterized as front to front-central vowels. The stimuli were organized in four lists: each word occurred with the target vowel in one of the lists and with either of the three non-target vowels in the remaining three lists. As a result, the experiment consisted of four versions and children were randomly assigned to one of these versions. In total, 112 target words and 16 filler items were recorded for the four versions of Part 1.
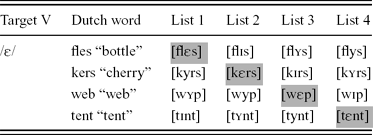
Part 2 of the experiment focused on the three Dutch back vowels, /u, o, ɔ/, and the front vowel /i/.Footnote 1 As in Part 1, each of the four vowels occurred in eight Dutch words, except for the vowel /y/, for which only four depictable words could be used. Again, the stimuli were organized in four lists. In total, 128 target words and 12 filler items for Part 2. Table 1 presents examples of the stimuli. Shaded cells include tokens which contain the Dutch target vowel.Footnote 2
Examples of stimuli in the Dutch experiment (Experiment 1).

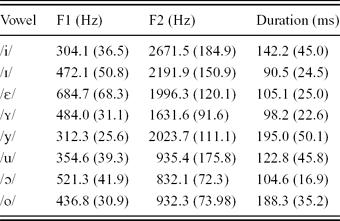
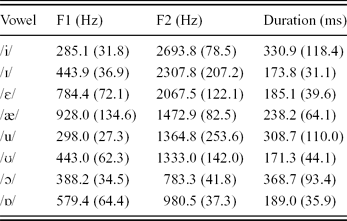
By replacing the vowels in the existing target words, the target stimuli that were created were mostly non-words (189/240), such as tunt [tʏnt], but some existing words could not be avoided (51/240). These existing words then did not match with the picture. For instance, the vowel in the target Dutch word kurk [kʏrk] “cork” was replaced by the vowel [ɛ], leading to the existing Dutch word kerk [kɛrk] “church”. However, the audio stimulus [kɛrk] was presented with the picture of a cork, and not with the picture of a church, so that the expected response was that the word was pronounced incorrectly, i.e., with the wrong vowel. The stimuli were read at a comfortable speaking rate by a female native speaker of Dutch. The recordings were made with a Marantz Professional solid state recorder (PMD620), with a Sony condenser microphone (ECM-MS907) placed on a stand. All stimuli were read and recorded twice, but only the repetitions were used for the experiment. Table 2 presents the average first format (F1), F2 and duration values of the vowels in the stimuli.Footnote 3
Mean F1, F2 (in Hz) and duration (in ms) values of experimental stimuli per vowel (standard deviations in parentheses).
Visual stimuli
All pictures were black-and-white line drawings. Most pictures were taken from a picture database. If the picture was not available in this database it was either drawn by the experimenter (e.g., number words) or taken from the web and adjusted in size.
Procedure
Listeners were individually tested in a quiet room in their school, with no other person present besides the experimenter. They were seated in front of a computer screen and were presented with a picture of an object followed after 1500 ms by an audio stimulus. They were instructed to judge whether the word they heard was pronounced “correctly” or “incorrectly” and were asked to provide their response by pressing a blue button marked “juist” (“right”), or a red button marked “fout” (“wrong”) on an RB-730 response pad. All instructions were provided orally in Dutch prior to the experiment and also appeared in written form on the screen at the beginning of the experiment. If children signaled that they had understood the task after the instructions, they could start with the experiment. The first three items were practice trials which were played over the speakers of the computer. Listeners were asked to focus on the vowel in each word, ignoring the consonants, and to respond as quickly and accurately as possible. The remainder of the stimuli were presented binaurally over Bose headphones at a comfortable listening level.
Design
The experiment was supported by SuperLab 4.0. It started with written instructions, followed by three practice trials. The practice trials consisted of a word that was pronounced correctly in Dutch (boom [boːm] “tree”, presented with the picture of a tree; correct response: “right”), a word that was pronounced with a vowel substitution leading to a Dutch non-word (verk [vɛrk], presented with the picture of a fork (vork [vɔrk]); correct response: “wrong”) and a word that was pronounced with a vowel substitution leading to a Dutch word other than the one depicted on the screen (dier [diːr] “animal”, presented with the picture of a door (deur [dør]); correct response: “wrong”).
After the practice trials, four experimental blocks were presented, with optional breaks in-between. Trials were automatically randomized for each listener within each block. Blocks A and B, containing the front vowel stimuli, consisted of 20 trials each, of which 14 were target trials (4 × vowel /ɪ, ɛ, ʏ/ and 2 × vowel /y/) and six were fillers. Blocks C and D, containing the back vowel stimuli, consisted of 24 trials each, of which 16 were target trials (4 × vowel /u, o, ɔ, i/) and 8 were fillers. Within each block, four target items were presented with the correct vowel (each vowel once) and 10 (Blocks A and B) or 12 (Blocks C and D) with an incorrect vowel. Filler items with correct vowels were inserted in order to ensure that within each block the number of expected “correct” and “incorrect” responses was the same.
Results
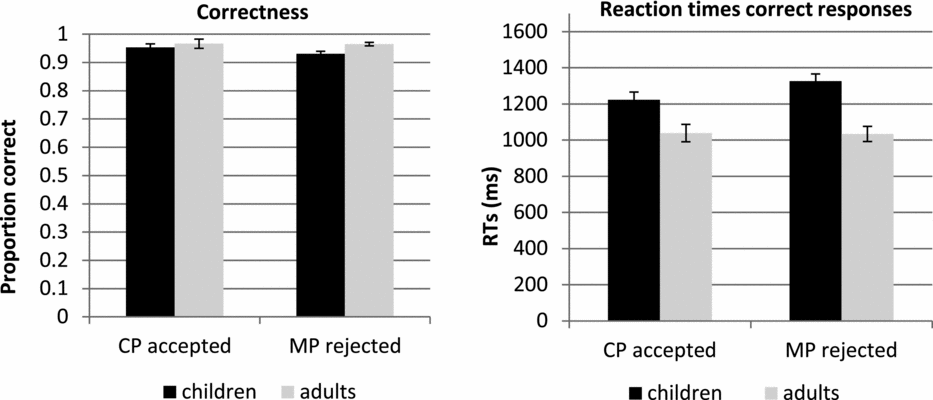
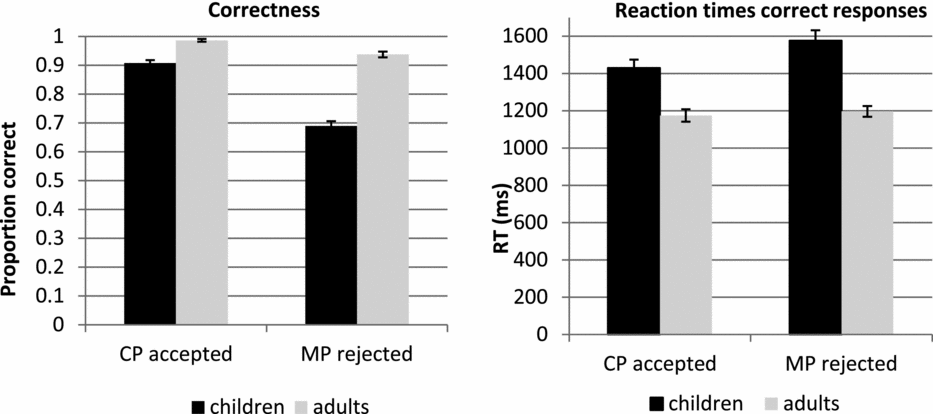
Data were analyzed using repeated-measures ANOVAs. For the analyses proportion correct data were logit transformed (values of 1 and 0 were remapped to .975 and .025 respectively before transformation). Reaction Time (RT) data were log-transformed. The left panel of Figure 1 presents the proportion of correct responses to correctly pronounced words (CPs) and to mispronounced words (MPs). The right panel displays the reaction times to both CPs and MPs.
Experiment 1: Dutch materials. Proportion of correct responses to CPs and MPs (left panel) and RTs (measured from sound onset) of correct responses to CPs and MPs (right panel), with indication of the standard error of the mean.
With respect to the proportion of correct responses, the results showed that these were very high, i.e., over 90%, for both CPs and MPs.Footnote 4 Since neither children or adults performed significantly differently on front versus back vowels, all vowels were analyzed together (Place: F1(1,40) = 0.486, p = .490; F2(1,58) = 0.643, p = .426; Place × Age: F1(1,40) = 1.295, p = .292; F2(1,58) = 5.582, p = .022; Age: F1(1,40) = 8.518, p = .006; F2(1,58) = 21.052, p < .001).
The analyses revealed a significant effect of Age (F1(1,40) = 6.557, p = .014; F2(1,31) = 143.984, p < .001), indicating that children gave more incorrect responses overall than adults. A small effect was observed for the comparison between proportion correct on the CPs versus the MPs (F1(1,40) = 5.548, p = .023; F2(1,31) = 45.704, p < .001) indicating more correct responses on CP items. No interaction was found between the factor Age and CP vs. MP (F1(1,40) = 0.330, p = .569; F2(1,31) = 14.028, p = .001).
In the analyses of RTs a significant effect was found for the factor Age (F1(1,40) = 20.257, p < .001; F2(1,31) = 144.931, p < .001), indicating that children were overall slower than adults. A just-non-significant effect for CP vs. MP was observed, reflecting only a trend for responses to MPs to be slower than responses to CPs (F1(1,40) = 2.919, p = .095; F2(1,31) = 2.949, p = .096). There was no significant interaction between Age and CP vs. MP (F1(1,40) = 2.749, p = .105; F2(1,31) = 5.933, p = .021).
Discussion
We aimed to answer the question to what extent children reject mispronunciations of words in their native language, and to what extent they may differ from adults in this respect. Children rejected over 90% of all mispronunciations, suggesting that by that age they have indeed built sufficiently contrasting phonological categories for contrasting L1 sounds. Moreover, their lexical representations contain enough phonemic detail to detect mispronunciations of a single vowel. However, although both adults and children responded correctly on the majority of trials, children were overall slower than adults. These longer reaction times are likely to result from children's lower familiarity with test settings such as the ones in this study and they may still have less well-developed motor skills than adults.
Additionally we found that both adults and children accepted a number of vowel substitutions as correct pronunciations (i.e., they did not score a 100% correct). This could be the result of familiarity with regional varieties of Dutch. Vowels are known to display relative extensive variability across speakers (Peterson & Barney, Reference Peterson and Barney1952). Furthermore, there is considerable dialectal variation in the realization of vowels in Dutch (Adank, van Hout & Van de Velde, Reference Adank, van Hout and Van de Velde2007). Words for which the substituting vowel can, in some dialects, be the phonetic realization of the target vowel phoneme, may therefore potentially be accepted by children as well as by adults. Previous research has shown that two sounds are judged to be more similar by listeners in whose language these sounds are allophones of the same phoneme, compared to listeners in whose language the sounds represent different phonemes. Babel and Johnson (Reference Babel, Johnson and Warren2010) set up a similarity rating experiment and found that native speakers of Dutch, in which [s] and [ʃ] often alternate as allophones of /s/, perceived the phonetic distance between [s] and [ʃ] to be smaller than native American English speakers, for who these sounds represent two distinct phonemes. If, in the present study, two Dutch phonemes were, in some dialects, allophones of the same phoneme (e.g., /ɛ/ can be realized as [ɛ] or as [ɪ]), then these allophones would have been perceived as being very similar and substitutions of /ɛ/ by /ɪ/ or vice versa would have been accepted by some listeners.
On most trials, however, listeners correctly rejected mispronunciations. If children accept mispronounced L2 English words in Experiment 2, this is probably the result of either underspecified lexical representations of L2 words or of a failure to distinguish between the non-native phonemes. Furthermore, this Experiment also demonstrates that children of this age understood the task and were as such able to perform very well with materials in their own language. This warranted the use of this design in Experiment 2.
Experiment 2: English
Participants
The participants from Experiment 1 also participated in Experiment 2. All children had a very basic knowledge of English. As English is pervasive in the media, they had come into contact with English through the internet, television and radio, and had picked up some common words and expressions. While no independent measure of participants’ English proficiency was taken, frequent one-to-one sessions between the experimenter and the children in the context of a one-year-long research project made it clear that none of the children could express themselves or conduct a basic conversation in English. Nineteen out of 26 children reported never to have been in an English-speaking country; seven children had spent one or two holidays (min. two days, max. four weeks) in the United Kingdom or the United States. In order to decide on the English words that could be used as stimuli in the English experiment, all children participated in a receptive vocabulary test prior to their participation in Experiment 2. Children ranged from 65% correct to 97% correct (mean 80%). (Further details on this test can be found in Appendix B, which can be consulted in the supplementary materials online).
There were also some differences in the amount of English instruction that the children had received in school. While English is not part of the curriculum in Dutch primary schools in Flanders, 16 of the 26 children had received some introductory English classes. Ten children had not received any instruction, ten had received about ten hours of content-based English learning at the time of testing and six had been exposed to English in school since the age of four, but only half an hour a week by a non-native speaker (mostly songs and games). Although the amount of instruction in school tended to have a slight effect on the children's performance, neither dialectal background nor amount of instruction significantly affected the results. No difference in overall proportions correct were found among children when split over Dialect (F1(1,24) = 0.039, p = .845; F2(1,31) = 0.051, p = .823), or when split over Instruction group (F1(2,23) = 0.799, p = .462; F2(2,62) = 2.503, p = .090). Therefore, the data were pooled for further analyses.
The control group of 16 Dutch-speaking adults was the same as in Experiment 1. They were all second or third year university students of English and were competent speakers of English. All had received between two and four hours of English classes a week for five or six years in secondary school. Although they were not tested on their English proficiency in the framework of this study, students are expected to have at least level B2 (“upper intermediate”) for English in the Common European Framework of Reference for Languages (scores range from A1, lowest proficiency, to C2, highest proficiency) when they enter university (Council of Europe, 2012). They had also all completed English proficiency courses during their first year. Four of them had spent some time in the United Kingdom (ranging from one week to six months in total); the remaining 12 had never been in an English-speaking country. The adults did not take the vocabulary test, as it was assumed that the very basic English words familiar to the children and included in Experiment 2 would also be known by the adult students of English. A just-not-significant effect of Dialect on overall proportion of correct scores was observed for the adults (F1(1,14) = 4.515, p = .052; F2(1,31) = 7.455, p = .010, reflecting a numerically higher score for the participants from the Brabant dialectal region). However, for further analyses these data were collapsed.
Materials
Auditory stimuli
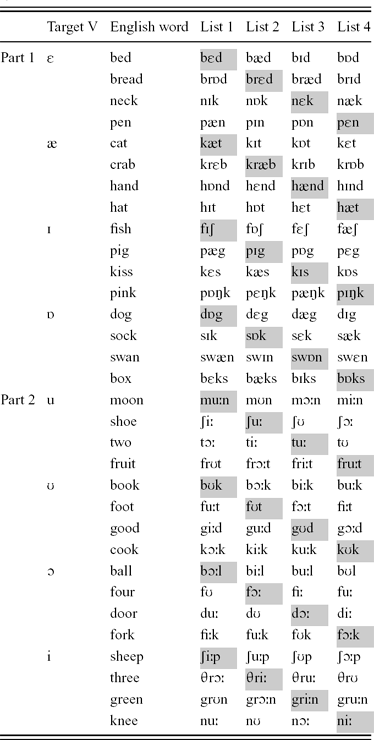
All stimuli were monosyllabic English words which were either unaltered or in which the target vowel was replaced by another English vowel.Footnote 5 The experiment again consisted of two parts: a part focusing on the English front vowels (Part 1) and a part focusing on the English back vowels (Part 2). (The English vowel inventory can be consulted in the online supplementary materials, Appendix A, Table A.) In Part 1 of the experiment the focus was on three English front vowels, /ɪ, ɛ, æ/, contrasted with one back vowel /ɒ/. Part 2 focused on three back vowels, /ɔ, u, ʊ/, contrasted with one front vowel /i/. Each of these vowels occurred in four English words. As in Experiment 1, the stimuli were organized in four lists: each word occurred with the target vowel in one of the lists and with each of the three non-target vowels in the remaining three lists. However, as a result of the limited English vocabulary of the young participants (see the Participants section above), one list contained only 16 tokens belonging to the front vowel experiment (4 vowels × 4 tokens) and 16 belonging to the back vowel experiment. As a result, rather than presenting each informant with just one of the four lists, each participant was presented with two of the four lists in a first experiment (lists 1 and 2) and with the remaining two lists in a second experiment (lists 3 and 4), conducted in separate sessions. Table 3 presents all stimuli. Shaded cells include tokens which contain the English target vowel.
Stimuli in the English experiment (Experiment 2).
As can be seen in Table 3, the list of stimuli contained five tokens which are phonotactically illegal in English, namely those with an open syllable ending in a lax vowel: shoe, two, door, three and knee in which the vowel was replaced by [ʊ]. Since CV syllables with lax vowels are also illegal in Dutch, a possible confound may arise with these items when listeners reject the mispronounced words on the basis of the illegal syllable structure rather than on the basis of the vowel. However, they can only do this, if they notice that the syllable structure is illegal, i.e., when the phonetic realization of the words does not match the stored phonological representations. Because of the limited English vocabulary of the children some non-words with illegal structures could not be avoided, but were kept to a minimum.
In total, 64 target words and 16 filler items were recorded for the four lists of Part 1 (“front vowels”) and the same number of targets and fillers for Part 2 (“back vowels”). The stimuli were read at a comfortable speaking rate by a female native speaker of British English. British English rather than any other variety of English was chosen, as it is still largely the model in Flemish secondary schools and universities, even though American English is pervasive in the media. Recording procedures were identical to those in Experiment 1.Footnote 6Table 4 presents the mean F1, F2 and duration values of the vowels in the English stimuli.Footnote 7 The procedure for measuring the formants and durations was the same as in Experiment 1 (see footnote 3 above).
Mean F1, F2 (in Hz) and duration values (in ms) of experimental stimuli per vowel (standard deviations in parentheses).
Visual stimuli
As in Experiment 1, the pictures were black-and-white line drawings, taken from a database, drawn or taken from the web and adjusted in size and color.
Procedure
The same procedure as in Experiment 1 was followed, with the only difference that the experiment was split into two parts: one part containing lists 1 and 2; the other containing lists 3 and 4 (see above). This was done in order to restrict the time needed to complete the experiment, so as to ensure maximal attention. There were about four weeks between the two parts of the experiment.
Design
The experiment was supported by SuperLab 4.0. It started with written instructions, followed by three practice trials. As in Experiment 1, the practice trials contained a word that was pronounced correctly in English (boy [bɔɪ]), a word that was pronounced with a vowel substitution leading to an English non-word (opple [ɒpl]) and a word that was pronounced with a vowel substitution leading to an English word other than the one depicted on the screen (heat [hiːt], presented with the picture of a heart ([hɑːt]).
After the practice trials, four experimental blocks were presented, with optional breaks in-between. Trials were automatically randomized for each listener within each block. Blocks A and C, containing the front vowel stimuli of lists 1 and 2, or 3 and 4, consisted of 24 trials each, of which 16 were target trials (4 × vowel /ɪ, ɛ, æ, ɒ/) and 8 were fillers. Blocks B and D, containing the back vowel stimuli, also consisted of 24 trials each, again with 16 target trials (4 × vowel /u, ʊ, ɔ, i/) and eight fillers. Within each block, four target items were presented with the correct vowel (each vowel once) and 12 with an incorrect vowel. Filler items with correct vowels were inserted in order to ensure that within each block the number of expected “correct” and “incorrect” responses was the same.
Results
Figure 2 presents the proportion of correct responses to correctly pronounced words (CPs) and to mispronounced words (MPs) (left) and the reaction times to both CPs and MPs (right). All words of which individual participants did not know the meaning in the vocabulary pre-test were removed for the analyses.
Experiment 2: English materials. Proportion of correct responses to CPs and MPs (left panel) and RTs (measured from sound onset) of correct responses to CPs and MPs (right panel) with indication of the standard error of the mean.
The proportion of accepted CPs was significantly greater than the proportion of rejected MPs (F1(1,40) = 99.166, p < .001; F2(1,31) = 45.704, p < .001). Children made more errors in general than adults (F1(1,40) = 166.180, p < .001; F2(1,31) = 143.984, p < .001). An interaction was found between Age and TargetCode (F1(1,40) = 6.202, p = .017; F2(1,31) = 14.028, p = .001). This warranted a breakup over Age groups. Children had a significant effect of TargetCode (F1(1,25) = 116.930, p < .001; F2(1,31) = 50.442, p < .001), reflecting more errors on MPs than on CPs. The same pattern was observed for the adults (F1(1,15) = 18.504, p = .001; F2(1,31) = 15.528, p < .001).
The RT data revealed a significant effect for Age (F1(1,40) = 28.253, p < .001; F2(1,31) = 144.931, p < .001), reflecting the fact that adults were faster, but a non-significant effect for TargetCode (F1(1,40) = 18.532, p < .001; F2(1,31) = 2.949, p = .096), indicating only a trend for responses to CPs to be faster than those to MPs. A significant interaction warranted the breakup between the age groups (F1(1,40) = 6.742, p = .013; F2(1,31) = 5.933, p = .021). The children had significantly longer RTs for MPs than for CPs (F1(1,25) = 28.748, p < .001; F2(1,31) = 8.222, p = .007), i.e., they were slower in responding to MPs than to CPs. Adults revealed no effect for TargetCode (F1(1,15) = 1.379, p = .259; F2(1,31) = 0.319, p = .577).
The following analyses focus on MPs only. If 9–12-year-old children rely on their L1 phonology to access L2 lexical items, we expect them to accept more MPs for items that contain L2 contrasts that do not occur in their L1. For this analysis, we focus on a subset of four specific vowel pairs:
(a) native contrasts: /ɛ/–/ɪ/ and /u/–/ɔ/
(b) non-native contrasts: /ɛ/–/æ/ and /u/–/ʊ/
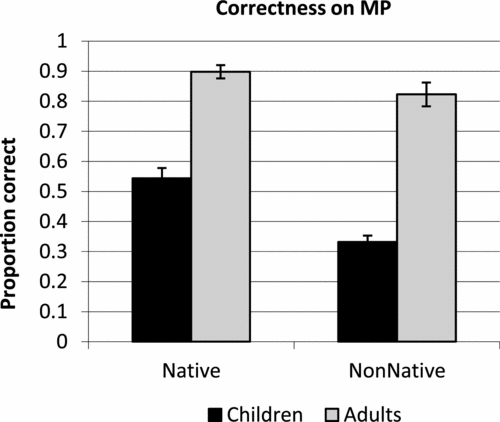
The vowels in (a) also form a contrast in Dutch, those in (b) do not: Dutch has /ɛ/, but not /æ/, and /u/, but not /ʊ/. Figure 3 presents a comparison across these selected pairs between the correctness of responses to MPs (correct rejections) involving native and those involving non-native contrasts by children and adults.
Proportion of correct responses to English MPs: native (left bars) versus non-native (right bars) contrasts.
A first analysis involved the fixed effects Native Contrast and the factor Age. Listeners had significantly more correct rejections of MPs that involve phonemes from their native language than phoneme pairs that do not occur in their native language (F1(1,40) = 22.213, p < .001; F2(1,30) = 5.389, p = .027). In addition, adults more often correctly rejected MPs than children, for native and non-native contrasts together (F1(1,40) = 111.372, p < .001; F2(1,30) = 100.048, p < .001). There was no interaction between Age and Native–Non-native (F1(1,40) = 7.419, p = .010; F2(1,30) = 1.305, p = .262).
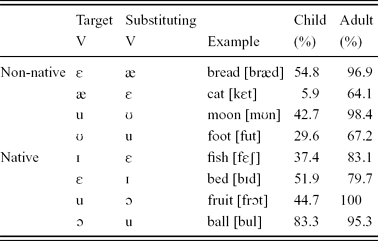
Table 5 presents the proportion of correct responses to MPs for the four vowel pairs mentioned above. In the following analyses a test was performed per pair (i.e., in both directions) to investigate asymmetries in the acceptance of mispronunciations. The analyses included the fixed effects Age and Vowel (indicating the identity of the correct vowel). With respect to the /ɛ/–/æ/ pair, the results revealed that the proportion of rejection of MPs by the children is lower than that for adults (F1(1,40) = 69.953, p < .001; F2(1,6) = 162.381, p < .001). Interestingly, there was a significant asymmetry in the proportion of rejection of MPs depending on the target vowel: if /ɛ/ was substituted by /æ/, as in bread produced as [bræd], the word was rejected significantly more frequently than if /æ/ was substituted by /ɛ/, as in cat realized as [kɛt] (F1(1,40) = 63.379, p < .001; F2(1,6) = 40.674, p = .001). There was, however, no interaction between Vowel and Age, indicating that the same asymmetry holds for children as well as for adults (F1(1,40) = 1.054, p = .311; F2(1,6) = 0.820, p = .400).
Proportion of correct responses to mispronounced words for native and non-native contrasts (in %) for the selected vowel contrasts.
For the /u/–/ʊ/ pair, a similar pattern arises. Adults made more correct rejections in general (F1(1,40) = 91.191, p < .001; F2(1,6) = 37.794, p = .001). Substitutions of /u/ by /ʊ/ were more often rejected than substitutions of /ʊ/ by /u/ (F1(1,40) = 18.804, p < .001; F2(1,6) = 7.016, p = .038). The interaction between the factors Vowel and Age was just-non-significant (F1(1,40) = 3.589, p = .065; F2(1,6) = 7.016, p = .038).
With respect to the native contrasts, for the vowel pair /ɪ/–/ɛ/, the results show that the proportion of correct responses is fairly low for the children and significantly higher for the adults (F1(1,40) = 41.931, p < .001; F2(1,6) = 11.891, p = .014). There was no effect of vowel pair (F1(1,40) = 1.099, p = .301; F2(1,6) = 0.158, p = .705), and no interaction between Vowel and Age (F1(1,40) = 2.134, p = .152; F2(1,6) = 0.438, p = .532).
For the vowel pair /u/–/ɔ/, the adults again performed significantly better than the children (F1(1,40) = 43.012, p < .001; F2(1,6) = 42.630, p = .001). Because adults performed at ceiling in one of the conditions (resulting in artificial variance estimates) no further tests containing the adult group were reported. For the subset of children there is an asymmetry: substitutions of /ɔ/ by /u/ were correctly rejected more frequently than substitutions of /u/ by /ɔ/ (F1(1,25) = 13.026, p = .001; F2(1,6) = 7.701, p = .032). Although no test was performed it should be noted that, surprisingly, the numerical effect was in the opposite direction for the adults.
Discussion
The aim of this second experiment was to examine to what extent children have established correct phonemic categories for L2 lexical items. This was investigated by examining the extent to which they rejected mispronunciations of familiar L2 words. 9–12-year-old Dutch-speaking children accepted more mispronunciations than advanced adult L2 learners. Children accepted more words as “correct” when the target vowel was substituted by another vowel than adults, and were also slower to respond to mispronunciations than to correct pronunciations, and slower than adults in general. In a further analysis we focused on four English vowel pairs: the contrasts /ɪ/–/ɛ/ and /u/–/ɔ/ (shared with L1), and the non-shared contrasts /ɛ/–/æ/ and /u/–/ʊ/. Participants performed better on L2 contrasts that also occur in the L1 than on contrasts that do not. This suggests that the 9–12-year-old children had failed to build separate phonological categories for non-contrastive L2 sounds.
The close analysis of the four vowel pairs also showed that there were asymmetries in the direction in which vowel substitutions were rejected. For the non-native contrasts /ɛ/–/æ/ and /u/–/ʊ/ there was a tendency for both children and adults to accept more mispronunciations when the substituting sounds were /ɛ/ and /u/, respectively. Thus, mispronunciations were more often noticed when a non-native phoneme (e.g., /æ/) occurred in an L2 word that, in its target form, contains a phoneme that is shared between L1 and L2 (e.g., /ɛ/) than when the substitution is in the other direction (e.g., native /ɛ/ in a target /æ/-word). However, an asymmetry was also observed for the native pair /u/–/ɔ/, for which children accepted more mispronunciations when the substituting sound was /u/ than when it was /ɔ/. The nature of the asymmetries will be further discussed in the “General discussion” section below. In sum, children differed from adults in the quantity of the errors in that they accepted more mispronunciations than adults. Qualitatively, however, the error patterns were very similar for the two age groups.
It remains unclear, however, to what extent the patterns presented here were due to listeners’ potential inability to auditorily distinguish between the sounds that were used. In Experiment 3 we tested the discriminability of the pairs of sounds that were used in Experiment 2 by means of a 4I-oddity task.
Experiment 3
Participants
The child participants in Experiment 3 also performed Experiments 1 and 2. Experiment 3 was not carried out by the adults.Footnote 8
Materials
The task was a 4I-oddity task. In this task listeners heard a sequence of four sounds (or words) of which one is deviant. The deviant sound can occur either in second or in third position (e.g., AABA vs. ABAA). Participants were asked to indicate which is the odd one out. An advantage of the 4I-oddity task is that it is unbiased: because participants have to choose between two options: “2” vs. “3”, they cannot adopt an inherently conservative or liberal strategy. The task consisted of two parts, performed by the participants in two different sessions, and focused on the same vowels as Experiment 2. In the first part of the experiment the focus was on three English front vowels, /ɪ, ɛ, æ/, contrasted with one back vowel /ɒ/. The second part focused on three back vowels, /ʊ, u, ɔ/, contrasted with one front vowel /i/. The stimuli consisted of 16 monosyllabic English words with a /hVd/ frame, in which each of the eight vowels was inserted (i.e., hid, head, had, hod, hood, who'd, hawed, heed). The inter-stimulus interval (ISI) was 0.3 seconds and the inter-trial interval (ITI) 0.5 seconds. The stimuli were produced by a female native speaker of British English, who also produced the stimuli in Experiment 2. The words were recorded three times with a Marantz Professional solid state recorder (PMD620), with a Sony condenser microphone (ECM-MS907) placed on a stand. In each sequence of four words presented to the participants, the three instances of the same vowel were acoustically different tokens.
Procedure
Listeners were individually tested in a quiet room in their school, with no other person present besides the experimenter. They were told they were going to hear four English words in a row and had to indicate whether the second or the third had a different vowel from the others, i.e., was the “odd one out”.
Design
The experiment was supported by Praat (Boersma & Weenink, Reference Boersma and Weenink2011). It consisted of two blocks, with an optional break in-between. In each block, 24 sequences were presented: each vowel was the odd one out in six sequences, i.e., occurred once in second and once in third position for each of the three other vowels. Stimuli were randomized within each block.
Results
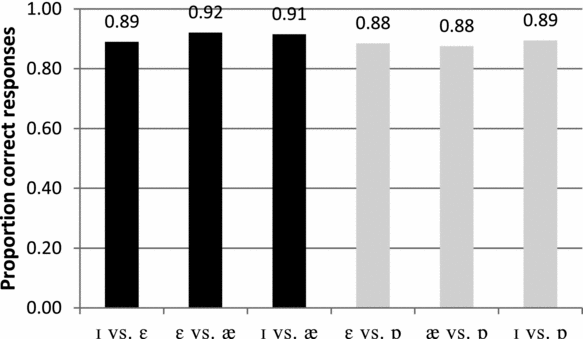
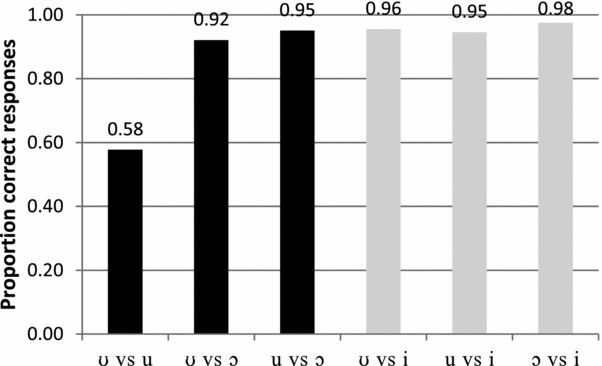
Figures 4 and 5 present the proportion of correct responses in the front vowel part (Figure 4) and the back vowel part (Figure 5) of the experiment.
Percentage correct scores for front vowels (black bars: front–front; grey bars: front–back).
Percentage correct scores for back vowels (black bars: back–back; grey bars: back–front).
The results show that the scores were very high (over 87%), not only when participants had to discriminate between a front and a back vowel (grey bars in Figures 4 and 5), but also when the contrast was one between two front vowels (black bars in Figure 4) or two back vowels (black bars in Figure 5). There were no significant differences between the vowel pairs, except for the pair /u/–/ʊ/, for which a significantly lower score, i.e., 58%, was obtained than for the other pairs. This is indicated by the fact that a RM-ANOVA that includes the level /u/–/ʊ/ results in a significant effect for the factor Vowel (F(11, 275) = 9.793, p < .001), whereas an analysis of all vowel-pairs except /u/–/ʊ/ does not result in an effect of the factor Vowel (F(10, 250) = 1.137, p = .335). This shows that among the other vowel pairs the discrimination scores did not differ from each other. Participants thus had great difficulty discriminating between the non-native /u/–/ʊ/ vowels, but not between the vowels in a non-native pair like /ɛ/–/æ/ (which they correctly discriminated in 92% of the tokens).
Discussion
The aim of Experiment 3 was to investigate whether the acceptance of mispronunciations of English words in Experiment 2 was the result of a failure on the part of the listeners to discriminate between the L2 vowels. The results of the 4I-oddity task revealed that children obtained very high scores, ranging between 88% and 98% on all but one of the vowel pairs. This suggests that the children generally had no problem perceiving the difference between the members of the English vowel pairs and that the acceptance of mispronunciations involving these vowels in Experiment 2 must have been due to not fully developed phonological representations, rather than to an inability to perceive the difference between the vowels.
The only exception was formed by the non-native /u/–/ʊ/ contrast, on which the participants performed much worse than on the other vowel pairs. This was despite the fact that a 4I-oddity task encourages listeners to base their judgments on phonetic aspects of the stimuli. It is therefore unsurprising that in general children accepted more mispronunciations in Experiment 2 involving these two vowels (e.g., the pronunciation of moon as [mʊn] and book as [buk]). We think there are two potential explanations for the difficulty that listeners had with the /u/–/ʊ/ contrast. The first explanation relates to the fronting of /u/ in English. Although English contains the phonological category /u/, the strong fronting of this sound makes the phonetic implementation quite unlike the Dutch /u/. For the Dutch listeners, both /u/ and /ʊ/ could therefore have been interpreted as quite atypical instances of a vowel in their native phonology (probably /u/).
Another potential explanation bears on the fact that the /u/–/ʊ/ contrast has previously been demonstrated to be relatively difficult, even for native English children (see Figure 1 in Baker, Trofimovich, Flege, Mack & Halter, Reference Baker, Trofimovich, Flege, Mack and Halter2008). This could be a result of the relatively low functional load of the /u/–/ʊ/ contrast (note that in Baker et al., Reference Baker, Trofimovich, Flege, Mack and Halter2008, the adults performed much better, excluding an account where those /u/ and /ʊ/ tokens were auditorily indistinguishable). The vowels /u/ and /ʊ/ typically occur in different contexts (e.g., before /k/ we typically find /ʊ/, as in hook, book, look) and there are only very few minimal pairs like who'd /hud/ – hood /hʊd/. Thus, even beginning learners of English may feel the need to pay attention to the non-native contrast between /ɛ/ and /æ/, but not between /u/ and /ʊ/. The current data do not allow us to distinguish between these alternatives, but it is likely that both factors to some extent contribute to the difficulty of the /u/–/ʊ/ contrast.
It is noteworthy that both explanations presented above focus on potential phonological influences on the 4I-oddity discrimination task. This may be surprising as discrimination tasks like 4I-oddity have been argued to encourage listeners to focus on auditory levels of representation (Gerrits & Schouten, Reference Gerrits and Schouten2004; see also Pisoni, Reference Pisoni1973, for a discussion on levels of representation in discrimination tasks). However, in the 4I-oddity version that was used here, different tokens of the same vowel were used for the three standards. It is possible that this variation within the standards could have weakened participants’ focus on only purely auditory representations towards a strategy were participants focused on both auditory and phonetic properties. Moreover, previous reports of linguistic influences on supposedly auditory tasks have been reported (Boomershine, Hall, Hume & Johnson, Reference Boomershine, Hall, Hume, Johnson, Avery, Dresher and Rice2008). Such findings indicate that the representational levels that listeners use in a task to make their decisions are highly sensitive to task demands. Importantly, however, Experiment 3 showed that for all other vowel pairs, including the non-native distinction between /ɛ/ and /æ/, listeners were able to distinguish between the vowels in a task that was more auditorily oriented than the mispronunciation task.
General discussion
This series of three experiments examined how detailed school-age children's phonological and lexical representations are in their native and in a non-native language. In the following we will discuss three main aspects that were the focus of this investigation: the development of native phonological representations, the development of non-native phonological representations, and the relation between asymmetries in vowel perception and the position of those vowels in the vowel space.
Phonological representations in the native lexicon
The results of Experiment 1, a Dutch mispronunciation-detection task, revealed that children aged between nine and 12 years have well-defined phonological representations of vowels in their native lexicon. Children were generally able to detect mispronunciations of native words in which a vowel was substituted by another vowel representing a different phonological category. However, although children made few errors, they gave more incorrect responses and were slower than adults, suggesting that at this age children's native phonological representations are indeed still under development. The lag in the development of these children when compared to adults is in line with earlier studies (e.g., Fikkert, Reference Fikkert, Fougeron, Kühnert, D'Imperio and Vallée2010; Flege et al., Reference Flege, Munro and MacKay1995; Hazan & Barret, Reference Hazan and Barrett2000; Johnson, Reference Johnson2000; Parnell & Amerman, Reference Parnell and Amerman1978). These findings support the “category definition hypothesis”, proposed by Walley and Flege (Reference Walley and Flege1999), suggesting that phonetic categories become better defined with age. The current findings also align with the notion that phonemic representations are abstract and can change in the course of development (Fikkert, Reference Fikkert, Fougeron, Kühnert, D'Imperio and Vallée2010, p. 227). In other words, children's representations are not adult-like from the start, as is assumed in generative approaches to phonological acquisition. Rather, children may have lexical representations which are different from those of adults and may change into adult-like forms only in the course of development under the influence of the input (see Fikkert, Reference Fikkert, Fougeron, Kühnert, D'Imperio and Vallée2010, for a discussion).
Words that contained substitutions involving vowels which are acoustically very close, such as /ɪ/ and /ɛ/, were not always rejected by either the children or the adults. This indicates that the Flemish speakers’ phonological categories for these vowels were to some extent flexible and may overlap. One potential explanation for these patterns lies in exposure to variation in pronunciation due to dialectal variation.
Phonological representations in the non-native lexicon
The results of Experiment 2, an English mispronunciation task, showed that children largely relied on their L1 phonemic categories when trying to detect mispronunciations. Children made fewer errors when mispronunciations involved phoneme categories that are shared between L1 and L2. In contrasts involving a native and a non-native vowel, the presence or absence of the vowel in the L1 was found to play a major role in explaining error patterns. The higher error rate on non-native contrasts could not be fully attributed to a failure to discriminate between the non-native vowels, since children received high discrimination scores on the /ɛ/–/æ/ contrast in Experiment 3. In discrimination, participants have the auditory representations available and are able to use these representations to detect a deviant sound. In a mispronunciation-detection task, on the other hand, listeners have to fully rely on the stored representations in their mental lexicon. Children's ability to discriminate most items in Experiment 3 confirms that their lexical representations are mainly based on their native phonological inventory.
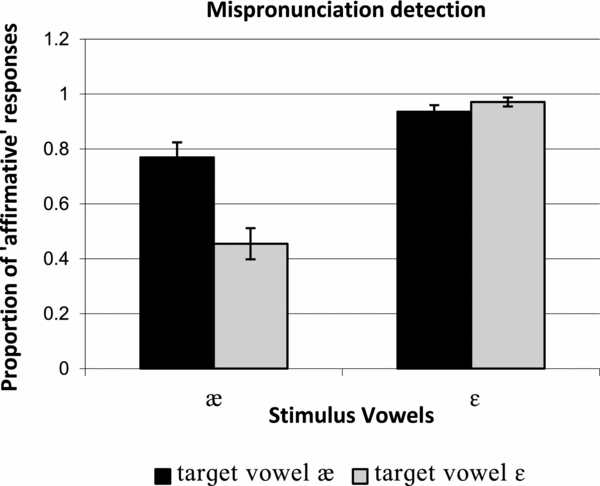
To uncover whether the children in this experiment did benefit from the L2 exposure that they had had before testing we will present a closer inspection of the confusion patterns in the mispronunciation-detection task. With respect to the non-native vowel pair /ɛ/–/æ/, we saw that children could perceive the acoustic difference between these two vowels in a discrimination task. However, in the mispronunciation-detection task, children did not reject English /æ/ words in which the vowel was replaced by /ɛ/ (which also occurs in Dutch) in the majority of trials. However, when English words containing /ɛ/ were mispronounced with the new, non-native sounds /æ/, these mispronunciations were more often rejected. However, the data suggest a more refined picture of these confusions. For the following analysis we inspect both CPs and MPs, and report not the proportion of correct answers, but the proportion of trials for which the children indicated that the word was pronounced correctly (i.e., rather than accuracy we report the proportion of “affirmative” answers). Figure 6 presents the proportion of “affirmative” responses to CPs and MPs of target /ɛ/- and /æ/-words.
Proportion of “affirmative” responses to CPs and MPs when the auditory stimulus contained /æ/ (left bars) and /ɛ/ (right bars), and when the target word should contain /æ/ (black bars) or /ɛ/ (grey bars).
When the target word should contain /æ/ and the stimulus was /æ/ (cat as [kæt]), participants gave an affirmative response on 77% of the trials (standard deviation 28); when the stimulus was /ɛ/ (cat as [kɛt]), it was 94% (12). When the target word should contain /ɛ/ and the stimulus was /æ/ (bread as [bræd]), the proportion of “affirmative” responses was 46% (29) versus 97% (8) when the stimulus was /ɛ/ (bread as [brɛd]). Three important observations can be made. The first is that, overall, the children accept most stimuli, regardless of the correctness. This suggests that the children adhere to a rather liberal decision criterion. The second observation is that children respond affirmatively much more often when the stimulus is /ɛ/ rather than /æ/ (F(1, 25) = 73.317, p < .001). The children have a clear preference for /ɛ/, reflecting a strong influence of their L1 on their responses. For child learners at this age L2 lexical items may thus be specified using mostly their L1 phonological categories. In light of the category definition hypothesis (Walley & Flege, Reference Walley and Flege1999), this finding suggests that at 9–12 years of age, Dutch children's L1 phonological categories have become quite restricted and specific. Interestingly, however, there was an additional interaction between Target Vowel and Stimulus Vowel (F(1,25) = 18.285, p < .001), showing that children do not simply use their L1 vowel /ɛ/ as the “correct” vowel in English words to the full extent. Children accept /æ/ in /æ/-words more often than they accept /æ/ in /ɛ/-words, and, accordingly, they accept /ɛ/ in /ɛ/-words more often than they accept /ɛ/ in /æ/-words. Despite the strong influence of L1 phonology, these children respond in accordance with L2 phonology to some extent. The relatively little, and mostly informal, exposure to English that they have has thus induced some sensitivity to the different vowel system in English.
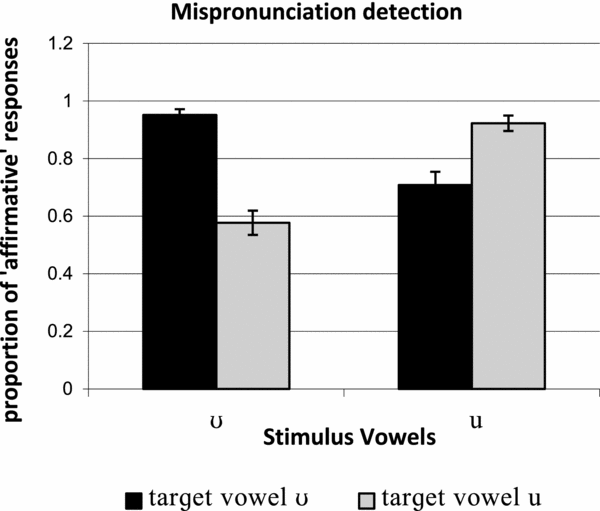
The other non-native vowel pair, /u/ vs. /ʊ/, enables a similar comparison. Figure 7 presents the proportion of “affirmative” responses to CPs and MPs of target /u/- and /ʊ/-words.
Proportion of “affirmative” responses to CPs and MPs when the auditory stimulus contained /ʊ/ (left bars) and /u/ (right bars), and when the target word should contain /ʊ/ (black bars) or /u/ (grey bars).
The first observation is that, overall, the children accepted most pronunciations as correct. Again, however, the analysis reveals an interaction between the identity of the Target Vowel and Stimulus Vowel (F(1,25) = 77.878, p < .001). Once more the interaction is in such a direction that they accept /ʊ/ in /ʊ/-words more often than they accept /ʊ/ in /u/-words, and, accordingly, they accept /u/ in /u/-words more often than they accept /u/ in /ʊ/-words. Interestingly, although the children mostly accepted mispronunciations involving /ʊ/ and /u/, they did seem to have developed at least a slight (but significant) sensitivity to the properties of the L2 phonological system. The detailed analyses of these two vowel pairs thus show that in both cases children have acquired some sensitivity to their L2.
An additional factor which needs to be taken into account in the context of children's preference for their native categories is the potential exposure listeners may have had to mispronounced words. Dutch-speaking children in Flanders may have been exposed to pronunciations of English words involving substitutions of the target non-native vowel by a Dutch vowel, as in the word cat, frequently pronounced as [kɛt] by native speakers of Dutch (see also Sebastián-Gallés et al., Reference Sebastián-Gallés, Echeverría and Bosch2005). Therefore, in many cases the lexical representation of both bread and cat could simply contain the phonological representation /ɛ/.
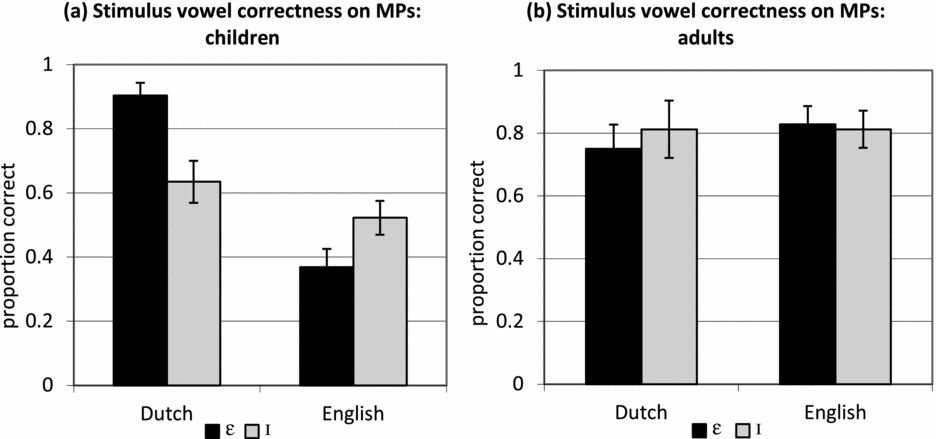
Apart from the direct influences of L1 phonemes on the perception of L2 phonemes, however, there seem to be additional influences on participants’ responses. One of these is related to the fact that the correspondence of phonemes that are shared between the native and non-native languages is often only true in a pure phonological sense, and less so in the phonemes’ exact phonetic properties. Figure 8 compares how participants performed on the /ɛ/–/ɪ/ pair (which is phonologically shared between English and Dutch) in their native language (Experiment 1) and in the non-native language (Experiment 2).
Correctness on MPs involving /ɪ/–/ɛ/ in Dutch (Experiment 1) and English (Experiment 2) by children (left panel) and adults (right panel).
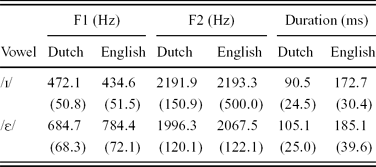
The asymmetry goes in different directions for the two languages: in English, children perform better when the substituting vowel is /ɪ/ than when it is /ɛ/; that is, when a word like bed is realized as /bɪd/, they more often correctly reject it than when a word like fish is pronounced [fɛʃ] (see also Cutler, Weber, Smits & Cooper, Reference Cutler, Weber, Smits and Cooper2004). For the Dutch materials, however, the children perform better when the substituting vowel is /ɛ/, as in the word vis “fish” realized as [vɛs], then when it is /ɪ/, as in the word fles “bottle” pronounced as [flɪs], resulting in a main effect for Language (F(1,25) = 37.646, p < .001) and an interaction between VowelPair and Language (F(1,25) = 22.990, p < .001) (no main effect was found for VowelPair: F(1,25) = 1.436, p = .242). For the adults, there was no difference between Dutch and English and no effect of substituting vowel (Language: F(1,15) = 0.043, p = .839; VowelPair: F(1,15) = 0.077, p = .785; Language × VowelPair: F(1,15) = 0.294, p = .596).Footnote 9 The fact that the asymmetry goes in the opposite direction for English is rather surprising. A potential explanation, however, lies in the fact that the tokens for the two language stimuli slightly differed. In Table 6, the F1, F2 and duration values of Dutch and English /ɪ/ and /ɛ/ are displayed.
F1, F2 (in Hz) and duration (in ms) of /ɪ/ and /ɛ/ realizations in the Dutch and English stimuli (standard deviations in parentheses).
The values in Table 6 indeed reveal that the phonetic realizations of /ɪ/ and /ɛ/ were not identical in the Dutch and English stimuli. Spectrally, Dutch /ɪ/ was realized slightly more open than English /ɪ/ and Dutch /ɛ/ was more closed and slightly more back than English /ɛ/. The vowel durations also differ: English /ɪ/ and /ɛ/ were realized nearly twice as long as their Dutch counterparts. However, since both vowels were realized longer in English than in Dutch, these durational differences cannot explain the different directions of the asymmetries in Dutch and English. These differences show that the phonetic properties of a phonemic contrast play an important role in the results.
A final aspect that is shown by the analysis of this specific pair, which was also revealed in the comparisons between /ɛ/–/æ/ and /u/–/ʊ/, is that the children use laxer criteria in the English task compared to the Dutch task. From Figure 8 and the accompanying analyses reported above it can be observed that, overall, the children performed better on MP detection in the Dutch than in the English task (indicated by the effect of the factor Language), even though the comparison is between the same phonological vowel pair. This shows that their lexical representations for the L2 words are less specific than for L1 words, even when a mispronunciation of an L2 word involves a native distinction.
Effects of vowel space position on directional asymmetries in perception
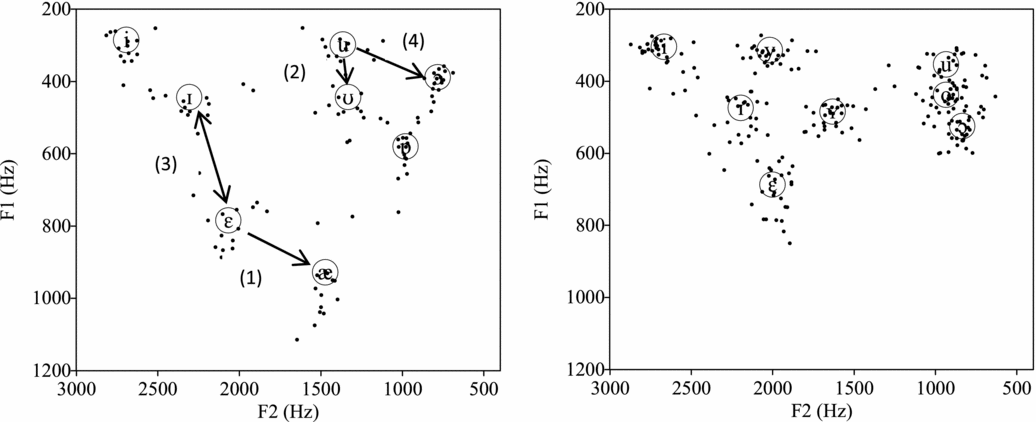
Experiment 2 also provides the opportunity to align our findings to the NRV framework of Polka and Bohn (Reference Polka and Bohn2003, Reference Polka and Bohn2011). In our experiment asymmetries were observed for L2 contrasts in which both members occur in the native language. This suggests that some asymmetries may indeed have occurred under the influence of factors other than L1–L2 interactions. In the NRV framework, asymmetries in infant speech perception can be explained by referring to the position of the vowel in the acoustic vowel space: changes from central to peripheral vowels should be more easily detected than changes in the opposite direction (see “Introduction” section above). Figure 9 presents two vowel plots including F1 and F2 values of the vowels in the English and Dutch stimuli produced by native speakers of Standard British English and Belgian Dutch (see “Method” section above).Footnote 10
Vowel plots showing F1 and F2 values of English (left panel) and Dutch (right panel) vowels in the stimuli. The circled symbols represent the mean values; the dots represent individual tokens. Following Polka and Bohn (Reference Polka and Bohn2011, Figure 1), arrows point to the referent vowels for the tested contrasts in English.
On the basis of the NRV framework (Polka & Bohn, Reference Polka and Bohn2003, Reference Polka and Bohn2011) we can predict in which direction asymmetries should go for the four vowel contrasts. First, for the non-native pair /ɛ/–/æ/ (contrast 1), substitutions of the more central /ɛ/ by the more peripheral /æ/ should be more easily detected than changes in the opposite direction. The results confirmed this prediction. Changes from /ɛ/ to /æ/ were more frequently detected by both children and adults. However, as discussed in the previous section, this particular contrast is also influenced by the non-native status of /æ/. It is therefore unclear what the potential impact is of the more peripheral position of /æ/ in the vowel space. Secondly, for the non-native pair /u/–/ʊ/ (2), the vowel /ʊ/ is more central than /u/ and hence changes from /ʊ/ to /u/ are predicted to be more easily detected than changes from /u/ to /ʊ/. This prediction was not confirmed. Children and adults had a significant tendency to detect more changes from /u/ to /ʊ/ than changes in the opposite direction. While a small effect of vowel position might be present, it seems that any such effect would have been overruled by L1 experience in L2 learning. With respect to this specific contrast, however, Polka and Bohn (Reference Polka and Bohn2011) also point out that the asymmetry between rounded vowels may not be predictable on the basis of their position in the F1/F2 vowel space. The salience of natural referent vowels is argued to be due to focalization: when formants converge, the amplitude of each formant is raised, leading to spectral salience or prominence. While focalization and location in the F1/F2 vowel space lead to the same predictions for unrounded vowels, the picture may be different for rounded vowels, in which F3 should also be taken into account. An appropriate metric for quantifying vowel focalization is, however, not yet available (Polka & Bohn, Reference Polka and Bohn2011).
For the pair /ɪ/–/ɛ/ (3), the NRV framework does not predict in which direction a potential asymmetry would go, since both vowels are quite central in the vowel space.
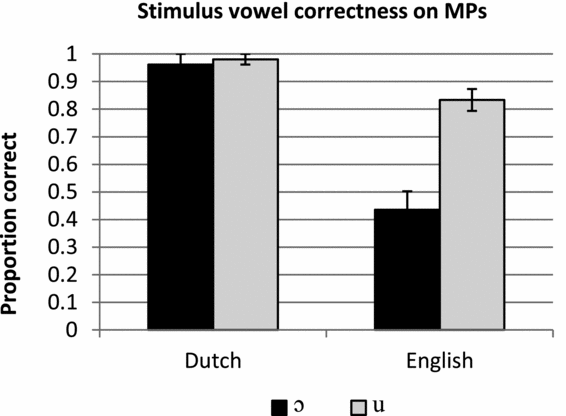
Finally, for the contrast /u/–/ɔ/ (4), when taking only position in the F1/F2 vowel space into consideration, changes from /u/ to /ɔ/ would be predicted to be easier to notice than changes in the opposite direction, since /ɔ/ was more peripheral than /u/ in the English stimuli. The asymmetry, however, tended to go in the other direction. A comparison of the children's acceptance rates for MPs involving /u/ and /ɔ/ in Dutch and English is presented in Figure 10 (only child data are presented since many adults scored at ceiling).
Correctness on MPs involving /u/–/ɔ/ in Dutch and English by the children.
Figure 10 shows that children nearly always detected changes from /u/ to /ɔ/, or vice versa, in their native language. In that sense, the /u/–/ɔ/ contrast differs from the /ɪ/–/ɛ/ contrast, in which especially substitutions of /ɛ/ by /ɪ/ were often accepted. However, the children accepted a fair deal of substitutions involving these same vowels in English, especially when /u/ was substituted by /ɔ/. One reason why children may detect changes from /ɔ/ to /u/ more easily than changes in the opposite direction may be that the children's phonological representation of /u/ was that of a traditional peripheral back vowel, in which case /u/ may be stored as being a slightly more peripheral vowel than /ɔ/. Furthermore, the English stimulus vowel /ɔ/ might have been closer to traditional Dutch /u/ than the English stimulus vowel /u/. This could make a mispronunciation of /u/ as /ɔ/ relatively hard to detect. The difference between the proportions of correct responses in Dutch and English may thus be due to the essentially different nature of the /u/–/ɔ/ contrast in the two languages: whereas the contrast seems to be mainly one of height in Dutch (high /u/ vs. non-high /ɔ/), it is mainly one of frontness in English (fronted /u/ vs. non-fronted /ɔ/). As the leftmost plot in Figure 9 shows, the vowel /u/ was considerably fronted in the stimuli produced by the native speaker of British English. This phenomenon, known as “u-fronting”, has recently been observed in the speech of young speakers of Standard Southern British English (Chládková & Hamann, Reference Chládková, Hamann, Lee and Zee2011; Harrington, Kleber & Reubold, Reference Harrington, Kleber and Reubold2008; Hawkins & Midgley, Reference Hawkins and Midgley2005). Since u-fronting is not found in all varieties of English or in all speakers, children may mostly have been exposed to a back vowel /u/ and may as a result have created a phonological category of /u/ as a peripheral high rounded back vowel. If so, both /u/ and /ɔ/ are peripheral vowels making a potential asymmetry hard to predict.
In sum, the NRV framework (Polka & Bohn, Reference Polka and Bohn2003, Reference Polka and Bohn2011) aligned with only part of the observed asymmetries in the children's and adults’ detection of mispronunciations. It could be that by age 9–12 years the effect of the L1 inventory on asymmetries has become more dominant than potential additional effects of the peripheral status of a phoneme. Furthermore, Polka and Bohn (Reference Polka and Bohn2003, Reference Polka and Bohn2011) report scores on a discrimination task whereas these results are based on a mispronunciation-detection task. These task-based differences might partly explain the lack of strong influences of the position of vowels in vowel space in our results. A final reason may be that in the NRV framework the asymmetries for rounded vowels cannot be predicted solely on the basis of the F1/F2 vowel space since F3 also plays a role in rounded vowels (Polka & Bohn, Reference Polka and Bohn2011). How the positions of vowels in the three-dimensional F1–F2–F3 vowel space would affect the direction of asymmetries in vowel perception is, however, still an open question. Further research is therefore needed to develop a metric that is better able to predict asymmetries in data such as those reported here.
Conclusions
The current report focused on the phonological development in the L1 and L2 of 9–12-year-old children. These children have had only a restricted amount of school-based L2 education and have had some amount of exposure to L2 through media. Our goal was to examine where these children are on the developmental track of L2 learners. As predicted by a model such as Flege's Speech Learning Model (Flege, Reference Flege and Strange1995, Reference Flege and Birdsong1999), the results showed that the L2 phonology was heavily influenced by the phonological properties of L1. When these children listened to words in their L2 they mostly seemed to rely on their L1 phonological categories. However, two additional patterns were visible. First, children seemed to adopt a much more liberal stance when judging items as incorrect when compared to the adults. From the viewpoint of the “category definition hypothesis” this could be seen as evidence for the fact that their phonological categories were still larger, or less well defined, than those of the adults. The second pattern was that on the non-native vowel pairs /ɛ/–/æ/ and /u/–/ʊ/, we observed a small but reliable tendency towards the correct perceptual differentiation of these vowels. It should be stressed, of course, that in performing their tasks the children actively listened for mispronunciations and it remains to be seen whether children of this age display these sensitivities while listening to running speech in actual conversation. In any case, it is promising that we observed that a small amount of L2 exposure in childhood can have an influence on L2 phonological development.