Introduction
The pea moth, Cydia nigricana Fabricius is one of the key pea pests in Germany. It has a holarctic distribution, reaching from North America, throughout Europe, Scandinavia, North and Central Asia to Japan (Hanson and Webster, Reference Hanson and Webster1936; Kuwayama, Reference Kuwayama1937; Cameron, Reference Cameron1938; Langenbuch, Reference Langenbuch1941; Stenmark, Reference Stenmark1974; Touvinen, Reference Touvinen1982). The essential damage is caused by larval feeding on pea seeds, which leads to quality reduction and crop losses (Nicolaisen, Reference Nicolaisen1928; Dann, Reference Dann1979; Touvinen, Reference Touvinen1982; Huusela-Veistola and Jauhiainen, Reference Huusela-Veistola and Jauhiainen2006; Kaniuczak, Reference Kaniuczak2010). After mating, the female lays eggs mostly on leaves of the pea plant. The newly hatched first instar larvae enter the young pea pods and develop inside them. When the development is complete, the last larval instar (L5) leaves the pod and overwinters in the soil of the then harvested pea field, inside a cocoon. In spring, after leaving its first cocoon, the larva crawls closer to the soil surface and spins another cocoon for pupation. The adult moth ecloses shortly after pupation (Nicolaisen, Reference Nicolaisen1928; Hanson and Webster, Reference Hanson and Webster1936; Wright and Geering, Reference Wright and Geering1948). The preferred host of the pea moth is the pea plant (Pisum sativum), which is mainly found by olfactory cues, especially the volatiles during flower development (Langenbuch, Reference Langenbuch1941; Wright et al., Reference Wright, Geering and Dunn1951; Stenmark, Reference Stenmark1974; Thöming et al., Reference Thöming, Norli, Saucke and Knudsen2014). The pea moth is generally considered to be a univoltine species (Langenbuch, Reference Langenbuch1941; Stenmark, Reference Stenmark1974), although some literature suggests the possibility of a minor second generation (Nicolaisen, Reference Nicolaisen1928; Hanson and Webster, Reference Hanson and Webster1936; Nußbaum, Reference Nußbaum1976).
Efficient pea moth control largely depends on direct control measures, applied during the optimal time of pest development, which is before the larvae enter the pea pod (Macaulay et al., Reference Macaulay, Etheridge, Garthwaite, Greenway, Wall and Goodchild1985). Finding the precise time for spraying is a constant challenge for conventional pea producers. A forecasting system, which is based on the relationship between temperature and egg development, is already available in the United Kingdom (Lewis and Sturgeon, Reference Lewis and Sturgeon1978; Macaulay et al., Reference Macaulay, Etheridge, Garthwaite, Greenway, Wall and Goodchild1985; Processors and Growers Research Organisation, 2019). However, this concept is based on a constant population monitoring by pheromone traps. The application time is determined by using a threshold of ten moths per trap as a starting point for temperature summation, even though the number of trapped moths can vary, depending on the weather conditions, the overall infestation pressure, the type of trap, the variety and the region (Touvinen, Reference Touvinen1982). Therefore, a precise prediction of the spring emergence time and pattern of C. nigricana is desirable as a first step towards the development of a decision support system (DSS) that is less reliant on laborious pheromone trap monitoring.
Different factors can influence the development of insects. Temperature (Tauber and Tauber, Reference Tauber and Tauber1976; Naves and de Sousa, Reference Naves and de Sousa2009; Moallem et al., Reference Moallem, Karimi-Malati, Sahragard and Zibaee2017; Ngowi et al., Reference Ngowi, Tonnang, Mwangi, Johansson, Ambale, Ndegwa and Subramanian2017; Rebaudo et al., Reference Rebaudo, Struelens and Dangles2018) and photoperiod (Lutz, Reference Lutz1968; Sawchyn and Church, Reference Sawchyn and Church1973; Corbet, Reference Corbet2003) are recognized as the most important ones. Concerning the pea moth, temperature is considered the crucial influencing factor on pea moth emergence (Stenmark, Reference Stenmark1971; Nußbaum, Reference Nußbaum1976). The relationship between temperature and egg or larval development of C. nigricana has been determined by several different authors (Langenbuch, Reference Langenbuch1941; Nußbaum, Reference Nußbaum1976; Lewis and Sturgeon, Reference Lewis and Sturgeon1978; Macaulay et al., Reference Macaulay, Etheridge, Garthwaite, Greenway, Wall and Goodchild1985). However, few publications have investigated the emergence–temperature relationship, with diverging outcomes (Wheatley and Dunn, Reference Wheatley and Dunn1962; Stenmark, Reference Stenmark1971). Wheatley and Dunn (Reference Wheatley and Dunn1962) suggested a development threshold of 5.60°C for a pea moth population in Great Britain, yet without providing any evidence in support of this statement. Stenmark (Reference Stenmark1971) proposed a threshold between 10.10 and 10.70°C for a Swedish population and Nußbaum (Reference Nußbaum1976) a threshold of 10.50°C for Germany. The latter two thresholds were derived through linear regression extrapolation. However, to capture the development rate (inverse of development time in days) at extreme temperatures correctly, the use of non-linear thermal performance curves (TCPs) is now considered more appropriate (Campbell et al., Reference Campbell, Frazer, Gilbert, Gutierrez and Mackauer1974; Sharpe and DeMichele, Reference Sharpe and DeMichele1977; Lamb, Reference Lamb1992; Moore et al., Reference Moore, Liang, Akullian and Remais2012; Molnár et al., Reference Molnár, Sckrabulis, Altman and Raffel2017; Rebaudo et al., Reference Rebaudo, Struelens and Dangles2018). Additionally, recent findings (Thöming and Saucke, Reference Thöming and Saucke2010) indicate that photoperiod might play a role in post-diapause development. According to the authors, there is a possible critical day length of 14/10 L/D that is necessary to initiate temperature sensitivity in the pea moth.
Therefore, the current study had three objectives. Primarily, we investigated the influence of photoperiod and temperature on emergence time of C. nigricana in controlled laboratory experiments. We used five different light regimes (two above and three below the threshold proposed by Thöming and Saucke (Reference Thöming and Saucke2010)) and seven constant temperatures. Furthermore, we examined development rate as a function of temperature and fit several non-linear development rate functions to select the best response. To determine if the cumulative emergence proportion in the field can be predicted using the cumulative development rate, the development rate model was applied to field data. For this purpose, the cumulative spring emergence of male C. nigricana was measured with pheromone traps on different fields in Northern Hesse (Germany), where peas were grown the previous year. Finally, we fit several non-linear distribution models to field data of cumulative emergence as a function of cumulative development rate predicted with our best development rate model from air temperature. The prediction quality was validated with a set of independent field data from the same region.
Materials and methods
Laboratory experiments
The insects were collected throughout the previous growing season as larvae within infested pea pods from around 50 different pea fields in the pea-growing region in Northern-Hesse (Germany, 51°20′37.87″N, 9°51′08.95″O). The intact pea pods were placed on chicken mesh (1.2 cm mesh size) covering wooden boxes (72 × 45 × 12 cm3) filled with dry sand to allow the larvae to complete development, exit the pod and spin a cocoon in the sand. The sand was humidified once a week to prevent newly formed cocoons from drying out. All boxes were kept outside, under field conditions in the shade and protected against rainfall until 15th of October. Afterwards, the sand was sieved. The obtained cocoons were mixed and placed in plastic boxes (15 × 15 × 5 cm3), 50 per box, on a 2 cm sand layer, covered with another 2 cm layer of sand. For overwintering, the boxes were stored in a cooling chamber at 4 ± 0.5°C for another 4 months, until the start of the experiment. To examine the effect of temperature and photoperiod on pea moth emergence, we placed the boxes in climate chambers (Type Bioline VB 1100 Vario, Weisstechnik) with five different light regimes (18/6 L/D, 16/8 L/D, 12/12 L/D, 9/12 L/D, 0/24 L/D) and a constant temperature of 20 ± 0.5°C, as well as seven different temperatures (12 ± 0.5°C, 16 ± 0.5°C, 18 ± 0.5°C, 20 ± 0.5°C, 24 ± 0.5°C, 28 ± 0.5°C, 32 ± 0.5°C) and a constant light regime of 16/8 D/L. The number of cocoons per treatment varied between 150 and 400, according to availability. The humidity in all climate chambers was kept at 70 ± 5% RH. Temperature and humidity were measured with temperature loggers (Tinytag, Plus 2; TGP-4500, Germini). Afterwards, the boxes were covered with a removable lid. Aeration was guaranteed by a hole in the lid, covered with gauze. The number of emerged moths was recorded daily.
Field experiments
Pheromone trap catches
In 2017–2019, we assessed the male pea moth emergence with commercial pheromone traps (Trifolio-M GmbH, Lahnau, Germany) at several sites with pea as a preceding crop in Northern Hesse. The sites were speared across an area of approximately 10 km in diameter, around the weather station Neu-Eichenberg (Germany, 51°22′47.61″N, 9°54′37.59″O). One trap was placed at each sample site and trap catches were assessed every third day. To minimize the influence of crop management on emergence, fields that were tilled very late in the season or during the season and fields that were harvested very early the previous year or with extremely low pea crop coverage were excluded from the evaluation. Overall, we used data from 36 sites for the calculations.
Meteorological data
The meteorological database used for the interpolation of hourly air temperature data (2 m above ground) for each monitored site was collected by automatic stations, operated by the German Meteorological Service (DWD) and Crop Protection Services (CPS). For the interpolation of temperature, a multiple regression analysis including the parameters altitude, exposure and slope inclination was used to calculate data for 1 km2 grids. The interpolation process is described in detail in Zeuner (Reference Zeuner2007).
Data analysis
Effect of photoperiod and temperature on emergence
We compared the mean development time in days of all emerged adults between five tested photoperiods and seven different temperatures and the impact of sex on the mean emergence time. According to the prerequisites of data, either a nonparametric analysis of variance (Kruskal–Wallis test) or an analysis of variance (ANOVA) was performed to test for significance. If normal distribution of residuals or homogeneity of variances could be achieved through transformation, the ANOVA was preferred.
Development rate models and performance testing
We calculated the average development rate (1/day) for each constant temperature and plotted it against the temperature. Four non-linear models were fit (Lamb, Reference Lamb1992; Lactin et al., Reference Lactin, Holliday, Johnson and Craigen1995; Brière et al., Reference Brière, Le Roux and Pierre1999) to describe the interaction between development rate and temperature (table 1). The most appropriate non-linear model was selected by the lowest Akaike information criterion (AIC) (Akaike, Reference Akaike1974), root mean square error (RMSE) and mean absolute error (MAE).
Four development rate models with equation and references

rT, development rate; T, temperature; T opt, optimal temperature; T min, lower development threshold; T max, upper development threshold; R m, maximum development rate; b1, b2, ΔT, curve shape parameters.
Development thresholds and optimum temperature
The lower (T min) and upper development threshold (T max), as well as the optimum temperature (T opt) were estimated by the nonlinear regression model with the best fit. For the estimation of the optimum of the three and four parameter Brière functions we used an appropriate formula according to Brière et al. (Reference Brière, Le Roux and Pierre1999).
Distribution model for adult emergence in the field
To describe the field emergence of C. nigricana males as a function of the cumulative development rate, we applied the best fitting non-linear development rate model to the interpolated temperature data of 70% of all tested sites (25, sites training data set). The remaining 30% (11 sites) were used for model validation (validation data set). The daily development rate was calculated per hour and the daily sum divided by 24 h. Temperatures below the development threshold estimated by the non-linear model were excluded from the calculation. To include all possible effective temperatures for development we set the biofix (start of summation) to the 1st of January. The cumulative emergence from all evaluated pheromone traps was pooled and analysed relative to the accumulated development rate by five sigmoidal distribution models (table 2), which are frequently used to describe insect spring emergence (Wagner et al., Reference Wagner, Wu, Sharpe and Coulson1984; Jyoti et al., Reference Jyoti, Shelton and Barnard2003; Knight, Reference Knight2007; Stevenson et al., Reference Stevenson, Michels, Bible, Jackman and Harris2008; Ahn et al., Reference Ahn, Yang and Jung2012). Similar to the development rate models, we tested the performance of these models by the lowest AIC, RMSE and MAE. The prediction of cumulative emergence proportions was realized by the most suitable distribution model.
Five non-linear distribution models with equation and references

F(x), response variable; x, explanatory variable; b 1/y 0 + b 1, upper asymptote; b 2, slope; x 0, inflection point; c 1, curve shape parameters.
Model validation with independent field data
An independent data set (validation data set) was used for model validation. The goodness of prediction was evaluated by the CV-R 2 (cross-validation-R 2), CV-RMSE and CV-MAE of a linear fit between predicted and observed values. Subsequently, we compared the derived Julian days at different cumulative emergence proportions (first moth in trap, 0.50 and 0.75) with the observed dates from the validation data. Additionally, we calculated the percentage of correctly predicted observed dates for the already mentioned emergence proportions as described in Racca et al. (Reference Racca, Kleinhenz, Zeuner, Keil, Tschope, Jung and Jao2011). If a certain emergence proportion was predicted ± 3 days around the actual date, the forecast was considered correct, since the trap control was performed every third day. If the forecast exceeded the 3 days threshold, the result was classified as either too early or too late.
Statistical analysis
All calculations and statistical analysis were performed using the program R version 3.4.3. Linear and non-linear development rate models were fitted by means of the packages ‘car’ (Fox and Weisberg, Reference Fox and Weisberg2011) and ‘devRate’ (Rebaudo et al., Reference Rebaudo, Struelens and Dangles2018). All distribution models were fitted using the package ‘nls2’ (Grothendieck, Reference Grothendieck2013). Both the ‘devRate’ and the ‘nls2’ packages use a nonlinear least-squares estimation procedure for parameter estimation.
Results
Influence of light regime and temperature on development time and survival
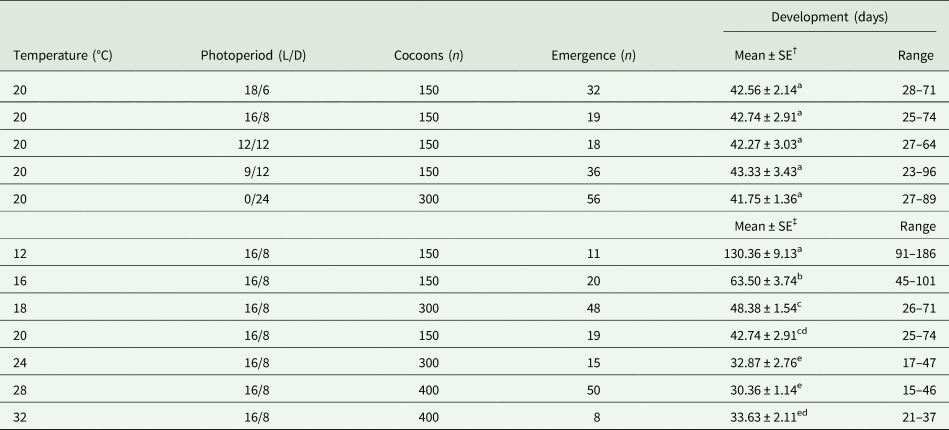
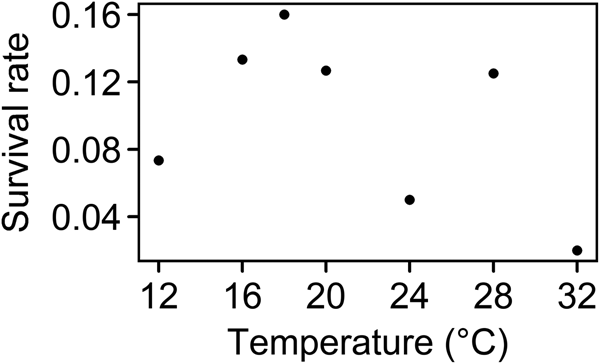
C. nigricana males and females were able to complete development at all tested light regimes and temperatures. We found no significant difference between the development time (days) of males and females among all tested photoperiods (all P > 0.1340) and temperatures (all P > 0.09370). Therefore, the results for both sexes were pooled. The mean development time (days) did not differ between all tested photoperiods (χ2 = 2.6762, df = 4, P = 0.6134), but was significantly affected by temperature (F (6,164) = 62.54, P < 0.0001). It varied from 130.36 ± 9.13a days at 12°C to 30.36 ± 1.14 at 28°C (table 3). Emergence rates were low in all temperatures (fig. 1). The proportion emerging did not show the expected unimodal pattern, and was not necessary for our model on emergence timing, so we did not analyse the data further.
Development time, development range (days) and number of emerged individuals (n) out of C. nigricana cocoons, exposed to different temperatures and photoperiods (L/D)

The number of cocoons varied between 150 and 400, according to availability. SE = standard error.
† Dunns test with Bonferroni correction after Kruskal–Wallis nonparametric analysis of variance test (P < 0.0001). Means within each column followed by the same letter do not differ. ‡ANOVA test after log transformation followed by Tukey's HSD (P < 0.001). Means within each column followed by the same letter do not differ.
Temperature-dependent survival rate of C. nigricana.

Development rate model and determination of thermal requirements
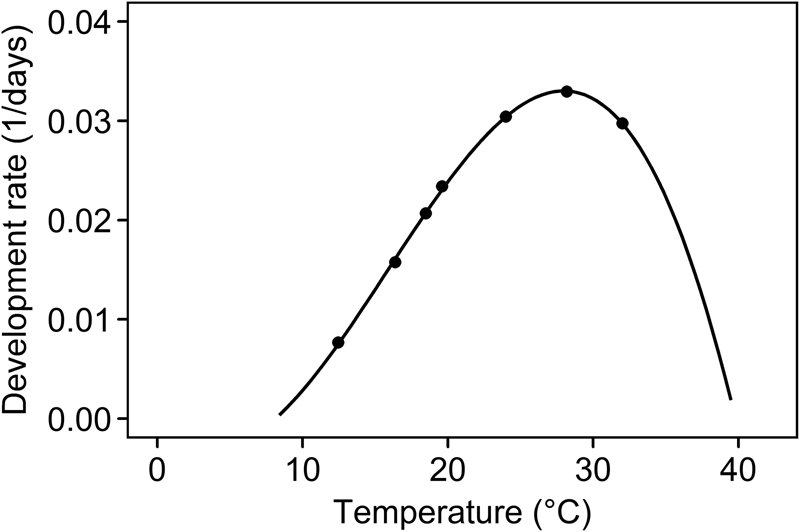
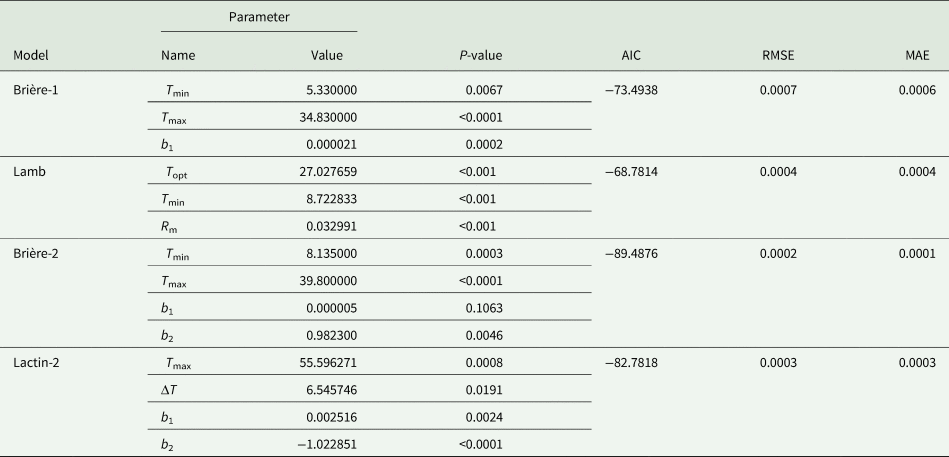
The development rate increased linearly with increasing temperatures between 12 and 20°C and non-linearly above these temperatures (fig. 2). The best curvilinear fit was achieved by the four parameter Brière model (table 1) with the lowest AIC, RMSE and MAE. Table 4 shows the fitted parameters for all tested non-linear models. The lower development threshold estimated by this model was 8.14°C, the upper development threshold was 39.80°C (table 4) and the optimal development temperature was 29.17°C.
Four parameter Brière function fitted to the mean development rate (1/day) of C. nigricana at seven constant temperatures.

Model parameters of non-linear regression models fitted to the development rates (1/day) of C. nigricana for seven different temperatures

T opt, optimal temperature; T min, lower development threshold; T max, upper development threshold; R m, maximum development rate; b 1, b 2, ΔT, curve shape parameters; AIC, statistical criteria; RMSE, MAE, goodness of fit estimators.
Fitted distribution model
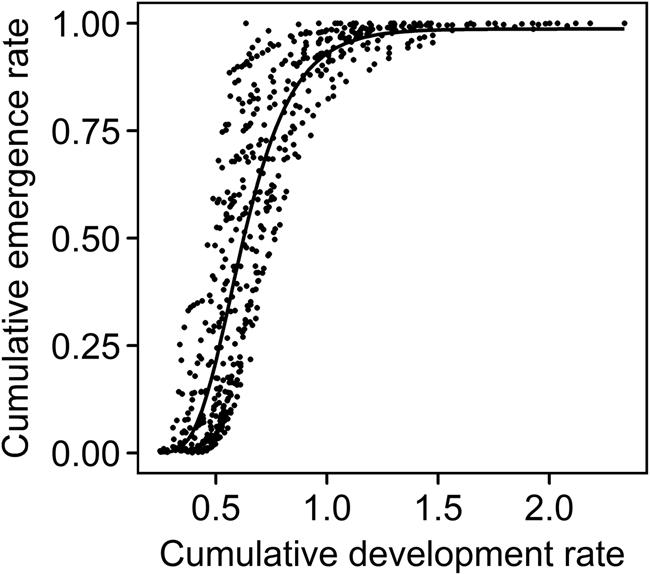
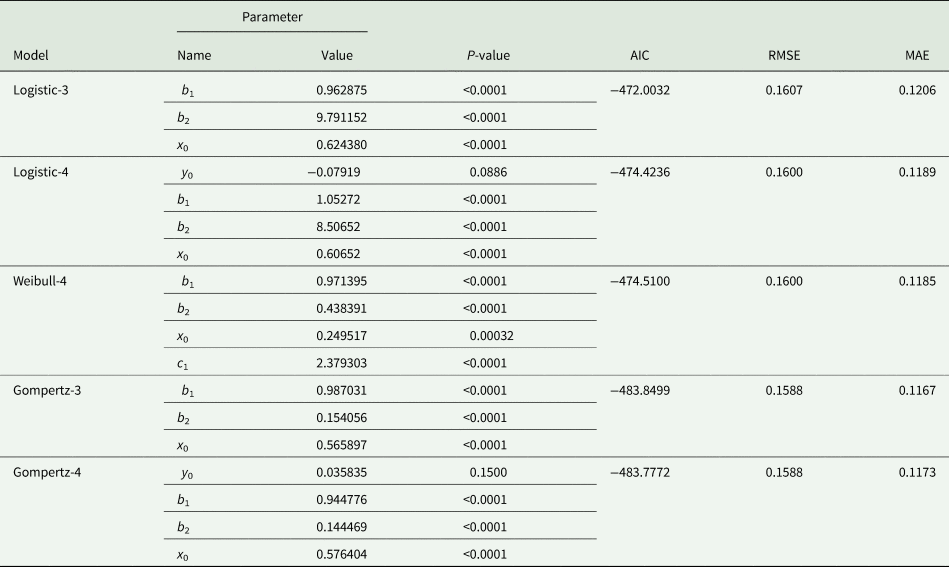
The relationship between the cumulative field emergence and the cumulative development rate was best described by the three parameter Gompertz model (table 2, fig. 3). The candidate model showed the lowest AIC and MAE and a similar RMSE in comparison with the other models, with all parameters being significant. The estimated parameters for all tested models are presented in table 5.
Cumulative proportion of male C. nigricana field emergence as a function of the cumulative development rate. The fitted non-linear model is a three parameter Gompertz function.

Model parameters of non-linear regression models of the cumulative emergence proportion of C. nigricana fitted to the cumulative development rate (1/day)

b 1/y 0 + b 1, upper asymptote; b 2, slope; x 0, inflection point; c 1 and c 2, curve shape parameters; AIC, statistical criteria; RMSE, MAE, goodness of fit estimators.
The emergence data were obtained from pheromone traps of three consecutive years in the region of Hesse.
Model validation with independent field data set
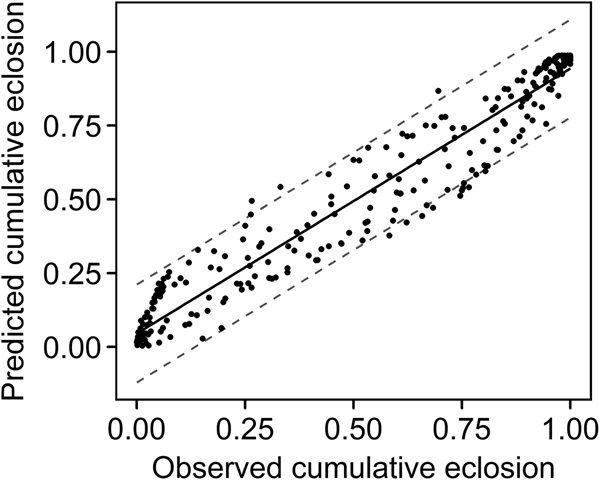
The fitted three parameter Gompertz model accurately predicted the observed cumulative emergence of the validation data set. The linear regression describing the relation between modelled and observed cumulative emergence proportion was significant (P < 0.0001) with a CV-R 2 of 0.9402, a CV-RMSE of 0.0925 and a CV-MAE of 0.0697 (6.97%) had the following equation:
 $$F( x ) = 0.045 + 0.898x, \;$$
where F(x) is the predicted cumulative emergence proportion of male C. nigricana and x is the observed cumulative emergence proportion (fig. 4). The intercept is higher than zero, which indicates that the forecast was slightly earlier at the beginning of the season and later at the end of it. The model was most precise in predicting the first moth in the trap and peak emergence (an emergence proportion of 0.50) with 82.82% correctly predicted dates and an average deviation ranging between 2.00 and 2.09 days. The prognosis was less accurate at an emergence proportion of 0.75 with 4.27 days average deviation and only 45.45% of the dates forecasted correctly. At the beginning of the season, early and late predictions occurred in the same ratio. However, at an emergence proportion of 0.50 and 75 the forecast was more often late than early (table 6).
Regression between observed and predicted cumulative emergence proportions. Model = solid line, prediction interval (95%) = dashed line.

Estimated cumulative development rate for C. nigricana at different cumulative emergence proportions from pheromone trap catches and the corresponding prediction quality

SE, standard error.
The prediction quality includes the average absolute deviation (days) from observed emergence of the independent test data set, as well as the percentage of correctly predicted dates. The forecast was considered as correct, if the estimated date did not exceed a 3 days threshold, as the trap control was performed every third day.
Discussion
Limited natural resources combined with changing climatic conditions present demanding challenges for agricultural pest management. A desirable shift towards a sustainable agricultural system is the reduction of pesticide use. Comprehensive DSSs are useful tools to support farmers in this task.
As a first step towards a DSS for the pea pest C. nigricana the current study described field emergence as a non-linear function of cumulative post-diapause development rate. We performed laboratory experiments to estimate the dependence of development rate on temperature and photoperiod.
Although past studies (Graham, Reference Graham1984) indicate that pea moth males might develop faster than females (i.e. the species might be protandric) we found no difference between the development time of males and females under all tested temperatures and photoperiods. The moth collection in the field studies of Graham (Reference Graham1984) was performed with a suction trap and the supposed protandry is based on the higher percentage of male catches in comparison with female catches before peak emergence, even though the first moths of both sexes were caught in the same week. Considering that unmated males show a more active flight behaviour than females, and most males are unmated at the start of emergence, the difference in sex ratio between male and female catches before peak emergence could be an artefact of the trapping procedure (Lewis et al., Reference Lewis, Wall, Macaulay and Greenway1975). The considerably lower total number of females captured supports this assumption.
Five different light regimes were tested. However, we found no significant influence of light on development time. Even in darkness, C. nigricana was able to complete development, without any influence on the mean emergence time. The results of this study support the findings of Nußbaum (Reference Nußbaum1976) and Stenmark (Reference Stenmark1971), who rejected the impact of photoperiod on C. nigricana emergence. In general, photoperiod often plays a role in the initiation of winter diapause and less in its termination (for a review see Koštál, Reference Koštál2006), as diapause development often diminishes the sensitivity to photoperiod (for further discussion see Tauber and Tauber, Reference Tauber and Tauber1976; Danks, Reference Danks1987).
In contrast to photoperiod, temperature significantly affected the development time in the pea moth. Among four different non-linear development rate models tested, the four parameter Brière function (Brière et al., Reference Brière, Le Roux and Pierre1999) best described the mean development rates of C. nigricana as a function of temperature. The model estimated a lower development threshold at 8.14°C, which is somewhat lower than that proposed by Nußbaum (Reference Nußbaum1976) and Stenmark (Reference Stenmark1971). The upper development threshold was estimated at 39.80°C and the optimal development temperature at 29.17°C. Former studies have primarily focused on computing a development threshold and a temperature constant, based on the degree-day approach (Wheatley and Dunn, Reference Wheatley and Dunn1962; Stenmark, Reference Stenmark1971; Nußbaum, Reference Nußbaum1976). This approach assumes that development rate is a linear function of temperature. The physiological time needed to complete a development stage is than calculated by summing up heat units (degree-days) above and below a certain organism specific temperature threshold (Allen, Reference Allen1976). The simple calculation of this method led to its widespread use for agricultural pest control (Ahmad, Reference Ahmad1988; Bergh and Judd, Reference Bergh and Judd1993; Bernal and Gonzalez, Reference Bernal and Gonzalez1993; Kumral et al., Reference Kumral, Kovanci and Akbudak2008; Jones et al., Reference Jones, Hilton, Brunner, Bentley, Alston, Barrett, Van Steenwyk, Hull, Walgenbach, Coates and Smith2013). Yet, the inherent relationship between development and temperature of poikilothermic organisms is only linear in a certain temperature range, mostly the region of moderate temperatures. Therefore, this approach gives fairly accurate results within an intermediate temperature range, but lacks precision in describing temperatures close to the lower and upper development thresholds (Bonhomme, Reference Bonhomme2000; Moore and Remais, Reference Moore and Remais2014; Molnár et al., Reference Molnár, Sckrabulis, Altman and Raffel2017). This can lead to unsatisfying projections on the development time under field conditions (Moore et al., Reference Moore, Liang, Akullian and Remais2012; Marchioro et al., Reference Marchioro, Krechemer, de Moraes and Foerster2015). Especially in light of global warming, with rising average temperatures and more and longer heat waves (ICCP, 2014), non-linear TCPs are considered more reliable for predictions of peak population levels (Damos and Savopoulou-Soultani, Reference Damos and Savopoulou-Soultani2012; Molnár et al., Reference Molnár, Sckrabulis, Altman and Raffel2017; Rebaudo and Rabhi, Reference Rebaudo and Rabhi2018), which are essential for an optimal timing of direct control measures.
Development rate models cannot account for within-population variability as they are based on mean or median values for all individuals (Rebaudo and Rabhi, Reference Rebaudo and Rabhi2018; Pollard et al., Reference Pollard, Griffin, de Andrade Moral, Duffy, Chuche, Gaffney, Fealy and Fealy2020). Accordingly, we fit a non-linear distribution function to field data in order to establish a relation between the cumulative development rate and field emergence. The three parameter Gompertz function (Gompertz, Reference Gompertz1825) was selected as the candidate distribution model. The most precise results were achieved for the first moth in the trap and peak emergence. The peak emergence is particularly important for a correct timing of pesticide application against C. nigricana. Bearing in mind that the trap control was carried out every third day a deviation of only 2.09 days is considered very precise (Racca et al., Reference Racca, Zeuner, Jung, Kleinhenz, Oerke, Gerhards, Menz and Sikora2010). These results can be included in a ready-to-use tool for practitioners that forecasts optimum spraying dates and aims at reducing pesticide use without need of laborious pheromone trap monitoring. The application of such a DSS can ultimately result in a resource efficient and effective management strategy for C. nigricana. However, a DSS must further account for the migration dynamics, which are highly influenced by the flowering time of pea plants (Thöming and Knudsen, Reference Thöming and Knudsen2014; Thöming et al., Reference Thöming, Norli, Saucke and Knudsen2014; Thöming and Norli, Reference Thöming and Norli2015) and the pea moth egg development (Lewis and Sturgeon, Reference Lewis and Sturgeon1978; Macaulay et al., Reference Macaulay, Etheridge, Garthwaite, Greenway, Wall and Goodchild1985).
Furthermore, some limitations should be noted. Pea moth emergence in climate chamber experiments was generally low, especially at a temperature of 24°C. We used field collected material and therefore assume that this low emergence rate is mainly related to biotic mortality factors such as natural parasitism and entomopathogenic fungi. The analyses of C. nigricana parasitization and of thermal requirements of the parasitoids could not only explain the survival rate to some extent but also be interesting in view of climate change, since increasing temperatures could influence host–parasitoid interactions (Furlong and Zalucki, Reference Furlong and Zalucki2017). However, such an analysis was beyond the scope of this study.
The incorrect forecasts tended to be too late, especially at the end of season. Either the emergence of C. nigricana is an inherently variable process or the interpolated temperature data are not perfectly capturing the temperature variation the moth experiences in the soil. The field temperatures used were hourly air temperatures, interpolated for a height of 2 m. We used hourly temperatures to account for a possible influence of daily temperature cycles on insect development (Liu et al., Reference Liu, Zhang and Zhu1995). As the emergence of C. nigricana depends on soil temperatures, the air temperatures can only be an approximation towards the real conditions. Hourly interpolated soil temperatures were not available, but could decrease the prediction error associated with expected differences between air and soil temperatures.
Moreover, our study only presents results from a limited number of sites for one geographic region. As the adaptation between temperature and development might vary between populations from different geographic locations (Honek, Reference Honek1996; Angert et al., Reference Angert, Sheth and Paul2011), validation data from various regions in Germany or other countries is necessary in order to test the generalizability of the model. In addition, potential variations of TCPs among C. nigricana populations can provide important information about climatically driven adaptations and potential responses to climate change. Finally, commercially available pheromone traps contain (E,E)-8,10-dodecadienyl acetate, a synthetic attractant that imitates sex-pheromones emitted by female moths to attract unmated males. A pheromone trap therefore only monitors field behaviour of male moths (Lewis et al., Reference Lewis, Wall, Macaulay and Greenway1975). In further development stages of the model, using traps that contains plant volatiles (kairomones) and can attract mated females, could increase the precision of the final model. However, such traps are not commercially available and would likely require extensive research to develop (Thöming and Norli, Reference Thöming and Norli2015).
Acknowledgements
The study is supported through funding from the Federal Ministry of Food and Agriculture (BMEL), based on a decision of the parliament of the Federal Republic of Germany via the Federal Agency for Agriculture and Food (BLE) under the Federal Organic Farming Scheme and other forms of Sustainable Agriculture (BÖLN) (project no. 28/12OE012, 2812OE034, CYDNIGPRO). We would like to thank Markus Hammer-Weis, Sandra Carnaghi, Christopher Hilbert, Janina Ridthaler, Fabian Stampa and Lena Franke for comprehensive support in laboratory and field.
Conflict of interest
The authors have no known conflicts of interest with respect to material presented in this paper.