1 Introduction
There is a growing body of evidence in support of the hypothesis that temporal patterns in speech production are characteristic of phonological organisation (e.g. Browman & Goldstein Reference Browman and Goldstein1988, Krakow Reference Krakow1989, Reference Krakow1999, Sproat & Fujimura Reference Sproat and Fujimura1993, Byrd Reference Byrd1995, Reference Byrd1996, Honorof & Browman Reference Honorof, Browman, Elenius and Branderud1995, Goldstein et al. Reference Goldstein, Chitoran, Selkirk, Trouvain and Barry2007). The main aim of this paper is to employ these patterns in evaluating competing proposals on syllable structure. To this end, we develop rigorous tools for evaluating the relation between syllable structure and patterns of temporal stability in articulatory data. These include statistical procedures for evaluating stability and a model which generates temporal data given a syllabic parse as input. The statistical methods allow us to quantify and assess the effect of structural organisation on temporal stability. The model allows us to demonstrate the gradient range of temporal manifestations of an invariant phonological structure. Together, these tools provide the means to rigorously evaluate hypotheses about syllabification using experimental data.
Our empirical domain is initial consonant clusters in Moroccan Arabic, henceforth MA. Previous theoretical accounts of MA syllables can be divided into two broad classes, based on how they parse initial clusters. Those which admit complex onsets, henceforth collectively the ‘complex onset hypothesis’, organise strings such as /kra/ ‘rent’ and /skru/ ‘his ploughshares’ into one syllable (Benhallam Reference Benhallam1980: 78, 1990, Keegan Reference Keegan and Dimmendaal1986: 214, Heath Reference Heath1987: 266, 271–272, Benkirane 1998: 346). Those which ban complex onsets, henceforth collectively the ‘simplex onset hypothesis’, divide such strings into two syllables ([k.ra] and [sk.ru]) (Boudlal Reference Boudlal2001: 62, Kiparsky 2003: 159–160, Dell & Elmedlaoui Reference Dell and Elmedlaoui2002: 292).Footnote 1 Each of these proposals unifies the description of the same set of core facts using different syllabic representations (at least if we restrict ourselves to ‘internal evidence’ in the sense of Kenstowicz & Kisseberth Reference Kenstowicz and Kisseberth1979: 139, 160–161).Footnote 2 For example, several authors adopt the complex onset hypothesis to account for the environments in which the e vocoid appears in descriptive grammars of MA (Harrell Reference Harrell1962, Harrell & Sobelman Reference Harrell and Sobelman1966, Harrell & Brunot Reference Harrell and Brunot2004). The phonetic material produced in these environments has been analysed variably as either a short vowel (Harris Reference Harris1942, Benhallam Reference Benhallam1980, Reference Benhallam1990, Keegan Reference Keegan and Dimmendaal1986, Heath Reference Heath1987, Boudlal Reference Boudlal2001) or as a transition between consonants (Dell & Elmedlaoui Reference Dell and Elmedlaoui2002, Gafos Reference Gafos2002). The key fact for our purposes is that, regardless of the nature of this vocoid, authors agree that it does not occur between consonants in initial clusters, e.g. #CCV. On the complex onset hypothesis, this is because the vocoid in question is prevented in complex syllable onsets. On the simplex onset hypothesis, it is because the vocoid is prevented at syllable boundaries.
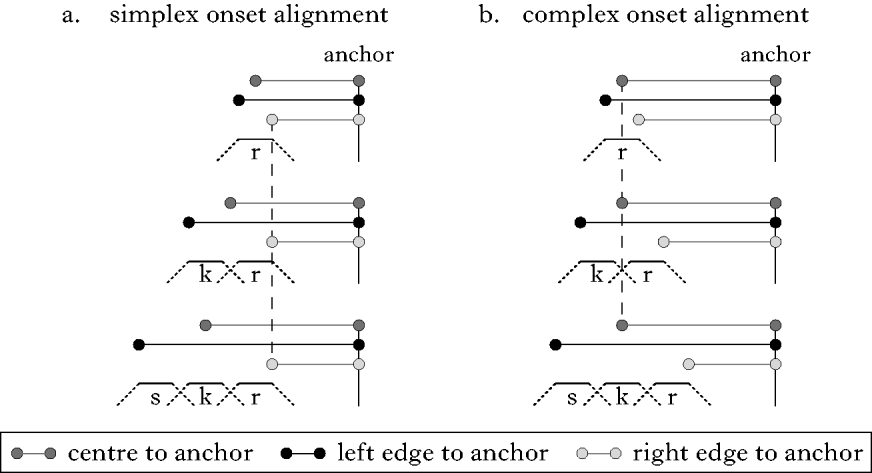
In this paper we seek to distinguish between the simplex and complex onset hypotheses on the basis of temporal stability patterns in articulatory data. We begin by employing phonetic heuristics from past articulatory work on English (Browman & Goldstein Reference Browman and Goldstein1988, Byrd Reference Byrd1995, Honorof & Browman Reference Honorof, Browman, Elenius and Branderud1995).Footnote 3 These heuristics are illustrated with the temporal alignment schemas in Fig. 1, corresponding to simplex (a) and complex (b) onsets. In these schemas, the temporal structure of segments is represented by three connected lines: a dotted line corresponding to movement towards constriction, a solid line corresponding to constriction duration and a second dotted line corresponding to movement away from constriction. For both alignment schemas, three words differing in the number of initial consonants, r, kr, skr, are shown. In addition, the figure shows three intervals for each word type. The intervals are left-delimited by the left edge, right edge and centre of the consonant cluster, and right-delimited by a common anchor point. The relevant pattern is in how the duration of different intervals changes across words with increasing numbers of initial consonants, e.g. laid, played, splayed or rue, crew, screw. The most stable interval in each alignment schema is denoted by a vertical dashed line running from top to bottom, across all words within that schema. Simplex onset alignment corresponds to a pattern whereby the right edge to anchor interval is more stable than the centre to anchor interval or the left edge to anchor interval (Byrd Reference Byrd1995). Complex onset alignment corresponds to a different pattern, whereby the centre to anchor interval is more stable across words than the left edge to anchor interval and the right edge to anchor interval (Browman & Goldstein Reference Honorof, Browman, Elenius and Branderud1988, Honorof & Browman Reference Browman and Goldstein1995).
Schematic representation of three intervals delineated by points in an initial consonant cluster and a common anchor. The alignment schema on the left represents temporal predictions of the simplex onset hypothesis. The alignment schema on the right represents predictions of the complex onset hypothesis.

When applied to our MA data, we find that the phonetic heuristics schematised above provide a good first diagnostic of syllable structure. However, under certain conditions these heuristics break down. That is, even though by and large the phonetic evidence in our data points in the direction of simplex onsets, we do find some evidence that appears to be more consistent with complex onsets. The conditions under which such evidence surfaces appear to be systematic. This brings us to an important and heretofore unaddressed issue in the relation between experimental data and syllable structure: how reliably do stability metrics reflect the underlying organisation of phonological form in terms of syllables? To address this question, the paper develops a model that allows us to study the relation between patterns of interval stability and posited phonological organisation. The model exposes the range of validity of the stability heuristics, and makes new testable predictions about the experimental data. These predictions allow us to evaluate the fit of a syllable parse to experimental data even in those cases where phonetic heuristics break down. Using the model as an analytical tool we are therefore able to verify that the simplex onset hypothesis is consistent with all of the data examined herein.
The remainder of this paper is organised as follows. After describing our methods in §2, §3 takes a first pass at using stability-based heuristics to evaluate syllable structure. This section analyses the stability of the three interval types schematised in Fig. 1. The analysis is conducted using two different anchor points. In §3.1, we find patterns of stability consistent only with the simplex onset hypothesis. In §3.2, using a different anchor point, we find patterns which appear at first to be inconsistent with the simplex onset hypothesis. To better understand the mixed results in §3, we constructed a model that encodes the simplex onset hypothesis as a series of articulatory landmarks linked by temporal relations. We report simulations based on this model in §4. The simulations matched the complete range of stability patterns in our data, including those which at first appeared to be inconsistent with the simplex onset hypothesis. In addition, the simulations generated new predictions which allowed us to further verify the simplex onset hypothesis even under those conditions in which the phonetic heuristics break down. In §5 we offer brief concluding remarks and indicate some directions for future work.
2 Data collection and analysis
2.1 Data collection
2.1.1 Electromagnetic Articulometry
Electromagnetic Articulometry systems are highly appropriate tools for the collection of real-time lingual articulatory movement data. In Electromagnetic Articulometry (EMA; Perkell et al. Reference Perkell, Cohen, Svirsky, Matthies, Garabieta and Jackson1992), an electromagnetic field is used to track movements of small receiver coils, about 2 mm in diameter, attached to the speech articulators using special adhesive. The transmitter coils produce alternating magnetic fields at different frequencies in the range of about 10 kHz. Receiver coils passing through this field generate an electric signal. The voltage of the signal is directly related to the distance and orientation of the receivers relative to the transmitter coils. This relationship is used to calculate the position of the receivers as a function of time.
Our data were collected from one male speaker of the Oujda dialect of MA using the three-dimensional system at the Institut für Phonetik und Sprachverarbeitung, Munich (Hoole et al. Reference Hoole, Zierdt, Geng, Solé, Recasens and Romero2003).Footnote 4 Six transmitter coils were fixed on a cubic plastic apparatus surrounding the speaker's head. EMA receivers were placed on the speaker's jaw, tongue tip, lower lip, upper lip and tongue back.Footnote 5 Audio data was collected concurrently with a directional microphone at a sampling rate of 24 kHz.
2.1.2 Materials
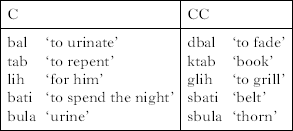
Two sets of stimuli were constructed and presented to the same speaker in different recording sessions. The first set included three or four repetitions of each of the C~CC minimal pairs in Table I, for a total of 36 tokens. The words in each pair differed only in the number of initial consonants in the word. Target words were produced in the carrier phrase /galha_tɨlt mɨrrat/ ‘he said to her_three times’.
Stimuli for first recording.

In the second recording session, two sets of triads, given in Table II, differing only in the number of initial consonants, were produced ten times each for a total of 60 tokens. One set consisted of only real words; the other consisted of nonce words.Footnote 6 Target stimuli were produced in the carrier phrase /ʒibi_hnaja/ ‘bring_here’. For both sessions, words in the target lists were separated by fillers, which consisted of unrelated words included for a separate experiment.
Stimuli for second recording.

2.2 Data analysis
The articulatory dataset produced by the EMA recordings was analysed using a Matlab-based program, developed at Haskins Laboratories by Mark Tiede and adapted to our data by us. The program displays the positional signal acquired from the EMA data in synchrony with the acoustic waveform, spectrogram and velocity trajectories, which were computed by differentiating the positional signal of each receiver.Footnote 7
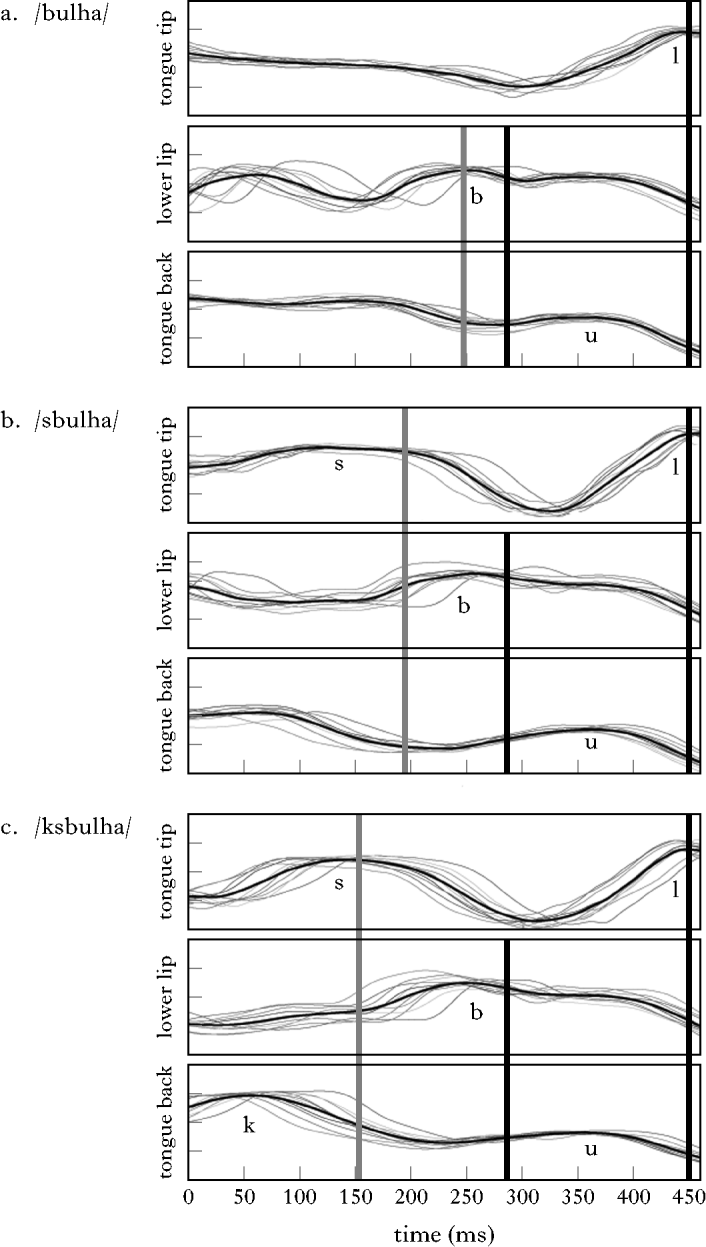
The EMA receiver used to delineate movements associated with a consonant was the one corresponding to the consonant's primary oral articulator – tongue tip: [d t], lower lip: [b], tongue back: [g k]. The tongue-back receiver was also used to identify the vowels: [u a i]. Figure 2 displays the data collected for the /bulha~sbulha~ksbulha/ triad. Each word corresponds to a set of panels. Figure 2a corresponds to /bulha/, Fig. 2b to /sbulha/ and Fig. 2c to /ksbulha/. For each word, the positional signal in the y-dimension is shown.Footnote 8 Each panel shows ten trajectories (grey lines) corresponding to individual repetitions of the word along with a highlighted ensemble average (black line).
Positional signal in the y-dimension for 3 different receivers (tongue tip, lower lip and tongue back) for 10 repetitions each of (a) /bulha/, (b) /sbulha/ and (c) /ksbulha/. The leftmost vertical line demarcates the midpoint of the initial consonant cluster. The middle vertical line demarcates the release of the prevocalic consonant [b]. The rightmost vertical line demarcates the point of maximum constriction in the postvocalic consonant [l]. Distances between tickmarks on the y-axis correspond to 5 mm.

To facilitate discussion, three vertical lines are drawn for each word. The repetitions in Fig. 2 are aligned with respect to the maximal vertical displacement of the tongue-tip movement corresponding to [l]. The rightmost vertical line for each word is drawn at this anchor point. A second vertical line is drawn at the release of the lower lip constriction for the [b]. Another vertical line is drawn at the centre of the word-initial consonant cluster.
Inspecting these data leads to a number of impressionistic observations. First, the timing of the release of [b] relative to the vowel does not seem to change much across word types. Although we will quantify this stability more rigorously, for now it suffices to indicate it by the alignment of the vertical black lines across different words. Second, in contrast to what is observed for the release of [b], the centre of the consonant cluster gets farther away from the anchor point with each consonant added to the string. This is indicated by the progressive leftward shift of the vertical grey lines from /bulha/ to /sbulha/ to /ksbulha/.
Evaluating syllable-structure hypotheses from measures of interval stability requires two additional steps. First, we must extract the relevant intervals from continuous data. Second, we must evaluate the variability of these intervals across repetitions and across words. To quantify the impressionistic observations stated above, we defined intervals on articulatory landmarks extracted from the data. We now define and exemplify those landmarks.
The temporal life of a linguistically relevant articulatory movement can be decomposed into a series of landmarks (Gafos Reference Gafos2002: 276). These landmarks include the onset of movement toward a target, the achievement of a target, the onset of movement away from that target and the offset of movement. In the remainder of the paper we reserve the term onset to refer to a syllable onset and refer to the onset of articulatory movement toward a target as Start. Other labels for articulatory landmarks are listed in (1).
(1) Articulatory landmark labels
a. Start: the onset of movement towards an articulatory target
b. Target: achievement of an articulatory target
c. Release: the onset of movement away from an articulatory target
d. End: the offset of controlled movement away from an articulatory target
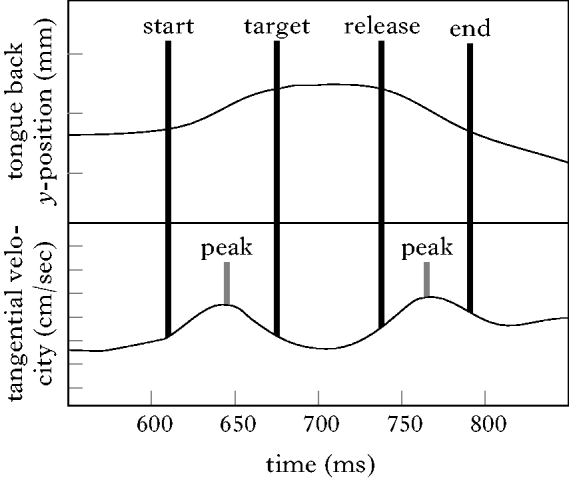
For each segment, the landmarks in (1) were identified by referencing the velocity signal of the relevant articulator. Figure 3 shows the positional (top) and velocity (bottom) signals for the tongue-back receiver during the production of [k] in /ksbulha/. The landmarks defined above are labelled on the positional signal. Velocity peaks are labelled on the velocity signal. The peaks in tangential velocity correspond to movements to and away from linguistic targets. Troughs in the velocity signal correspond to the hold phase of a segment's articulation, also known as the plateau. The timestamps of Start and Target were obtained by referencing the velocity peak associated with movement towards a target constriction. The timestamps of Release and End were obtained by referencing the velocity peak associated with movement away from constriction. The above landmarks were identified automatically by an algorithm. The algorithm locates the timestamp at which instantaneous velocity exceeds, in the case of Start and Release, or falls below, in the case of Target and End, a set percentage of the velocity peak associated with movement toward or away from an articulatory target.
An example of measurements from the [k] portion of /ksbulha/. The top panel shows the positional signal in the vertical dimension of the tongue-back receiver (y-axis in mm) as a function of time (x-axis in msec); distances between tickmarks on the y-axis correspond to 5 mm. The bottom panel shows the instantaneous magnitude of the tangential velocity of the same receiver (in cm/sec); distances between tickmarks on the y-axis correspond to 5 cm/sec.

Parsing articulatory landmarks from the continuous signal using the above procedure yields a series of timestamps intended to index specific articulatory events. In the following sections, these timestamps are used to quantify patterns of temporal organisation corresponding to different syllable-structure hypotheses.
3 Stability analysis
In this section, we use temporal stability to diagnose syllable structure. This involves comparing the duration of temporal intervals across different cluster sizes. Competing hypotheses on syllable structure implicate different patterns of interval stability. These differing predictions allow us to test for the presence of a syllable boundary between the consonants of initial clusters in MA.
In order to evaluate which pattern of stability best characterises our MA data, we measured intervals from the left edge, the centre and the right edge of consonant clusters to a common anchor. We conducted this analysis twice, once using an anchor defined by a landmark in the postvocalic consonant (§3.1) and once using an anchor defined by a landmark in the vowel (§3.2). Both of these analyses used the same consonant-cluster landmarks to delimit the left edge of intervals. That is, regardless of the anchor, the left edge of the consonant cluster was defined as the Target landmark of the first consonant in that cluster, e.g. b target for /bulha/, s target for /sbulha/, k target for /ksbulha/. The right edge was defined as the Release landmark of the immediately prevocalic consonant, e.g. b release in /bulha/, /sbulha/ and /ksbulha/. The centre of the cluster was calculated by taking the mean of the midpoints of each consonant in the cluster, where consonant midpoint refers to the point equidistant from the Target and Release landmarks in each consonant. This way of identifying the centre of the cluster involves a contribution from each prevocalic consonant. It therefore provides a global index of the entire consonant cluster (Browman & Goldstein Reference Browman and Goldstein1988).
For each interval, a measure of its stability must be employed. The standard deviation (SD) of an interval's duration is one such widely used measure. However, in our case the intervals we wish to compare have intrinsically different means (i.e. the mean duration of the left edge to anchor interval and centre to anchor interval will always be larger than the mean duration of the right edge to anchor interval). Therefore, the relative standard deviation (RSD) or ‘coefficient of variance’, as calculated in (2), provides a better measure of stability for our purposes (Frank & Althoen Reference Frank and Althoen1995: 58–59).Footnote 9
(2) Relative standard deviation (RSD)
RSD-100 × standard deviation ' mean
To quantify the statistical reliability of differences in interval stability, we make use of the repeated measures ANOVA model. This model allows for multiple (‘repeated’) measurements of the same dependent variable under different conditions. In our specific case, the dependent variable is interval duration. The model evaluates whether the effect of phonetic context, i.e. cluster size and segment identity, is uniform across interval type (left edge to anchor, centre to anchor, right edge to anchor). A significant interaction between interval type and cluster size would indicate that some intervals are more stable across contexts than others. Both proposals on syllable structure predict such interaction. But, crucially, the complex and simplex onset hypotheses predict different sources of interaction. The simplex onset hypothesis predicts an effect of cluster size on the left edge to anchor interval and the centre to anchor interval, but not on the right edge to anchor interval. The complex onset hypothesis predicts an effect of cluster size on the left edge to anchor interval and the right edge to anchor interval but not on the centre to anchor interval.
3.1 Consonantal anchor
We first report on intervals delimited by a consonantal anchor. This anchor was defined by the point of maximum constriction of the postvocalic consonant for each word set. For the set /bulha~sbulha~ksbulha/ the postvocalic consonant is [l], for /bati~sbati/ the postvocalic consonant is [t] and so on. Since there is no oral constriction in the postvocalic consonant of /lih~glih/, this set did not contribute any measurements.
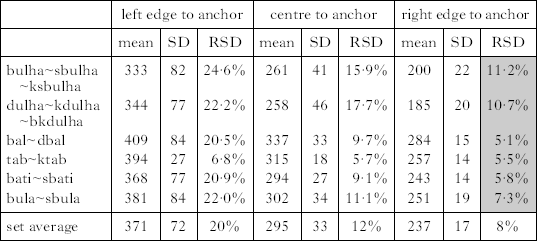
Table III breaks the data down by stimulus set. We report the mean, SD and RSD of the measured intervals. The interval with the lowest RSD in each set is shaded. The table shows that for each word set (row), the right edge to anchor is the interval with the lowest RSD across tokens. In stark contrast, Browman & Goldstein (Reference Browman and Goldstein1988) find that for English data, the SD of the interval delineated by the right edge to anchor is roughly twice the SD of the centre to anchor interval. In our MA data, however, the SD is lower for the right edge to anchor interval in all cases. Thus, unlike in English, the centre to anchor interval has no clear stability advantage over other measured intervals.
Mean, SD and RSD of intervals delineated by three points in the consonantal cluster and a consonantal anchor for word sets containing dyads or triads differing in the number of initial consonants.

Although Table III shows that right edge to anchor has the lowest RSD for all comparisons in our corpus, we would like to evaluate the statistical reliability of this difference, both in our corpus and in the general case. The RSD of the centre to anchor interval for the /bulha~sbulha~ksbulha/ triad, for example, was 15·9% compared with 11·2% for right edge to anchor. Is this a large enough difference to declare that the right edge is more stable?
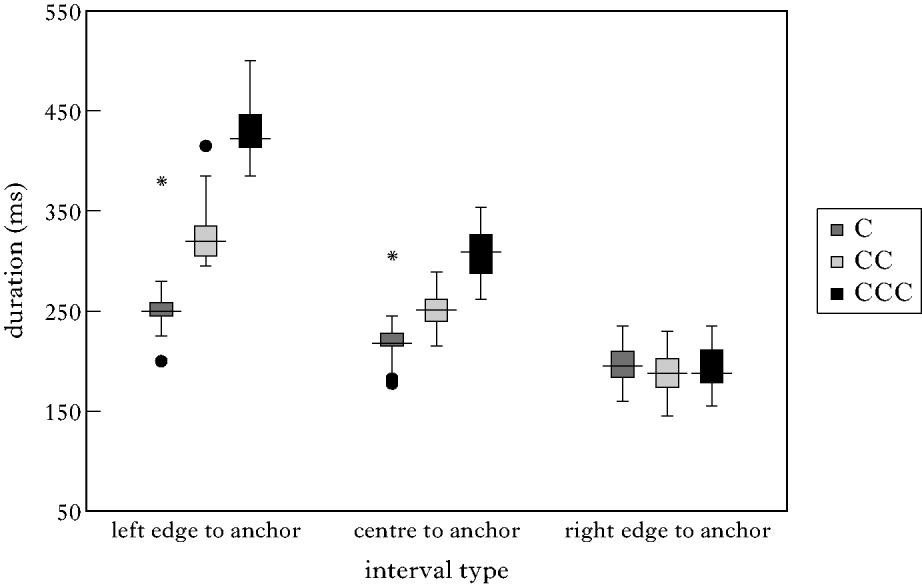
To provide a statistical test of differences in interval variability, we subjected the set of interval durations for tokens comprising the /bulha~sbulha~ksbulha/ and /dulha~kdulha~bkdulha/ sets (n=60) to a repeated measures ANOVA, with Greenhouse-Geisser correction. These sets were chosen because they have the largest number of repetitions per word and are matched for vowel quality and anchor-consonant identity. The repeated measures ANOVA model treats the different intervals (left edge to anchor, centre to anchor, right edge to anchor) as a within-token variable interval type, and the number of consonants in the initial cluster (C, CC, CCC) and the segmental context (/ksb/, /bkd/) as across-token variables, cluster size and segment identity respectively. The box plots in Fig. 4 collapse across segmental contexts to illustrate the main trends in our data with respect to interval type and cluster size. As the number of consonants in the initial cluster increases, the median duration of intervals measured from the left edge to anchor and centre to anchor increase sharply. In contrast, the right edge to anchor interval varies little as a function of cluster size.
Intervals delineated by the left edge, right edge and centre of initial consonant clusters and a consonantal anchor.

The main within-token effect of interval type (F(1·08, 58·07)=2351·11, p<0·001) and the main across-token effect of cluster size (F(2, 54)=67·61, p<0·001) were significant. The main across-token effect of segment identity (F(1, 54)=2·63, p=0·111) and the interaction between cluster size and segment identity (F(2, 54)=1·03, p=0·363) were not significant. There was a significant interaction between interval type and cluster size (F(2·15, 58·07)=296·68, p<0·001). This indicates that the effect of cluster size is not uniform across all intervals. Separate ANOVAs were conducted post hoc for each level of interval type, with cluster size as an independent variable. Significant results were obtained for left edge to anchor (F(2, 54)=167·22, p<0·001) and for centre to anchor (F(2, 54)=69·38, p<0·001), indicating that the addition of a consonant reliably affected the timing of these intervals. Crucially, the effect of cluster size on the right edge to anchor interval was not significant (F(2, 54)=0·688, p=0·507). This shows that dividing the right edge to anchor interval measurements into groups based on the number of consonants in a cluster does not account for more variance than treating all right edge to anchor intervals as a homogeneous group. This result is in complete conformity with the simplex onset-alignment schema.
Post hoc tests were conducted to determine the source of the significant effect of cluster size on the left edge to anchor and centre to anchor intervals. A significant difference between #CV and #CCV for the centre to anchor interval would argue against the complex onset hypothesis. This would indicate that the centre to anchor interval is not stable across contexts.Footnote 10 The post hoc test results were that for both intervals, all comparisons (C vs. CC; CC vs. CCC; C vs. CCC) show significant differences at the p<0·001 criterion.
In sum, each consonant added before #CV, i.e. #((C)C)CV, significantly disrupts the duration of the left edge to anchor and centre to anchor intervals but not the right edge to anchor interval. Together with the comparison of RSDs above, these results provide support for the simplex onset hypothesis.Footnote 11 The phonetic heuristic for simplex onsets is right edge to anchor interval stability. We found that across clusters of different sizes, the right edge to anchor interval is more stable than the left edge to anchor or centre to anchor intervals.
3.2 Vocalic anchor
In this section we report a stability analysis using the End landmark of the vowel, Vend, as the anchor point. Table IV reports the mean, SD and RSD of the three interval types for each stimulus set.
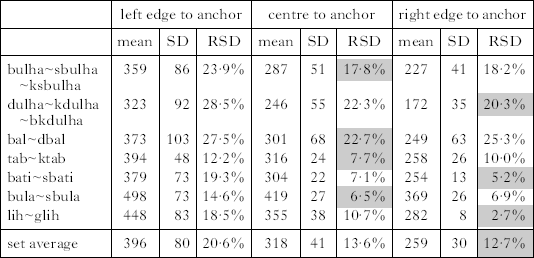
Mean, SD and RSD of intervals delineated by three points in the consonantal cluster and a vocalic anchor for word sets containing dyads or triads differing in the number of initial consonants.

Overall, intervals delineated by the vocalic anchor had higher SD across all measurements and word types than intervals delineated by the consonantal anchor. This difference is particularly salient for closed syllables. For several of the sets in Table IV, both the SD and RSD values are higher than in Table III for every measured interval. For example, in the /bal~dbal/ set from Table III, the SDs of the centre to anchor and right edge to anchor intervals were 33 ms and 15 ms respectively. When Vend was used as the anchor, the SD of these durations soared to 68 ms and 63 ms, as shown in Table IV. In the presence of this overall increase in interval variability, we see that the right edge to anchor interval no longer has a smaller RSD than the centre to anchor interval for all sets. For four out of the six word sets represented in both Table III and Table IV, the right edge to anchor interval lost its stability advantage. For /bulha~sbulha~ksbulha/, /bula~sbula/, /bal~dbal/ and /tab~ktab/, the centre to anchor interval has a lower RSD than the right edge to anchor interval. This is the pattern predicted by the complex onset hypothesis.
To determine whether the use of a vocalic anchor affected the qualitative results of the stability analysis, we again employ the repeated measures ANOVA, with Greenhouse-Geisser correction, on interval durations. The independent variables were the same as the repeated measures ANOVA for the consonantal anchor reported above.
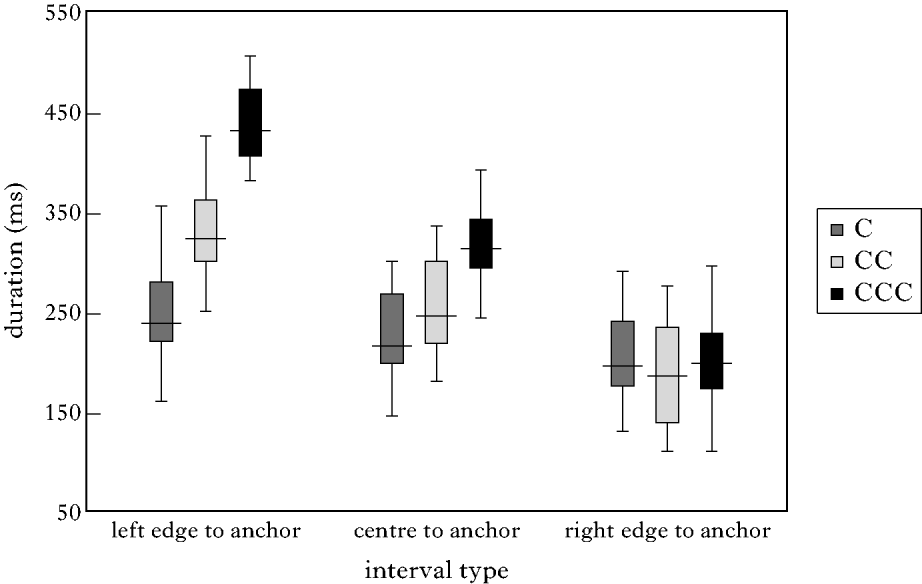
Figure 5 provides box plots, parallel to Fig. 4, of the intervals from consonant cluster landmarks to the Vend anchor by cluster size. Again, the intervals are collapsed across segment types. The general pattern of increasing left edge to anchor and centre to anchor intervals and fairly stable right edge to anchor intervals is the same as in Fig. 4. The most prominent difference between Figs 4 and 5 is that the durations in Fig. 5 are dispersed more widely about the median than those in Fig. 4. This indicates that the variance of intervals delineated by vocalic anchors is higher than the variance of intervals delineated by consonantal anchors. We now examine how this difference in overall variability affects the statistical results.
Intervals delineated by the left edge, right edge and centre of initial consonant clusters and a vocalic anchor.

The results of the ANOVA show significant main effects of the within-token variable interval type (F(1·05, 56·47)=2048·74, p<0·001) and a main effect of the across-token variables of cluster size (F(2, 54)=28·80, p<0·001) and segment identity (F(1, 54)=20·55, p<0·001). The interaction between cluster size and segment identity (F(2, 54)=1·96, p=0·151) was not significant. The significant effect of segment identity indicates that the absolute durations of the intervals are different depending on the segmental identity of the initial consonants. This factor did not reach significance for consonantal anchors above. However, the lack of interactions between segment identity and cluster size indicates that the effect of segment identity is of no theoretical importance with respect to the hypotheses at stake here.
As with the consonantal anchor intervals above, there was a significant interaction between interval type and cluster size (F(2·09, 58·07)=318·30, p<0·001). To further investigate this interaction, one-way ANOVAs were conducted for each level of interval type, with cluster size as the independent variable. Results showed a significant effect of cluster size on the duration of the left edge to anchor interval (F(2, 54)=99·20, p<0·001) and on the duration of the centre to anchor interval (F(2, 54)=27·79, p<0·001). The effect of cluster size on the right edge to anchor interval (F(2, 54)=1·15, p=0·323) was not significant. This indicates that, with Vend as the anchor as well, adding consonants to the initial cluster disrupts the stability of the centre to anchor interval and the left edge to anchor interval, but not the right edge to anchor interval. Thus the main effects obtained for the consonantal anchor above are duplicated with the vocalic anchor.
Post hoc tests with left edge to anchor and centre to anchor intervals as dependent variables allow us to determine the locus of the significant effect of cluster size. For the left edge to anchor interval, all levels of cluster size, C, CC and CCC, were significantly different from each other (p<0·001). For the centre to anchor interval, Tukey's post hoc shows that the significant effect of cluster size is attributable to a difference between the C/CC and CCC (p<0·001) contexts and that there is no significant difference between C and CC (p=0·14). This is a departure from the results obtained above with the consonantal anchor. Lack of significant differences for the centre to anchor interval between C and CC contexts is consistent with the stability pattern characteristic of complex onset alignment. This result was not obtained for consonantal anchor intervals. On the basis of stability-based phonetic heuristics, then, this specific result would be consistent with a tautosyllabic parse of biconsonantal clusters (#CCV) and a heterosyllabic parse of triconsonantal clusters (#C.CCV or #CC.CV). Thus some evidence in our data is compatible with the complex onset hypothesis.
3.3 Summary and methodological remarks
The stability analyses in the preceding sections aim at evaluating competing theoretical proposals on syllable structure. In this section, we summarise their main results and highlight certain methodological points. Given the relative paucity of work in this area, a clarification of our methodological choices seems useful for future work. Our methodology builds on past work, but is also different in important ways.
First, as a measure of interval stability, we proposed the use of RSD as opposed to SD. It is an established property of human motor behaviour that the variance of an interval between two (timed) events increases with increasing mean temporal duration between the two events (Wing & Kristofferson Reference Wing and Kristofferson1973, Schöner Reference Schöner2002). This means that longer intervals will have larger SDs. In our data, robust correlations were obtained between the SD (the square root of the variance) and the mean of each interval type delimited by a consonantal anchor (r(16)=0·534, p<0·05). Thus, using raw SD to index stability constitutes a bias towards finding better stability for the shorter right edge to anchor interval than the longer centre to anchor and left edge to anchor intervals. To illustrate this, consider the SD of intervals delineated by the vocalic anchor. For the /bulha~sbulha~ksbulha/ triad, the SD of the right edge to anchor interval (41 ms) was lower than the SD of the centre to anchor interval (51 ms), yet the RSD of the right edge to anchor interval (18·2%) was slightly higher than the centre to anchor interval (17·8%). Likewise, for /bal~dbal/, the right edge to anchor interval had the lowest SD, but the centre to anchor interval had the lowest RSD. Thus different measures of stability would lead to different interpretations of the same data. In our case, the RSD measure of stability is more conservative than the SD measure because it factors out the effect of interval length on stability.
Another way in which our analysis departs from past work is in the use of articulatorily defined anchors. Past studies have used anchors defined by salient acoustic events. These studies used the achievement of closure of a voiceless (Browman & Goldstein Reference Browman and Goldstein1988, Byrd Reference Byrd1995) or voiced plosive (Honorof & Browman Reference Honorof, Browman, Elenius and Branderud1995), obtained by visual inspection of the acoustic waveform. In the first study of this nature, Browman & Goldstein (Reference Browman and Goldstein1988) motivate this choice primarily from practical concerns. For plosives, the acoustic record provides a clear, consistent landmark, which offers an alternative to identifying a vowel in the continuous articulatory signal. Byrd (Reference Byrd1995: 290), however, points out that the validity of this anchor point rests on the assumption that the ‘the vocalic gesture stands in a consistent relationship with its acoustic offset’. We conducted stability analyses with consonantal and vocalic anchors defined independently and articulatorily. By using articulatory landmarks as anchors we eliminate the restriction that the stability analysis be conducted on syllables closed with a plosive. This is advantageous when testing hypotheses about syllable structure. Typically, such hypotheses hold across a wide range of segmental identities. In addition, we avoid assumptions regarding the consistency of the relation between the movement of articulators and the acoustic offset of the vowel.
Using the methods described above led to clear results when intervals were delimited by a consonantal anchor. In these cases, the right edge to anchor was the most stable interval across cluster sizes for all dyads and triads in our data. Stability-based heuristics for syllable structure point clearly to the simplex onset hypothesis. When the Vend landmark was used as an anchor, then the variability of all intervals increased. For these more variable intervals, we obtained apparently conflicting results. For some dyads and triads, we saw the reverse pattern, whereby the centre to anchor interval had a lower RSD than the right edge to anchor interval. Additionally, the effect of cluster size on the centre to vocalic anchor interval was not significant for comparisons between #CV and #CCV. Both of these results are consistent with the complex onset hypothesis.
In what follows, we seek to better understand these seemingly contradictory results by investigating how stability-based indexes of syllable structure change under different conditions. To anticipate the main result, the analytic tools developed in the next section reveal that both patterns of stability obtained for vocalic anchors are consistent with a single invariant phonological structure.
4 A computational model of interval stability
To make sense of the apparently conflicting evidence in our data, we resort to a model that allows us to study how patterns of temporal stability respond to increases in variability. The model generates articulatory landmarks from a given syllable structure and therefore makes explicit predictions about how that structure affects the stability of temporal intervals. In addition to syllable structure, however, there are other factors (speech rate, lexical statistics of the target word, measurement error, etc.) that may affect the stability of temporal intervals. Our present focus is not the precise nature of the variability source, but rather the way in which variability affects stability-based indexes of syllable structure.
To study this, we introduce random noise into all intervals uniformly and study how stability-based indexes of syllable structure change under conditions of gradually increasing variability. This methodology leads to a novel result regarding the relation between syllable structure and stability patterns. The pattern of stability whereby the centre to anchor interval is more stable than the left edge to anchor and right edge to anchor intervals has been seen as a reflex of complex syllable onsets (Browman & Goldstein Reference Browman and Goldstein1988: 153). This does not mean, however, that this stability pattern necessarily implicates a complex syllable onset. The model developed in this section allows us to evaluate the full range of quantitative instantiations of a phonological structure. Simulations based on the model reveal that even when vowels are timed locally to the prevocalic consonant, as in the simplex onset alignment schema, the centre to anchor interval has a lower RSD than the right edge to anchor interval under certain noise conditions. We refer to such cases as (stability) reversals. In light of these results, we re-examine our experimental data and find that they are in full accord with a model that embodies the predictions of the simplex onset hypothesis. This enables a clear interpretation of the mixed stability results in §3. Overall, the model allows us to make sense of seemingly inconsistent results by illuminating how stability-based indexes are modulated under different conditions of variability.
4.1 Model parameters
The patterns of interval stability in our data by and large provided evidence for the simplex onset hypothesis. In some corners of the data, however, we found patterns of stability consistent with the complex onset hypothesis. These patterns never occurred for intervals delimited by consonantal anchors. However, they did arise for some intervals delimited by vocalic anchors. The latter intervals showed higher SD than the former for every interval type. It seems likely that this higher variability is related to the stability index in a way that may lead to an understanding of these results. The basic proposal is as follows. Consider two intervals of different mean durations. As the SD of these intervals is uniformly increased, the RSD increases at a slower rate for the longer interval than for the shorter interval. This is because RSD divides SD by a larger mean for the longer interval. Thus, the effect of variability on the RSD of an interval is modulated by the mean size of that interval. The longer interval is less sensitive to uniform increases in SD than the shorter one. This indicates that interval stability as a heuristic for syllable structure may be valid only within certain ranges of variability. At high levels of variability, the longer centre to anchor interval (as well as the left edge to anchor interval) may show better stability than the shorter right edge to anchor interval, regardless of phonological structure. Such stability reversals obscure the canonical stability pattern imparted by simplex onsets, where the right edge to anchor interval is expected to be the most stable interval. But as the above logic reveals, such a patterning is in fact consistent with the simplex onset hypothesis. The model described below tests this logic. Our modelling approach is related to earlier work in Gafos (Reference Gafos2002), who models the acoustic consequences of posited coordination relations, and also Smith (Reference Smith, Connell and Arvaniti1995), who pursues the modelling of the relation between rhythmic structure and articulatory data in Japanese and Italian.
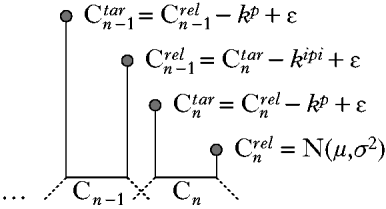
Given a set of word types, #CV, #CCV, #CCCV, the model generates articulatory landmarks defining the plateau of each constituent segment. These landmarks are generated from stochastic versions of local timing relations between consonants and vowels (following Gafos Reference Gafos2002). The algorithm for generating landmarks is summarised in Fig. 6. Landmark generation proceeds by first selecting the timestamp of the Release landmark of the immediately prevocalic consonant, Cnrel, from a Gaussian distribution. The immediately preceding landmark, the Target of that consonant, Cntar, is then generated by subtracting consonant plateau duration, k p, from Cnrel and adding a noise term. These two landmarks, Cntar and Cnrel, define the plateau of the immediately prevocalic consonant. For words with two or more initial consonants, the Release landmark of the preceding consonant Cn−1 (C1 in #C1C2V words and C2 in #C1C2C3V words), was generated by reference to Cntar. The inter-plateau interval, k ipi, was subtracted from Ctarn, and a noise term was added. As before, Ctarn−1 was generated by subtracting plateau duration from Creln−1 and adding a noise term. Landmarks for the initial consonant in #CCCV words were generated following the same procedure.
Generating landmark timestamps for #((C)C)CV words.

In the simulation reported below, k ipi and k p were set to values reflecting averages across our data, 40 ms and 30 ms respectively. The precise values of these constants, however, are not crucial in determining the overall behaviour of the model. The model produces the same qualitative results with a range of k p and k ipi values. The noise term, ε, was generated from a normal distribution of Gaussian noise, with a mean of 0 ms and a SD of 20 ms. The Crel of the immediately prevocalic consonant was selected from a Gaussian distribution, with a mean of 500 ms and a variance of 400 ms. The value for this mean is arbitrary. We choose 500 ms for clarity in presentation, as it ensures that temporally preceding timestamps will be positive. The value for the variance was set to match the noise term associated with other landmarks in the simulation.
The alignment of the vowel to the consonant cluster was in accord with the hypothesis that MA has simplex onsets. Thus, regardless of the number of consonants, the vowel was timed locally and directly to the prevocalic consonant. The anchor point was generated for each consonant cluster by adding a constant, k v, representing vowel length, to the timestamp of the midpoint of the prevocalic consonant. The value of k v used for the simulation results reported below was 250 ms. However, as with the other constants, the same qualitative result was obtained for a wide range of k v values. The specific value of k v chosen reflects the mean vowel length in our data, measured from the right edge of the consonant cluster to the end of the vowel.
To introduce variability into the intervals, a noise term with a mean of 0 ms and gradually increasing standard deviation was added to the anchor. There were a total of 20 stepwise increases. This yielded 20 anchors for each cluster differing only in the level of noise associated with the anchor. For the first anchor (anchor 1), noise had a standard deviation of 20 ms. For each subsequent anchor, the standard deviation increased by steps of 5 ms, so that the last anchor point (anchor 20) had a standard deviation of 120 ms. Introducing noise by systematically changing anchor variability is one way to ensure that variability is uniformly present across all intervals right-delimited by that anchor, e.g. centre to anchor and right edge to anchor.Footnote 12 Since in this way variability is uniformly present across all intervals of interest, we refer to it as ‘overall variability’.
4.2 Simulations
The model described above was used to generate sets of 30 tokens. Each set contained ten instances of each #CV, #CCV and #CCCV word. Using the generated data, we then calculated the relative standard deviation (RSD) of the three interval types, left edge to anchor, centre to anchor and right edge to anchor. Since the anchor points were generated by adding a constant to the immediately prevocalic consonant, the right edge to anchor interval is expected to be more stable than the other intervals, at least under conditions of low overall variability. However, at higher levels of variability, the RSD of the centre to anchor interval should be lower than the right edge to anchor interval.
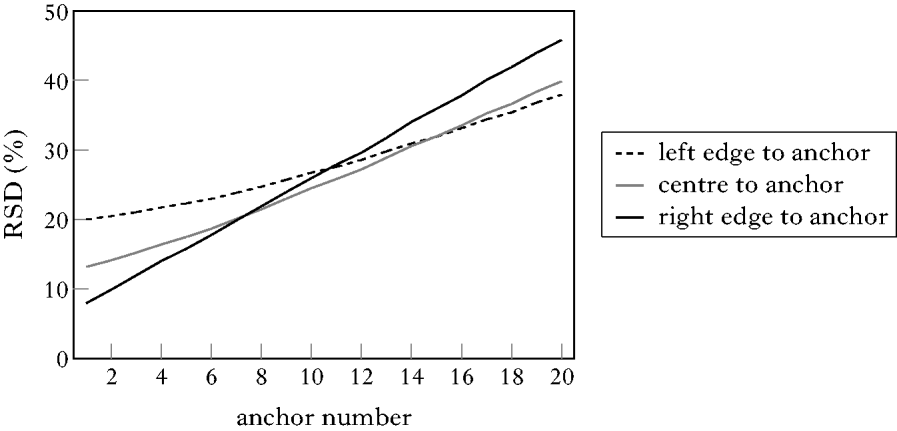
The result of the stability analysis for 1000 iterations of 30 simulated tokens is given in Fig. 7. The y-axis shows the average RSD of the three intervals, left edge to anchor, centre to anchor and right edge to anchor for each anchor (anchor 1 to anchor 20), shown on the x-axis. As expected, the right edge to anchor interval is the most stable interval at low levels of variability (anchor 1 to anchor 6). It can also be seen, however, that as interval variability increases, the RSD of the right edge to anchor interval increases at a faster rate than the RSD of the centre to anchor interval. Ultimately, when the SD of the anchor increases beyond that of anchor 7, the centre to anchor interval shows a lower RSD than the right edge to anchor interval. Thus, at high levels of overall variability, simplex onset alignment gives rise to the pattern whereby the centre to anchor interval is the most stable interval type. Although previous heuristics suggest that centre to anchor stability indicates a complex onset parse (Browman & Goldstein Reference Browman and Goldstein1988: 153), the model qualifies this reasoning by exposing its full range of validity. Under conditions of high overall variability, simplex onset alignment may also generate patterns of centre to anchor interval stability. The simulation results thus confirm that simplex onset alignment can give rise to different patterns of stability under different conditions of variability.
The relative standard deviation (y-axis) of three cluster to anchor intervals (left edge to anchor, centre to anchor, right edge to anchor) by anchors of increasing variability (x-axis).

Because the model is an explicit link between abstract phonological structure and its continuous indexes, it can serve as an analytical tool for reasoning about the former from the latter. Specifically, the model allows us to state precise predictions of the simplex onset hypothesis for patterns of interval stability in relation to overall variability. Although the model gives rise to both stability patterns attested in our data, it predicts stringent conditions on the levels of overall variability at with each pattern may occur. These predictions derive from the main trend shown in Fig. 7. As overall variability increases, stability declines faster for shorter intervals than for longer intervals. Thus, the simplex onset hypothesis, as embodied in the model, makes two related predictions about our data. The first concerns an overall trend. This prediction is that the stability advantage imparted to the right edge to anchor interval gradually diminishes in the presence of noise. The second prediction concerns the individual cases of stability reversals in our data. For dyads and triads that show reversals, the simplex onset hypothesis predicts an implicational relation between the stability pattern and the level of overall variability present in the intervals. We first evaluate the broad prediction of the model by comparing overall trends in the data to the simulation results in Fig. 7. We then evaluate the predictions for specific dyads and triads by zeroing in on just those word sets which showed stability reversals.
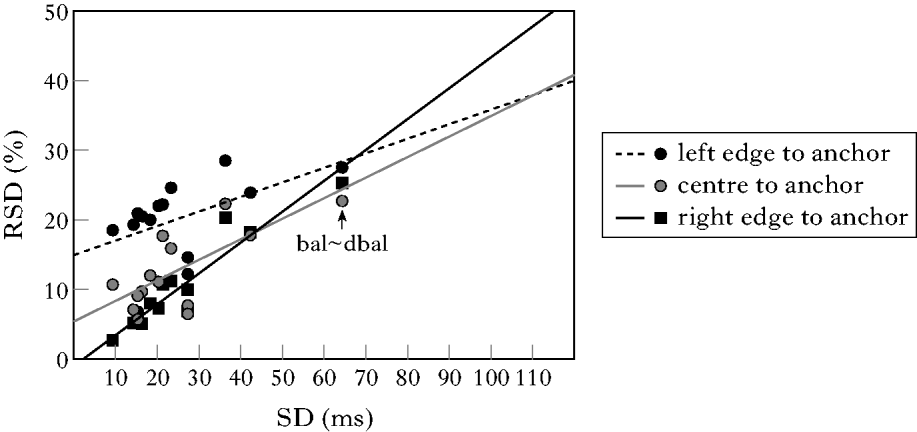
To see how stability patterns in our data change as variability changes, we can select an index of overall variability and plot the RSD for each interval in our data against this index. Figure 8 does this by redisplaying the RSD (y-axis) for each interval reported in Table III (consonantal anchors) and Table IV (vocalic anchors). RSD values are plotted as a function of an overall variability index (x-axis). This index is the SD of the right edge to anchor interval.Footnote 13 Each data point in the figure represents the RSD value for a specific interval at the level of variability present in the pairing of anchor and word set (dyads or triads) from which the interval was taken. For example, the overall level of variability in /bal~dbal/ intervals delineated by the vocalic anchor was 63 ms. At that value on the x-axis, three shapes are plotted. Each shape corresponds to an interval type, and its y-coordinate indicates relative stability in terms of RSD.
The relative standard deviation (y-axis) of three cluster to anchor intervals (left edge to anchor, centre to anchor, right edge to anchor) as a function of the SD of the right edge to anchor interval (x-axis). The best fitting line is shown for each interval type.

To directly illustrate how variability influences stability patterns, regression lines were fit to each interval type. In effect, these lines show how RSD changes as a function of the variability present in the data. The lines were derived by fitting all of the data points in Fig. 8, collapsing across word sets and anchor types. The variability in the data comes from differences in anchors used to right-delimit intervals and also from differences between word sets. The lines show how the RSDs of different interval types behave at different levels of overall variability. The slopes of the lines can therefore be compared to the output of the model in Fig. 7. After looking first at the broad similarities between the data and the model, we then move on to examine the specific word sets that showed stability reversals in our data.
The key similarity between the simulated data in Fig. 7 and the experimental data in Fig. 8 is as follows. The lines in Fig. 7 produced by the model replicate the regression lines fit to the data in Fig. 8. Just as we saw in Fig. 7, the RSDs of the three interval types in the data in Fig. 8 increase at different rates as overall variability increases. More precisely, across the two figures, the RSD of the shortest interval type, right edge to anchor, increases at a faster rate than the RSD of the longer centre to anchor interval. Likewise, the centre to anchor interval increases at a faster rate than the longer left edge to anchor interval. This means that the stability advantage of the right edge to anchor interval in the data is gradiently linked to overall variability. This fact verifies a prediction of the model. As overall variability increases, the difference in RSD between the right edge to anchor and centre to anchor intervals decreases. A significant negative correlation (r(26)=−0·465, p<0·01) between these variables (overall SD vs. difference in RSD between the right edge to anchor and centre to anchor intervals) validates the trend observable in Fig. 8.
We now zoom in from broad trends in the data to examine individual cases of stability reversals. For these cases, the model makes specific predictions. Given a word set (dyad or triad) and two sets of intervals delimited by different anchors extracted from that word set, the model embodying the simplex onset hypothesis predicts the following implicational relationship. If one set of intervals shows centre to anchor stability and the other set shows right edge to anchor stability, then the former set of intervals must have higher overall variability than the later. Further, the opposite relationship is precluded. This prediction allows us to evaluate whether cases of stability reversals are the product of the simplex onset hypothesis, as embodied in the model.
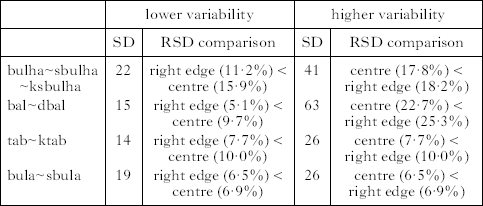
There are four word sets which showed a stability reversal in our data (one triad, three dyads). These are repeated in Table V. The table compares the RSD of the right edge to anchor interval with that of the centre to anchor interval. The left half of the table compares the RSDs of these intervals at low levels of variability (values from Table III, intervals right-delimited by a consonantal anchor). The right half of the table compares the RSDs of these intervals at high levels of variability (values from Table IV, intervals right-delimited by a vocalic anchor). The SD of the right edge to anchor interval, the index of overall variability used above, is provided for each comparison.
Comparison of the RSD of the right edge to anchor interval and the centre to anchor interval for the four word sets that showed stability reversals. The index of overall variability (SD of the right edge to anchor interval) is also given.

The results in Table V show the same pattern for each stability reversal in our data. At the lower level of overall variability, the right edge to anchor interval is more stable than the centre to anchor interval. At the higher level of overall variability, the stability pattern is reversed. In just these cases, the centre to anchor interval has a lower RSD than the right edge to anchor interval. This pattern adheres to the implicational relationship for stability reversals derived from the simplex onset hypothesis. The predicted relationship holds for each stability reversal in our data. Verification of this prediction constitutes evidence in support of the simplex onset hypothesis. This support comes from precisely those cases in which the stability patterns are apparently consistent with the complex onset hypothesis. Thus, the model as an analytical tool also allows us to evaluate the predictions of a syllabic parse in cases where the phonetic heuristics break down.
In evaluating the fit between data and model we have so far concentrated our discussion primarily on intervals left-delimited by the centre and right edge landmarks. These are the intervals that are most crucial for evaluating competing syllabic parses of initial clusters. That is, no syllabic parse predicts that the left edge to anchor interval should show greater stability than other intervals. Our model, however, also makes a prediction about how the left edge to anchor interval is affected by overall variability: for the same reason that the RSD of the centre to anchor interval increases at a slower rate (as overall variability increases) than the right edge to anchor interval, the left edge to anchor interval should have an even slower rate of RSD increase than the other two intervals. This prediction is born out in the data. At low levels of overall variability, the left edge to anchor interval shows the highest RSD of the three intervals. As variability increases, the RSD of the left edge to anchor interval increases at a slower rate than the other intervals. There are no shifts to left edge to anchor interval stability, simply because there are no intervals in our data variable enough to yield this reversal. The predicted trend, however, is apparent in our data. Across our corpus, the jump in RSD from the consonantal anchor to the vocalic anchor is largest for the right edge to anchor interval (5%), followed by the centre to anchor interval (2%), followed by the left edge to anchor interval (1%). This provides additional confirmation of our account of the differential effect of overall variability on the RSD of temporal intervals.
In short, we have seen that stability-based heuristics for syllable structure break down as reliable indexes of such structure at high levels of overall variability. This does not mean, however, that patterns of stability cannot inform phonological structure under these conditions. When heuristics fail, the model as an analytical tool allows us to make sense of the data. Simulations based on the simplex onset hypothesis reveal a gradient relationship between the stability of the right edge to anchor interval and the level of overall variability in the set of intervals. This gradient effect of variability constitutes the basis for stating further predictions. For cases of stability reversal, interval sets which show right edge to anchor interval stability are predicted to have lower overall variability than interval sets for which the centre to anchor interval is the most stable. Thus the model continues to make testable predictions based on the simplex onset hypothesis even for those cases when heuristics point in the direction of the complex onset hypothesis. Based on these finer predictions, we verified that each instance of stability reversal in our data is in accord with the simplex onset hypothesis.
With respect to MA, the core conclusion is that all patterns of interval stability in our data can be seen as consequences of the simplex onset hypothesis. Those results that at first appeared to be at odds with the broader picture from our data turn out to be necessary consequences of the simplex onset hypothesis at levels of high overall variability.
5 Conclusions and directions for future work
In recent years, there has been an increasing awareness that the temporal organisation of phonological form provides a rich and potentially highly informative area in the study of the relation between phonological theory and experimental data. In this paper, we have focused on the relation between certain abstract claims of syllabic organisation in Moroccan Arabic and temporal patterns in experimental data obtained using 3D Electromagnetic Articulometry.
To evaluate competing proposals on initial cluster syllabification, we have looked into the temporal patterns exhibited in our articulatory data. In an analysis of interval stability, we provided evidence for simplex onsets except when overall variability was high. In these latter cases, biconsonantal clusters also showed stability characteristics consistent with the complex onset hypothesis. To make sense of the apparently conflicting evidence in our data, we introduced a computational model. This model served as an explicit link between theoretical claims on syllable structure and temporal patterns in our data. Segments were encoded as a series of articulatory landmarks coordinated in time. Relations between segments were encoded as temporal relations between these landmarks. The temporal relations embodying the simplex onset hypothesis were then used to produce simulated data under different noise conditions. The main result demonstrated was that the temporal organisation of simplex onsets can reproduce the complete range of stability patterns reported in our data. Though simple, the model captured patterns in our data under conditions of both high and low variability. In doing so, it provided evidence for simplex onsets even in those cases when phonetic heuristics broke down.
As the prosodic affiliation of initial consonant clusters is still a matter of debate in a number of languages, e.g. Bella Coola (Bagemihl Reference Bagemihl1991), Semai, Temiar, Kammu (Shaw Reference Shaw1993), Piro (Lin Reference Lin1997) and Italian (Bertinetto Reference Bertinetto2004), there is immediate utility to the analytical techniques developed in this paper. Future work will seek to facilitate application of the tools developed herein to these and other open debates in phonological theory. First, we aim to generalise the methodology to evaluate phonological structure at levels of representation above and below the syllable. In particular, the class of theoretical proposals consistent with the simplex onset hypothesis disagree as to the prosodic status of C1 in #C1C2V, e.g. minor syllable (Boudlal Reference Boudlal2001), mora (Kiparsky 2003) or syllable nucleus (Dell & Elmedlaoui Reference Dell and Elmedlaoui2002). Although we have provided evidence for the simplex onset hypothesis, we have not attempted to distinguish among the different proposals that adhere to this broad hypothesis. Future work will develop temporal predictions which distinguish between different syllabic roles and evaluate these predictions in our data. Second, the experimental data evaluated here was collected using Electromagnetic Articulometry. Although the number of languages for which articulatory data are available is steadily increasing, it is in principle possible to conduct an analysis of interval stability based on the acoustic correlates of articulatory landmarks. This would enable stability-based analyses of structure in languages for which it may be difficult to collect articulatory data. Lastly, our evidence in support of the simplex onset hypothesis for MA came from a model implementing that hypothesis. This model captured the entire range of stability patterns in our data. We have not, however, demonstrated that the patterns of stability in our data are inconsistent with the complex onset hypothesis with comparable rigour. Future work will expand the model to quantitatively evaluate the fit of competing syllable parses to a set of experimental data.