Introduction
Lobaria pulmonaria (L.) Hoffm. is one of the largest and most conspicuous macrolichens in the British Isles and also one of the most studied (e.g. Gauslaa Reference Gauslaa2006; Gauslaa et al. Reference Gauslaa, Lie, Solhaug and Ohlson2006; Pentecost & Richardson Reference Pentecost and Richardson2011; Cornejo & Scheidegger Reference Cornejo and Scheidegger2013; Nascimbene et al. Reference Nascimbene, Casazza, Bensperi, Catalano, Cataldo, Grillo, Isocrono, Matteucci, Ongaro and Potenza2016; Phinney Reference Phinney2019; Gauslaa & Goward Reference Gauslaa and Goward2020). In common with several other Lobaria species, it possesses gall-like bodies termed cephalodia, consisting of dense colonies of the cyanobacterium Nostoc. The main purpose of cephalodia is to export fixed nitrogen to the fungus while the cyanobacterium presumably benefits from occupying a niche in an environment that would otherwise prove unfavourable. Cephalodia of Peltigera aphthosa (L.) Willd., also containing Nostoc, have been shown to transfer fixed nitrogen to the fungus as NH4+ (Rai et al. Reference Rai, Rowell and Stewart1980) where it is rapidly converted to glutamate by the mycobiont (Rai Reference Rai and Galun1988), giving these lichens the potential to grow independently of fixed nitrogen sources. Although there is direct evidence that Lobaria pulmonaria also fixes nitrogen (Millbank & Kershaw Reference Millbank and Kershaw1970), there has been little investigation of the distribution and abundance of its cephalodia in relation to its geographical location and potential external sources of environmental fixed nitrogen. Many of the large foliose lichen species containing cyanobacteria are sensitive to elevated levels of nitrate and ammonia in the atmosphere. In much of England and Wales, L. pulmonaria has declined significantly over the past five decades (Mitchell et al. Reference Mitchell, Truscot, Leith, Cape, van Dijk, Tang, Fowler and Sutton2005; Rose & Purvis Reference Rose, Purvis, Smith, Aptroot, Coppins, Fletcher, Gilbert, James and Wolseley2009) and part of this decline is related to increased environmental fixed nitrogen from agriculture and vehicle emissions (Yemets et al. Reference Yemets, Solhaug and Gauslaa2014; Will-Wolf et al. Reference Will-Wolf, Jovan, Neitlich, Peck and Rosentreter2015). In northern Austria and SW Germany, severe losses of genera such as Lobaria have been reported as a result of this increase (Türk Reference Türk2018). It is therefore hypothesized that nitrogen fixation by Lobaria cephalodia is inversely proportional to the level of fixed atmospheric nitrogen over at least some of its range. The aims of this study are twofold: first, to assess the abundance, biomass and distribution of the cephalodia in the thallus of L. pulmonaria; second, to test the above hypothesis using modelled estimates of fixed nitrogen deposition in two areas of the UK with contrasting atmospheric fixed N sources. One area was chosen in western Scotland (Isle of Skye) where the growth of this species is rapid and the species is locally abundant (Eaton & Ellis Reference Eaton and Ellis2014), with the other area in the England (Cumbria, Lake District) where this lichen is now rare and declining.
Materials and Methods
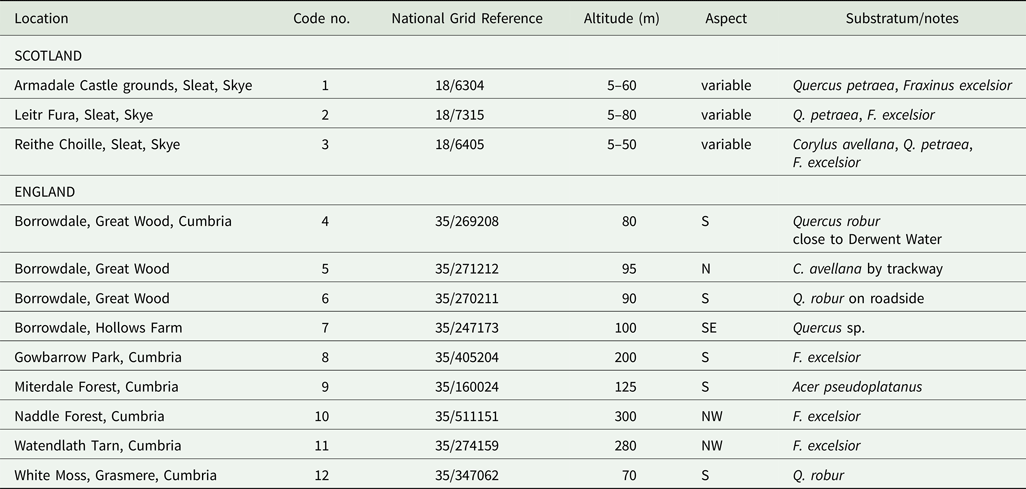
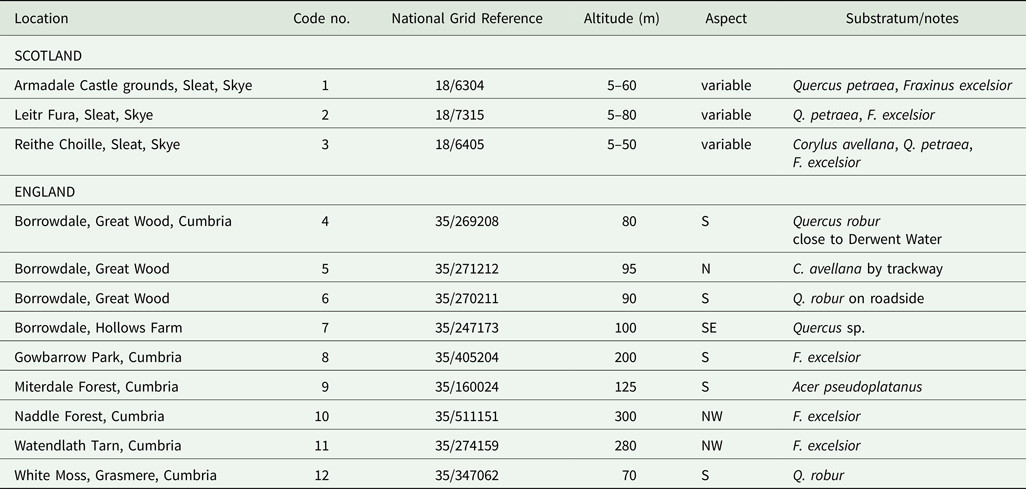
Small samples of L. pulmonaria were collected from the Isle of Skye, Scotland and the Lake District in Cumbria, England. Details are provided in Table 1. A large collection of thallus fragments was made from Skye since the lichen was abundant throughout the Atlantic woodlands on this island. Collecting was carried out widely within the confines of the wooded areas to provide a representative sample. This procedure could not be used in Cumbria as the lichen is rare and restricted to a few small areas of old woodland. Sampling here had to be made carefully using either recently detached thalli that had fallen to the base of the tree or on thalli which remained attached to the tree, but were evidently soon to be lost. Sampling was on a smaller scale, with the exception of site 7 (Hollows Farm) where a tree hosting abundant Lobaria had recently fallen. Sampling was undertaken in 2018–2019.
Site information for samples of Lobaria pulmonaria from Cumbria (England) and Skye (Scotland).
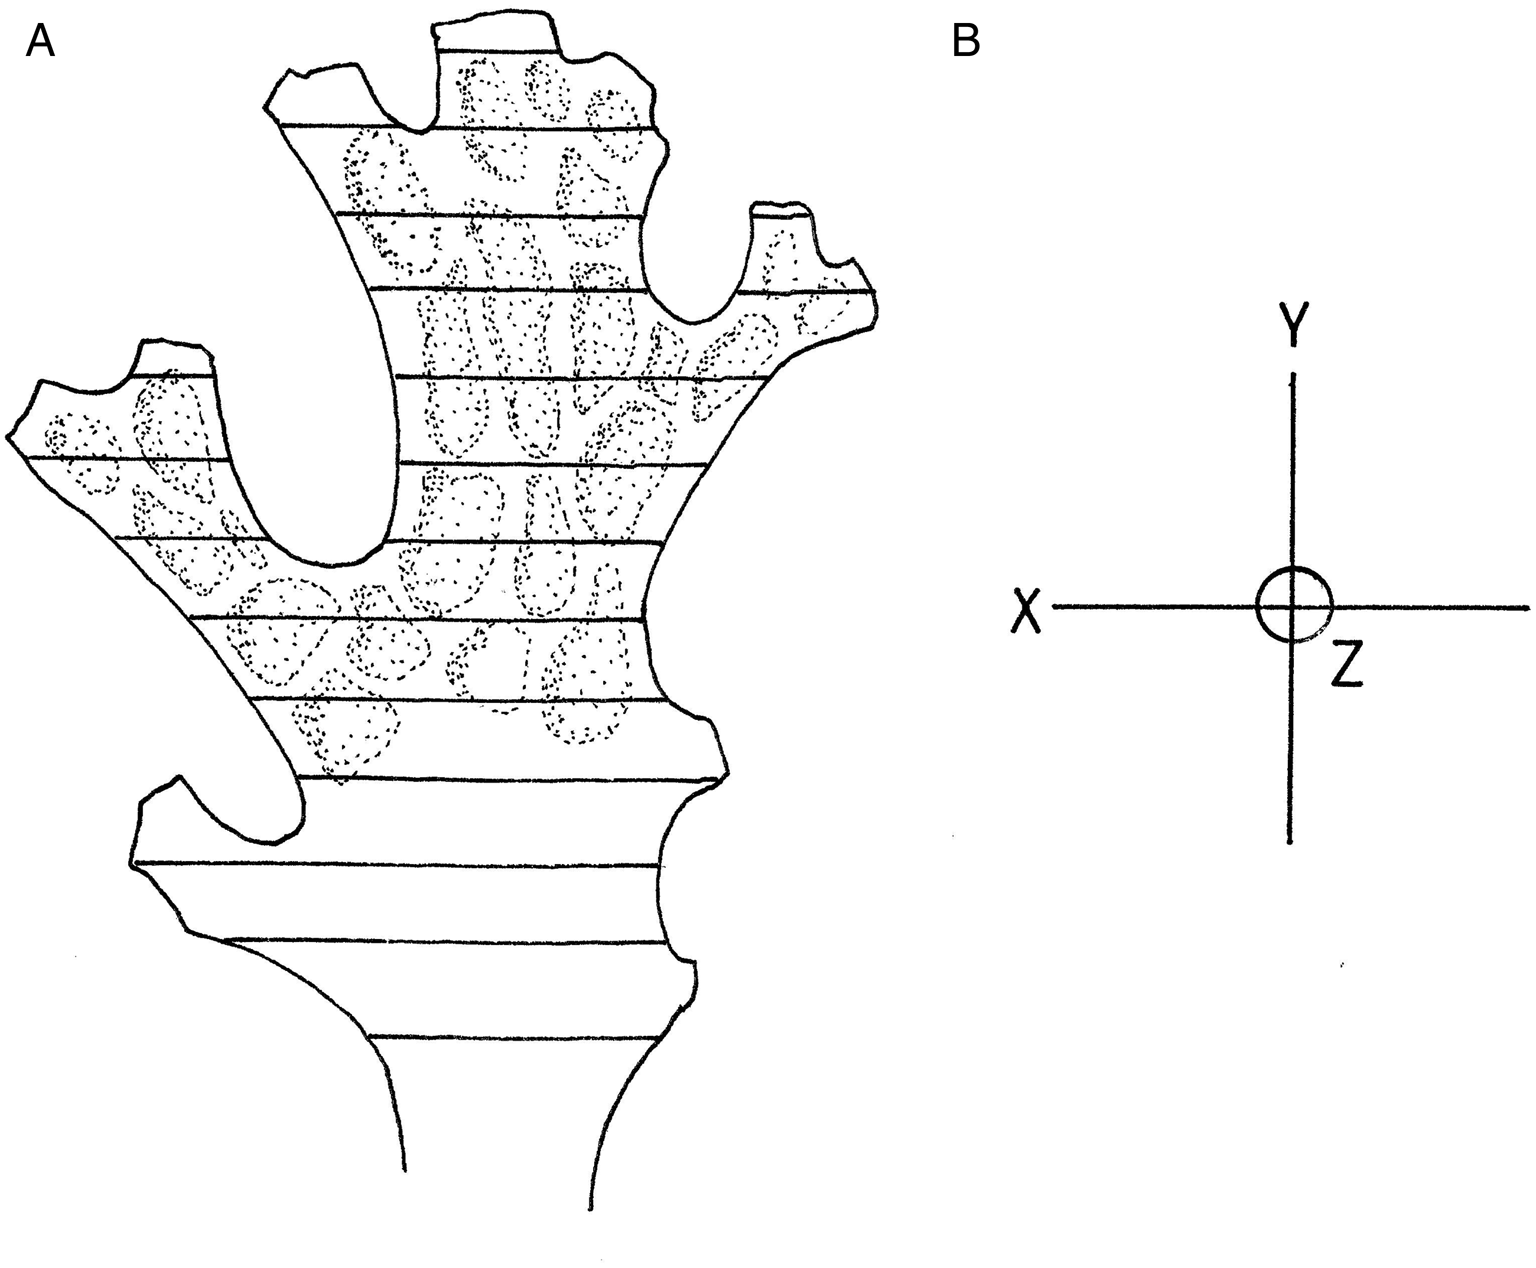
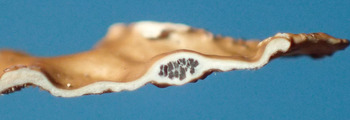
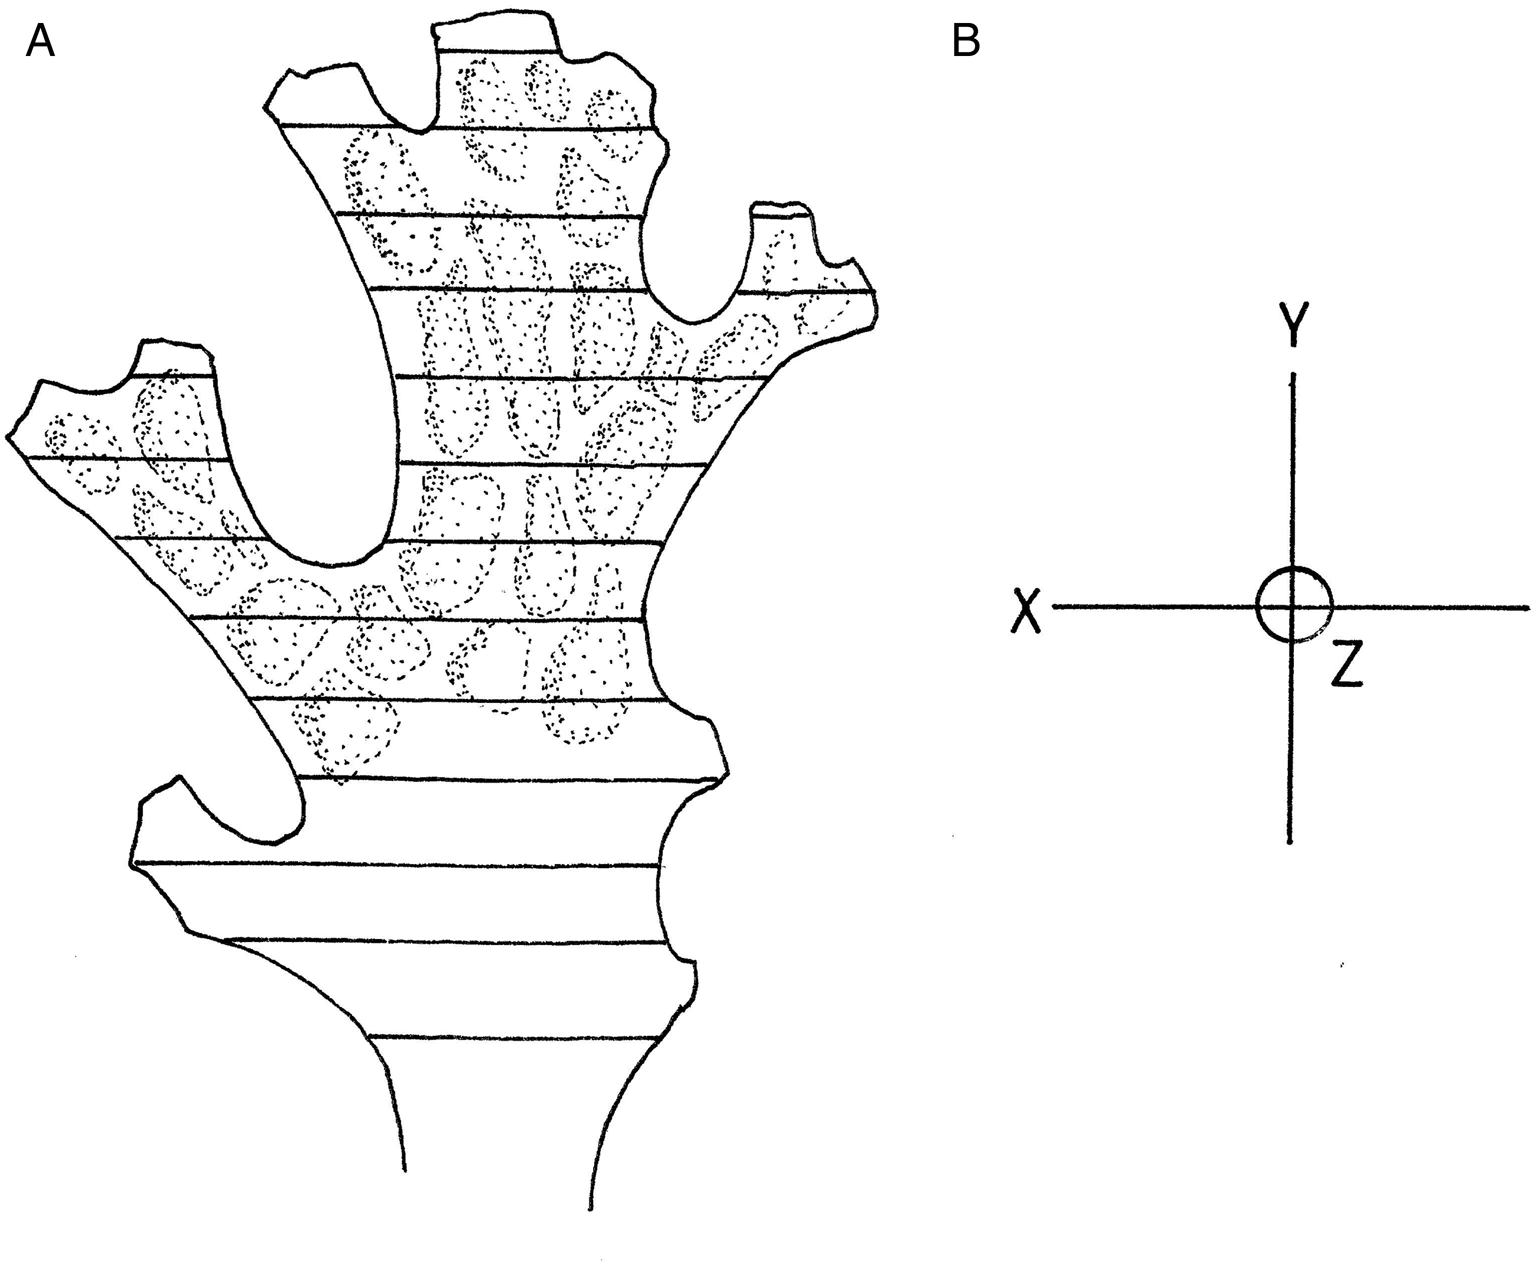
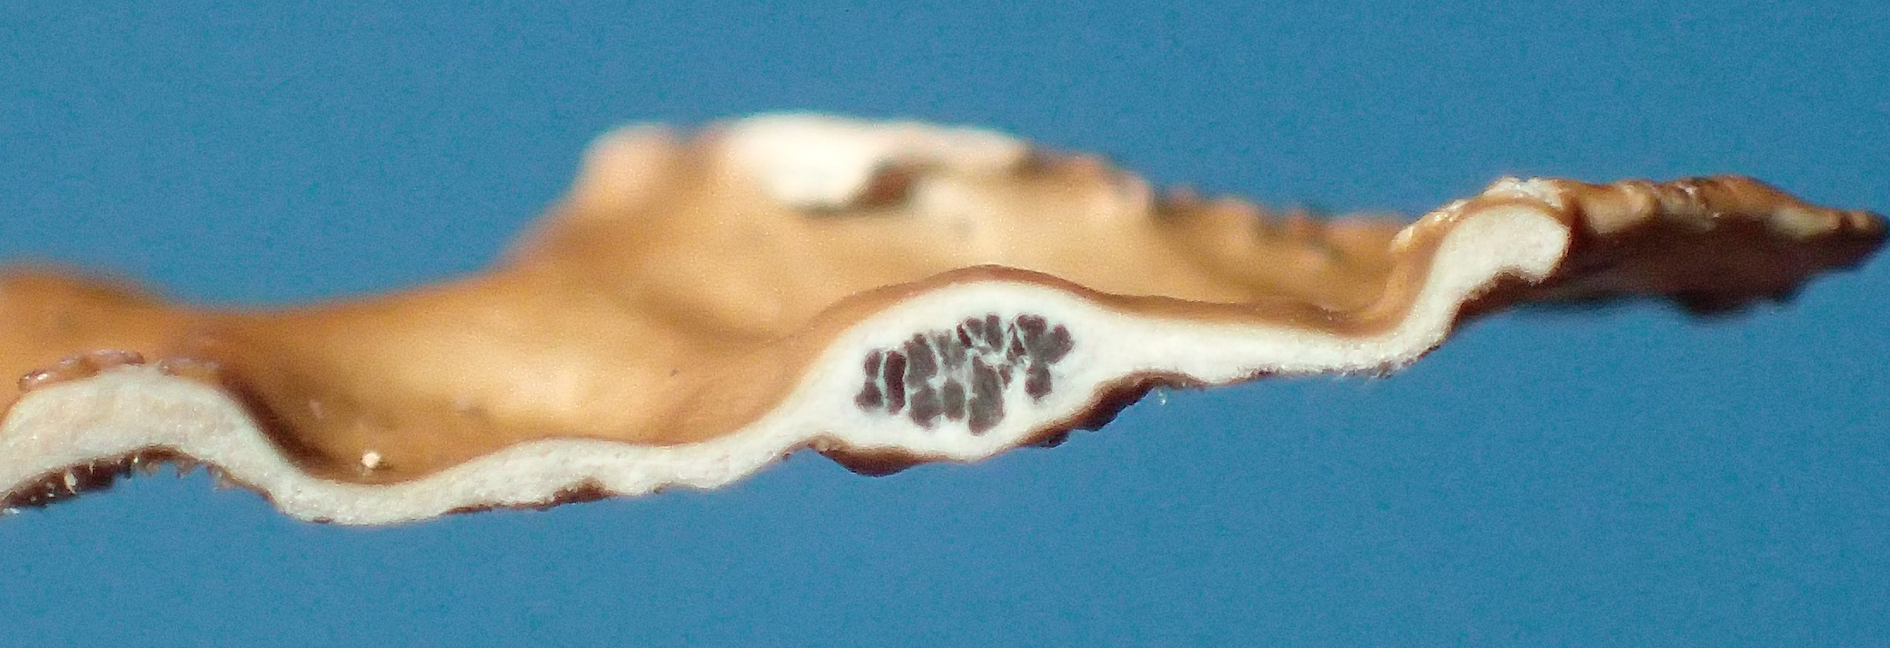
After collection, thalli were placed in labelled envelopes and allowed to air-dry. Several methods were tried to quantify cephalodia in the thalli. Although it was sometimes possible to detect them as orange-brown pustules on the undersides, it was soon realized that the smaller cephalodia were easily missed. The most reliable method was to slice the thalli at regular intervals using a razor blade (Fig. 1). In this way, cephalodia were easily detected by examination of the sections with a dissection microscope at ×12 magnification (Fig. 2). As cephalodia become larger as the thallus ages (Cornejo & Scheidegger Reference Cornejo and Scheidegger2013), a series of parallel slices 2.5 mm apart were made, beginning at the apex of a lobe then working backwards to a distance of c. 5 cm. This provided a count of cephalodia per unit length of slice. The length of each slice was measured under the microscope with a plastic rule. Since the diameters of cephalodia ranged from c. 0.1–1.5 mm, sequential slices would not count any cephalodium twice. On the other hand, many cephalodia would be missed, but with knowledge of their dimensions this could be accounted for. For this exercise, cephalodia were assumed to be positioned randomly since the areas of the samples varied from c. 8–20 cm2. This could not be avoided owing to the complexity of the thallus outline and the initial size of the individual thalli, although those that were obviously immature or senescent were avoided. The above method allowed cephalodia to be counted and normalized to numbers of cephalodia per 100 mm length of slice.
Method of slicing Lobaria thalli to enumerate and measure the volume of cephalodia. A, lines along which slices were made at 2.5 mm apart. B, axes showing lines along which cephalodium dimensions were obtained. For the three-dimensional form of the cephalodia, maximum dimensions were determined in three directions along mutually perpendicular axes, namely along the line of the slice where the axis parallel to the slice (x) and the vertical axis (z) could be measured, then along an axis at right angles to these (y), defined as the ‘length’ of the cephalodium. See ‘Materials and Methods’ for further information on cephalodium volume estimation.
A slice through a Lobaria pulmonaria thallus showing a cephalodium (1 mm wide). In colour online.
Size of cephalodia was determined using vertical and horizontal sections of air-dried thalli. As the three-dimensional form of cephalodia was unknown, maximum dimensions were determined in three directions along mutually perpendicular axes, namely along the line of the slice where the axis parallel to the slice (x) and the vertical axis (z) could be measured, then along an axis at right angles to these (y), defined as the ‘length’ of the cephalodium (Fig. 1). The latter was estimated by taking thin slices c. 0.5 mm apart and observing where the cephalodium first became visible. Slicing then continued until the cephalodium was lost so that its total length could be estimated. Measurements were conducted under a dissection microscope at ×25 magnification using fine forceps to manipulate the slices. Cephalodia volumes were estimated on the assumption of an ellipsoidal shape where the major axes corresponded to the maximum dimensions in the three directions. Measurements were made of 30 cephalodia each from the Skye and Cumbria thalli. Measurements were also made of the thickness of the upper cortex, algal layer, medulla, lower cortex excluding tomentum and thickness of the cortex above the cephalodia. Dry weight per unit area for 10 thalli each from Skye and Cumbria was determined at room temperature at a relative humidity of 60% using known areas of thallus. Areas of 1 cm2 that had been previously moistened and gently flattened were cut out then air-dried and weighed.
Data on atmospheric combined nitrogen levels were provided by Dr R. Smith of the Centre of Ecology and Hydrology (CEH), Edinburgh for the period 2012–2014. These were modelled levels at a 5 × 5 km resolution and provided estimates of wet deposition (NO3), dry deposition (NO2/NO3/HNO3), wet deposition (NH4) and dry deposition (NH3/NH4) in kg ha−1 yr−1. Statistical analyses were undertaken using Minitab 12 (www.minitab.com).
Results
Table 2 provides a summary of cephalodia dimensions, and their estimated air-dry volume. An analysis of variance demonstrated a significant difference between the Cumbria and Skye cephalodium volumes (F = 4.46, P = 0.035) so estimates of relative biomass were determined separately. In both the Cumbria and Skye thalli the cephalodia were seen to be slightly longer than wide and were also ‘flattened’, being about half as deep as they were long or wide. An explanation for these differences cannot be given.
Mean dimensions and volumes of cephalodia sampled from air-dried thalli of Lobaria pulmonaria. Axes (X, Y, Z) refer to those illustrated in Fig. 1. Thirty cephalodia were sampled from each area. Standard deviations are given in parentheses.

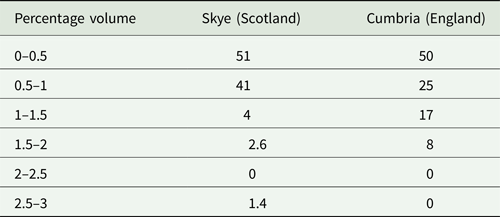
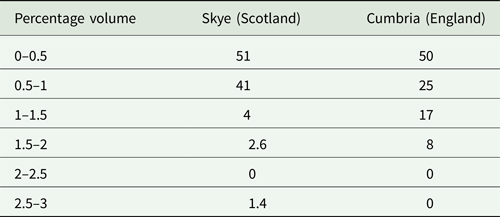
Assuming cephalodia are randomly distributed, the probability of ‘hitting’ a cephalodium is proportional to the distance between the slices and the mean cephalodium length (Fig. 1). This allows an estimate of cephalodia per unit area of thallus to be made (Table 3). The estimated average number of cephalodia per cm2 of thallus ranged from 4.19–6.37 and an analysis of variance indicated no significant difference in numbers between the sites (ANOVA: F = 1.68, P = 0.18). Knowledge of the volume of unit area of thallus was obtained from the mean thallus thickness which enabled the proportion of thallus consisting of cephalodia to be estimated. This proportion as a percentage of the total thallus volume is given in Table 3. The proportional volume of cephalodia ranged from 0.41–0.71%. In this case an ANOVA was inappropriate but a non-parametric Kruskal-Wallis test demonstrated no significant difference between the Skye and Cumbria samples (H = 5.82, P = 0.12). However, the three Skye sites did differ from each other and those of Reithe Choille occupied a significantly smaller volume (H = 6.26, P = 0.04). The results are summarized as percentage frequency of sampled thalli for Skye and Cumbria in Table 4. The volumes which can be equated approximately to biomass are strongly skewed with a mode between 0–2% and a single thallus from Skye showing a maximum of 2.5–3% volume. There was no significant correlation between the various sources of nitrogen deposition predicted by the CEH model and the abundance of cephalodia in the thalli.
Statistical data relating to cephalodium density and proportional volume in Lobaria pulmonaria thalli.

Relative volumes of cephalodia in Lobaria pulmonaria thalli expressed as percentage frequency of sampled thalli. Data are based on 75 estimates for Skye and 12 estimates for Cumbria.
Discussion
These are the first quantitative estimates of cephalodium biomass in Lobaria and demonstrate that in L. pulmonaria they usually make up less than 2% of the total biomass. The cyanobacterium involved is one of several strains of Nostoc that have been isolated (Myllys et al. Reference Myllys, Stenroos, Thell and Kuusinen2007), although the cells were rarely found in chains and were not invested in copious mucilage as is the case in free-living cells.
It was hypothesized that cephalodium abundance would be negatively correlated with total nitrogen deposition. The average total oxidized nitrogen estimate for the Cumbria sites was 10.9 kg ha−1 yr−1 compared with just 2.6 for the Skye sites. Total reduced nitrogen deposition (NH3, NH4) was 22.6 kg ha−1 yr−1 for Cumbria and 3.4 for Skye. These large differences appear to have had no significant effect on cephalodium biomass within the lichen so the above hypothesis probably needs to be rejected. However, there is one caveat: these estimates are made over areas of 5 × 5 km and it is possible that local variations occur within these areas where N deposition at some of the Cumbria Lobaria locations is lower owing to topographic effects and the patchiness of local farming activities. For example, in Borrowdale where Lobaria is uncommon but widespread, precipitation is high, reaching 3000 mm a−1. The prevailing westerly winds pass over 20 km of mountainous terrain where precipitation could remove much of the atmospheric fixed nitrogen originating in the coastal fringe and further afield. Agricultural activity within the valley itself is also low. Until more refined models of nitrogen deposition become available, direct measurements of nitrogen deposition at some of the Lobaria locations would obviously help to clarify the situation.
Cyanobacterial nitrogen fixation in Lobaria pulmonaria is probably capable of making a significant contribution towards the nitrogen requirement of the lichen. Muir et al. (Reference Muir, Shirazi and Patrie1997) showed that maximum growth of this species occurs when the lichen is fully saturated with water, while nitrogenase activity in the cephalodia responds positively to temperature and thallus moisture content in the related L. oregana (Tuck.) Müll. Arg. (Antoine Reference Antoine2007). In this North American species, estimates of nitrogen fixation have demonstrated that the lichen contributes 50% or more of the forest nitrogen input (Antoine Reference Antoine2007), highlighting the ecological importance of these macrolichens. Thin sections of cephalodia show that the actual volume occupied by the cyanobacteria may be less than 50% of the total cephalodium volume (see Cornejo & Scheidegger Reference Cornejo and Scheidegger2013, fig. 3D). Considering the small volume occupied by the cyanobacteria, their nitrogenase activity must be exceptionally high.
Acknowledgements
Peter Crittenden and Ron Smith are thanked for their assistance with the modelled nitrogen deposition data. David Richardson provided helpful suggestions and a copy of his D. Phil thesis. Simon Webb of Natural England, Kendal is thanked for giving permission for the collection of small Lobaria samples and with the selection of suitable sites.
Author ORCID
Allan Pentecost, 0000-0003-3102-0402.