Introduction
Lagerstätten are sedimentary fossil deposits that display in addition to mineralized skeletons an exceptional degree of preservation of soft integuments, digestive systems (Butterfield, Reference Butterfield2003; Zhang and Briggs, 2007; O′Brien and Caron, Reference O′Brien and Caron2012; Vannier, Reference Vannier2012), nervous systems (Ma et al., Reference Ma, Hou, Edgecombe and Strausfeld2012), reproductive systems (Siveter et al., Reference Siveter, Siveter, Sutton and Briggs2007), and in some cases even the details of cellular structure (Huldtgren et al., Reference Huldtgren, Cunningham, Yin, Stampanoni, Marone, Donoghue and Bengtson2011). In this paper, we discuss the question of why decay of dead carcasses stops or is delayed and thereby allows fossilization to start before complete degradation of the body. Normal decay of non-mineralized tissues usually proceeds within days or a few months. Accordingly, the process decay in Lagerstätten must be different from classical organic-tissue degradation.
Lagerstätten are formed in bottom sediments in marine, fresh or brackish water. This attributes the first stages of decay and fossilization to the complex water-sediment-degrading tissues interplay. Thus, the explanation of the decay slowdown should be found in the details of this three-way interaction. It is commonly thought that the predisposed conditions for exceptional fossil formation are anoxic environment and lack or low activity of bioturbators and scavengers (e.g., Lin et al., Reference Lin, Zhao, Rahman, Xiao and Wang2010); the former delays the decay to some extent (Allison, Reference Allison1988), and the latter keeps the system more or less undisturbed (Allison and Briggs, Reference Allison and Briggs1993). Historically, discussion on the topic was focused on the interaction between organic tissues and water loaded with different salts: phosphate permineralization, silica permineralization (for review see Butterfield, Reference Butterfield2003), and iron-chelating properties (Petrovich, Reference Petrovich2001). However, for many Lagerstätten (e.g., Burgess Shale-type, Herefordshire, Soom Shale, Sinsk biota, Green River Formation) no specific water chemistry has been found to explain the phenomenon.
Aluminosilicates have been suggested to inhibit decay by producing permineralizing clay gels (Towe, Reference Towe1996), clay-molds on carcasses (Orr et al., Reference Orr, Briggs and Kearns1998, Martin et al., Reference Martin, Briggs and Parkes2004), or by adsorbing lytic enzymes (Butterfield, Reference Butterfield1990, Reference Butterfield1995). These possibilities have yet to be investigated extensively, even though they may be an important part of water-sediment-organic matter interactions.
An experimental approach is a well-recognized strategy that enables the decay inhibition and initial steps of fossilization to be traced (Sagemann et al., Reference Sagemann, Bale, Briggs and Parkes1999; Briggs, Reference Briggs1995, Reference Briggs2003; Sansom et al., Reference Sansom, Gabbott and Purnell2010, Reference Sansom, Gabbott and Purnell2013). Despite clear evidence that the fossilization took place inside the sediment, relatively few experiments on fossilization in sediments have been performed (Wilson and Butterfield, Reference Wilson and Butterfield2014; Gabbott et al., Reference Gabbott, Beecroft, Murdock and Purnell2014; Murdock et al., Reference Murdock, Gabbott and Purnell2014). Wilson and Butterfield (Reference Wilson and Butterfield2014) reported the influence of different sediments on the rate of degradation of macroscopic remains. These experiments showed better preservation of soft-body remains in kaolinite in comparison with montmorillonite, quartz, calcite, and remains incubated in marine water controls. They concluded that the role of sediment type has been greatly underestimated and introduced a twist to the new preservative process.
Our goal was to investigate the pattern of decay and preservation of soft tissues in clay sediment in comparison with those incubated in liquids. In our experiments, nauplii of the brine shrimp Artemia salina (Crustacea, Branchiopoda) were buried in non-sterile kaolinite sediment in fresh water. Experimental tubes were kept at room temperature in the dark for more than two years. This experimental design differs from previously reported ones (Wilson and Butterfield, Reference Wilson and Butterfield2014). Firstly, we buried the arthropods in a suspension of clay under a water column instead of wetted sediment with a limited quantity of water above the sediment. Our system imitated a soft, fine-grained, near-surface sediment layer with a gradation of density, grain size, oxygen content, flocculation degree, and other parameters. Such conditions are normally formed within near-surface sediment in which degradation of soft bodies in some Lagerstätten presumably occurred (Dzik et al., Reference Dzik, Zhu and Zhoa1997; Petrovich, Reference Petrovich2001; Gabbott et al., Reference Gabbott, Zalasiewicz and Collins2008; Webster et al., Reference Webster, Gaines and Hughes2008; Lin et al., Reference Lin, Zhao, Rahman, Xiao and Wang2010; Gaines et al., 2005, 2012; Forchielli et al., Reference Forchielli, Steiner, Kasbohm, Hu and Keupp2014). The water column above the sediment increases the pressure and shapes the conditions inside the sediment to be more similar to the conditions in natural bottom sediments in comparison with merely wetted muddy patches. Secondly, our experiments modeled a naturally rapid, catastrophic deposition, which is thought to be important in the formation of many Lagerstätten (Zhu et al., Reference Zhu, Zhang and Li2001; Grogan and Lund, Reference Grogan and Lund2002; Ivantsov et al., Reference Ivantsov, Zhuravlev, Krassilov, Leguta, Melnikova, Urbanek, Ushatinskaya and Malakhovskaya2005; Gabbott et al., Reference Gabbott, Zalasiewicz and Collins2008; Gaines et al., Reference Gaines, Hammarlund, Hou, Qi, Gabbott, Zhao and Peng2012; O′Brien and Caron, Reference O′Brien and Caron2012). Thirdly, the experiment continued for two years instead of several weeks or months, thus allowing it to register the first steps of fossilization. To simplify the interpretation we used fresh water instead of saline.
Even under these simple conditions, unexpected and complex patterns of decay occurred that showed the important role of sediments (e.g., kaolinite) in the process of soft-bodied fossil formation.
Materials and methods
Artemia salina, a common saltwater inhabitant, was used as a model organism for the burying experiments. It is pink or red-orange in color, which makes it clearly visible in white/gray kaolinite sediment. Artemia nauplii were grown from eggs in salt water at 26–28°C over the course of 30–36 hours in accordance with the standard protocol of obtaining live nauplii (molting stage LI-LII). Live nauplii were washed and left in fresh water for 4–10 hours at 4–6°C to euthanize them. In some experiments, we used a mixture of eggs and dead nauplii. Live and dead nauplii were also used in the experiments separately. About 20 mg wet weight/100 mL (50–60 nauplii per 1 mg) was placed in each standard tube.
We used kaolinite (Al4[Si4O10](OH)8) from the Polog Deposit, Ukraine. Raw clay samples were washed and elutriated according to standard procedure for clays (Tables 1, 3).
Elemental composition of kaolinite samples. Samples from the dark layer (DL) of the sediment were taken and analyzed after 1.5 months for the fresh water experimental system and after a 6-month period for the system with added calcium chloride. OM=total organic matter.

To prepare the suspension, purified kaolinite with a concentration of 30g/L was stirred in settled tap water. The water for the suspension had been left to stay in an open steel or glass vessel for at least 7 days before the experiment to gain a diverse microbial population.
Experimental protocol
A suspension of kaolinite was poured in tall glass tubes (50–70 cm height, 1–1.5 cm diameter; bottom of tubes sealed with a paraffin stopper). Immediately, a portion of nauplii was placed on the surface of the suspension. The tubes were then closed with cotton plugs and kept at room temperature under black cover without moving until analytical procedures were performed. After six months, the tubes were sealed with paraffin in order to prevent further evaporation and were stored for several months before opening for analytical analysis. Four series of experiments each consisting of five to ten tubes were carried out. The control tube, containing kaolinite without Artemia, was analyzed after 1.5 months. We examined the sediment and the nauplii after 1.5, 3, 6, 12, and 14 months when nauplii were extracted from the sediment and washed in fresh water several times.
After four months at rest, CaCl2 was added to one tube. Dry CaCl2 was dissolved in the supernatant, which had been carefully decanted in order not to disturb the sediment, to achieve an overall concentration near 1 g/L. After complete dissolution of CaCl2 this portion was returned to the tube. This tube was tested after two months (i.e., six months total). The chemical composition of the sediment from this tube is described in Table 1.
We tested the stability of clay-organic subfossils under elevated temperature and pressure by putting the entire experimental sediment, which had been kept for 14 months, in a thermostatic cell for two weeks. The air above the sediment in thermostatic containers was substituted with argon to prevent oxidation. The thermostatic cell was kept under a pressure of 4 atm and a temperature of 150°C over the given period; slow circulation of fluid took place inside the thermostatic container.
Measurements of the pH of the sediment and supernatant
In three out of four series of experiments the pH was measured in aliquots taken from the supernatant solution (SS), from the topmost layer of the sediment (1–2 mm) (TL), and from the deeper dark-gray portion of the sediment (DL). In two series of experiments, the unconsolidated sediment was frozen; then the frozen sample was removed from the tube and cut into slices that were put into individual containers for subsequent pH measurements and other analyses. In the third series of experiments, the samples were collected without freezing, layer by layer. The controls without Artemia were measured in the same way. All the pH measurements were performed 2–7 days after sample collection, during which time the samples were stored at 5–8°C. The pH measurements were carried out according to standard techniques (Schofield and Taylor, Reference Schofield and Taylor1954; Ragland and Coleman, Reference Ragland and Coleman1960; Yuan, Reference Yuan1963; Peverill et al., Reference Peverill, Sparrow and Reuter1999). Two-ml portions of the sediment were stirred using a vortex-type stirrer without preliminary filtration until the formation of a uniform suspension; then the pH was measured using a single-electrode pH-meter that had been calibrated with a standard buffered solution.
Chemical analysis of the samples
Elemental composition of the sediment samples was determined by X-ray fluorescence analysis using a vacuum spectrometer of sequential action with wavelength dispersion (Axios mAX Advanced model, PAN-alytical, Netherlands). The spectrometer was equipped with an X-ray tube with a 4 kW Rh–anode. The maximum tube voltage was 60 kV and the maximum anode current was 125 mA.
The presence of aluminum hydroxide or oxide as well as sulfides, sulfates, and sulfites in suspensions was determined according to the routine procedures (Shoemaker et al., Reference Shoemaker, Mclean and Pratt1961; Yuan, Reference Yuan1963; Tikhonov, Reference Tikhonov1971; Midgley and Torrens, Reference Midgley and Torrens1978; Thomas, Reference Thomas1982). Liquid fractions of 2 mL were measured without preliminary filtration. The portions of the sediment of standard weight were diluted with 2 mL of distilled water and then stirred until the formation of a uniform suspension. Qualitative determination of sulfur compounds was carried out according to the conventional procedure using hydrochloric acid. The presence of aluminum was determined using hydrochloric acid and potassium hydroxide.
Mineralogical analysis
Differential Scanning Calorimetry (DSC) was used for the analysis of the mineral composition of the probes. Thermogravimetry and DSC curves were recorded simultaneously on synchronous thermal analysis equipment (NETZSCH STA 449 F3 Jupiter®) at a heating rate of 10°C/min in room atmosphere. DSC analysis operates with the following characteristics: the main endothermic effect of kaolinites (527.5–547.1°C) is associated with dehydration, i.e., with a loss of OH− ions present in the lattice of the mineral; the structure of the mineral is destroyed upon exothermal reaction (978.5–990.1°C); and the higher the temperature of the exothermic maximum, the more ordered is the structure of kaolinite. The ratio of the segments (a, b) of the base line from the height line to its intersection with the left and right shoulders of the peak characterize its shape (asymmetry index ƒ=a/b). Increase of f indicates loss of the degree of perfection of the kaolinite structure (Lombardi et al., Reference Lombardi, Russe and Keller1987).
SEM imaging and elemental analysis
Nauplial remains were extracted and washed in fresh water then imaged under SEM at 15 kV of penetrating beam voltage.
EDS/SEM spot analyses and elemental mapping were carried out with the voltage of the penetrating beam at 15 and 5 kV in order to assess the difference between the surface (0–280 nm) and the subsurface layers (0–1.5 µm) (Orr et al., Reference Orr, Kearns and Briggs2009).
Аnalysis of external cuticle of nauplii by chitin staining
We used chitin staining to evaluate chitin decomposition in the buried nauplii, using Calcofluor Evans Blue in 10% KOH following standard procedure. Samples were investigated under the Olympus Fluorescent Microscope in UV with a 520 nm (green) light filter at the same time of exposure (5 ms). Calcofluor testing is widely used to detect different types of chitin, including those in fossil samples (Ehrlich et al., Reference Ehrlich, Rigby, Botting, Tsurkan, Werner, Schwille, Petrasek, Pisera, Simon, Sivkov, Vyalikh, Molodtsov, Kurek, Kammer, Hunoldt, Born, Stawski, Steinhof and Geisler-Wierwille2013). We stained the freshly killed nauplii of ages L1 and L2 (which showed slightly different degrees of staining) and compared them with the nauplii after 14 months of burial.
Results
Decay pattern in the sediment
The buried nauplii settled down with sedimentation of clay particles; the latter showed the size gradation, which in some tubes was visible as variously opaque layers (not shown).
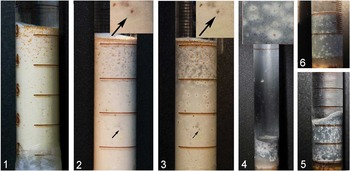
Our experimental system exhibited over four series of the same experiment a reproducible patchy pattern of decay within the sediment (Fig. 1.1–1.5). Both live and dead carcasses showed the same patchy pattern of decay, although those that were buried alive were concentrated in the top layer (Fig. 1.1–1.3).
Dynamic portrait of the nauplii Artemia salina (the orange dots) decaying in kaolinite suspension (the white-gray matrix). (1) At 24 hours the darkened spot harbors the separated nauplius (arrow) on the background of the white clay; (2) at 14 days; (3) at one month the patches embracing the animals (shown by arrows) become colorless on the background of the darkened kaolinite (4) at three months the darkness of the sediment progressively increases and an ashy-gray film sets down on the tube wall; (4 inset ) enlarged area with the patches (after six months); (5) at six months the thin white trickles propagate upward; and (6) at 14 months the white trickles mostly disappear and the remaining white patches stabilize.

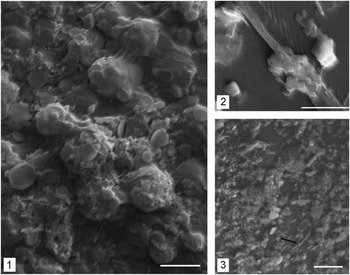
SEM images of new minerals formed within the clay sediment in the course of the decomposition of nauplii (six months). (1) The nauplial body; (2) the antennal setae with tightly attached multiple allophane platelets; and (3) halloysite rods (see arrows) in the sediment. Scale bars =5 μm.

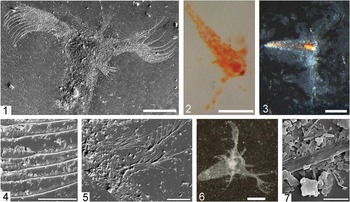
Nauplii after 14 months of the experiment. (1) The unchanged morphology of a nauplius with appendages shown by SEM; (2) optic microphotograph, direct light, and clearly visible nauplial eye-spot; (3) the gut preserving its volume and color (transmission light); (4) filter apparatus of antennae preserving all the setae; (5) mandible with the preserved setae; (6, 7) the nauplii subfossilized in the thermostatic cell; (6) optic microphotograph, direct light; and (7) SEM image of antennal setae on the mineral crystals. Scale bars=200 μm for 1, 2, 4, 6; 20 μm for 4, 5; 2 μm for 7.

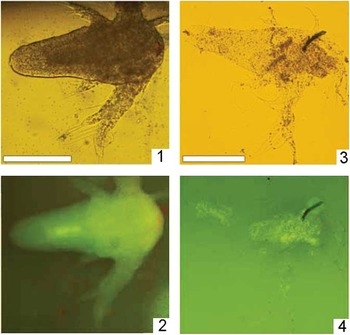
Chitin staining probes (1, 2) of freshly killed nauplii. (2) The specimen under UV in the 510 nm light filter; (3, 4) the animal after 14 months in kaolinite; and (4) under UV.

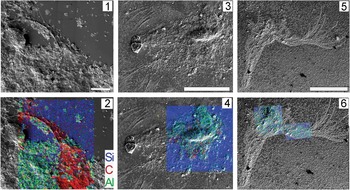
SEM images and corresponding elemental mappings of the nauplial remains after 9–14 months of decay; clay matrix is indicated by the presence of Al; Si is present both in the clay and in the glass support; accelerated voltage 5 kEv. (1) The mandible after nine months of decaying; (2) elemental mapping of the specimen, carbonaceous content remained high; (3) the remains after 14 months of decaying; (4) after 14 months of decaying, the carbonaceous content decreased significantly and the carbonaceous film became less clear; (5) the remains after 14 months of the experiment and further thermal-pressure incubation; (6) elemental mapping of remains after 14 months revealed very low carbon. Scale bars, for A 10 μm, for B, C 200 μm.

The amount of organic remains was found to influence the general pattern of decay within the sediment. When the smaller amount of nauplii (10 mg/100 mL) was used, the patchy pattern became less pronounced but remained essentially the same, whereas when the amount of nauplii was reduced further (less than 10 mg/100 mL), the system did not exhibit the patchy pattern. This means that a large amount of organic remains would have to be put into the suspension to repeat the results.
In the first few days, the layer with the buried nauplii started to darken (Figs. 1.1, 2). The dark coloring propagated from the animals into the kaolinite matrix (Fig. 1.2). This darkening progressively increased, whereas the spots surrounding each nauplius underwent gradual discoloration (Fig. 1.3). For the first three months, the intense darkening diffused throughout the kaolinite sediment. Under high magnification, the dark-colored inclusions were visible in a gray matrix. A dark-gray film was deposited on the walls of the tubes (Fig. 1.4).
Where the concentration of the nauplii was high, the white spots around the animals merged together to form a light layer (Fig. 1.4). The contrast between the sediment and the spots around the animals sharpened with time (Fig. 1.4). The morphology of these spots also changed, depending on their position within the sediment. In the upper half of the sediment, the spots with enclosed nauplii developed upward-propagating white trickles, whereas within the deeper layer the white spots remained visibly intact (Fig. 1.5).
Over the next eight months, this picture changed slowly (Fig. 1.5). In some tubes, the dark coating disappeared from the tube walls and the “bleached” surface layer gradually increased in thickness. The white-colored surface was 1–2 mm thick and represented a loose amorphous substance. After 14 months, numerous spots stayed intact and their morphology was unchanged for up to two years.
Chemical changes within the sediment
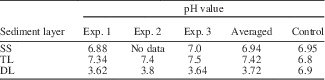
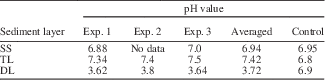
The qualitative chemical analysis indicated that the composition and pH of the sediment depended on the depth of the sediment layer and, presumably, of the concentration of the nauplii (Table 2). The acidity of colloidal solution changed most remarkably in the zone with bleached spots containing the nauplii (DL layer): the pH decreased to 3.72 against 6.8 in the control kaolinite suspension without nauplii. In the top layer of sediment, the pH increased (7.4 against 6.9 in the controls).
рН of the kaolinite suspension and supernatant samples from three series of the experiments. Samples were taken after 1.5 months (Exp. 1) and three months (Exp. 2, 3, Control) from the start. SS=supernatant solution, TL=the very top layer (1–2 mm), DL=dark-gray layer from the middle part with multiple nauplii.
Qualitative tests revealed that the thin white amorphous surface layer was significantly enriched with soluble aluminum compounds. The dark portion of the sediment with the nauplii exhibited the presence of aluminum compounds and metal sulfides, whereas the clay from the discolored upper zone was almost free of sulfides.
The black sulfide film formed on the tube walls confirms the presence of anaerobic conditions not only within the dark layer but also above the sediment. The disappearance of this sulfide film after 10–16 months and simultaneous bleaching of the surface layer indicate the re-oxygenation of the liquid phase and the upper sediment layers.
Mineralogical changes in the sediment
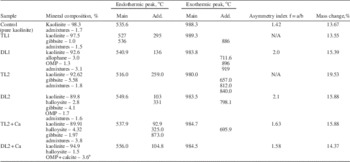
Transformations in the morphological properties of kaolinite detected by DSC (Table 3, Supplemental Data 1) were indicated by a shift in the temperature of thermal effect accompanied by corresponding changes of shape and intensity of thermal peaks, as well as by the asymmetry indices. The main endothermic peak splits into two distinct maxima at 527°C and 536°C on the thermal curve of the white top layer sample, which indicates the formation of a new phase of kaolinite. A small endothermic peak around 300°C is most likely associated with the formation of gibbsite. These new phases correspond to partial dissolution of kaolinite into aluminum-bearing components. The exothermic effect of a maximum at 657°C corresponds to the formation of an organo-mineral phase, those at 812°C and 840°C, to the accumulation of sulfides (Supplemental Data).
The results of the DSC of the different portions of the kaolinite sediment in different times and experiments. TL1=top layer (white) of a sediment, standard in fresh water after 1.5 months; TL2=top layer (white) of a sediment, standard in fresh water after six months; DL1=middle dark layer, standard in fresh water after 1.5 months; DL2=middle dark layer, standard in fresh water after six months; months; TL2+Ca=top layer (white) of a sediment, four months in standard conditions and two months after the addition of CaCl2 (six months in sum); and DL2+Ca=middle dark layer, four months in standard conditions and two months after the addition of CaCl2 (six months in sum). OMP=organo-mineral phase.

a DSC is not able to subdivide qualitatively these two components in the sample.
Kaolinite phase was also decreased in amount in the dark-colored layers. The clay particles in these layers were larger and more perfectly ordered (probably recrystallized) than in the control sample as is indicated by the shift of the maximum of the main endothermic peak toward higher temperatures. In the region of low temperatures, there is a peak associated with the release of the adsorbed water from allophane (133°C). The additional exothermic effect with a maximum at 711.6°C–798.1°C indicates the formation of an organo-mineral phase. Exothermic effects with two maxima at 896°C and 919°C confirm the presence of sulfides. The presence of the newly formed gibbsite is confirmed by the endothermic effect with a maximum at 331°C.
The DSC curve of the sample with Ca (Supplemental Data 1) has two peaks that are superimposed: the exothermic peak corresponding to the formation of an organo-mineral phase (695.9°C) and the endothermic peak, which confirms the presence of calcite (873°C). This superimposition creates the asymmetrical shape of the integral peak and makes it impossible to correctly determine independently of one another the amounts of these phases in kaolinite.
Thus, DSC analysis revealed the new mineral phases, which increased in amount along with the decrease of the kaolinite phase through the course of the experiment. DSC analysis also showed the formation of a new, perfectly ordered phase of kaolinite. The top layers had fewer new phases in comparison with the dark layers.
Some of the new mineral phases were detected via SEM, as shown in Figure 2. The round-shaped platelets are allophane and the rod-shaped crystals are halloysite.
In the experiment with aqueous solution of СаCl2, the upper portion of the sediment contained a certain amount of calcite. However, no detectable amount of calcite was found within the middle layers in the same tube (Table 3). This result conforms to the established neutral-to-slightly-alkaline pH found exclusively in the top layer, as calcite does not form under the acidic conditions.
Preservation of Artemia salina nauplii in the sediment
In three to four months, the animals completely dissolved on the surface of the sediment; however, the eggs were well preserved irrespective of their location in the sediment (Fig. 1.1–1.3). After 11–13 months, the orange dots of Artemia became brown and were visible for over 14 months and up to two years.
The eggs and the nauplii extracted from the sediment exhibited an extraordinary degree of preservation. They did not disintegrate upon the manipulations with the sediment and the washing and staining procedures. The entire morphology of nauplii was recognizable, including a gut (Fig. 3.2, 3.3) and a nauplial eye (Fig. 3.2), and the nauplial appendages preserved their fine structure (Figs. 2.2, 3.4, 3.5). High temperature and pressure affected neither the nauplial integrity (Figs. 3.6, 3.7, 5.3) nor their quantity.
Comparison of the buried and the fresh nauplii showed the degradation and\or transformation of chitin on the appendages and body after 14 months (Fig. 4.1–4.4).
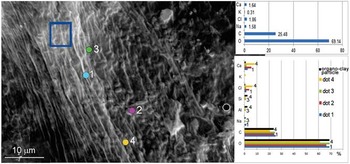
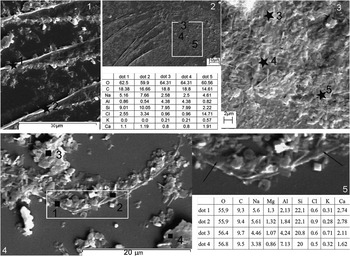
The elemental analysis of nauplial remains after three to nine months showed that they mainly consisted of organic carbon and aluminosilicates (Figs. 5.1, 6). Clay particles stayed bound to the surface of the nauplii even after several washings in water (Figs. 2.2, 5). Other elements such as Na, Cl, Ca, and Mg were distributed non-homogeneously (Fig. 6). Ca increased within the posterior part of all the nauplii tested (Fig. 6).
EDS/SEM analyses of the external layers after three months (the gut area); the samples were initially double-washed to remove loosely bounded clay particles. Square (the blue rectangle) and dot analyses (the multicolored dots) show the respective amounts of detected elements (displayed in the same colors). Scanning performed at 15 kEv. The relative amount of oxygen was calculated by a normalized stoichiometry; the amounts of elements were calculated as weight ratio.

The surface of the nauplii guided the recrystallization of dissolved kaolinite as well as the formation of crystalline and amorphous kaolinite derivatives. There were tiny round bodies associated with the nauplial remains (Fig. 2.1, 2.2). The elemental analyses of these bodies showed a Si:Al ratio of 0.65–0.97:1. This ratio was lower than those determined for the two arbitrarily chosen crystalline-looking bodies (1.21–1.18:1). Higher content of Al is recorded in the allophane derivatives, while the larger fraction of Si is characteristic for kaolinite.
In 14 months of decaying, the nauplial surface was transformed. We tested the elemental composition of the dots and/or areas that looked to be original nauplial surface, without crystalline particles, to avoid measuring the apparent kaolinite crystals. In such areas, the presence of Al (for such thin remains silica content was masked by the glass support) indicated the process of substitution or bonding of organic material by or with the organo-mineral variants (Figs. 5.4, 6, 7.2). The elemental composition of the remains did not undergo significant changes after being exposed to high pressure and temperature, though the amount of carbon decreased (Fig. 7.5).
EDS/SEM analyses of the nauplial limbs after 14 months of incubation. (1) Nauplial antennae; (2) basipodite; (3, enlarged area) and respective dot (in black) analyses (the table in the center, the dots placed respectively); (4) antennae after thermo-pressure experiment; and (5) enlarged area, black arrows show the dots and respective dot analyses in comparison with the clay particles (dots 3, 4). Glass template, scanned at 15 kEv.

Discussion
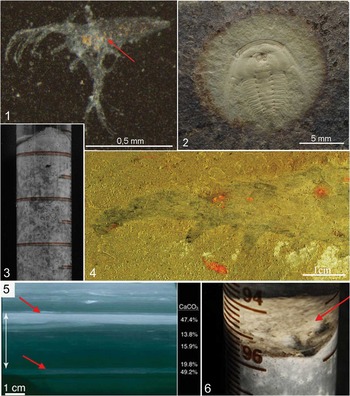
Our experiments revealed an unexpected pattern of decaying that has never been shown in previous experiments, and hitherto unseen details of decay in clay sediments. The appearance of the light spots around the nauplial bodies and the white trickles in the upper half of the sediment are indicative of highly heterogeneous conditions even within a layer a few centimeters thick. The white trickles confirm the unevenness of the physical conditions (gravity, pressure, density, particle packing) and chemical conditions (acidity, gaseous content). Such unevenness results in the sorting of organic remains by size and buoyancy, thus stopping them at different layers either suitable or unsuitable for preservation and fossilization. The formation of round white spots is evidence for the limitation of diffusion and also of the equilibrium between the inner inside the spot and the outer pressure. Real fossils confirm the action of such balancing forces in a colloidal sediment system (Fig. 9.2).
The three-dimensional pattern of different forces acted to control the decay due to the balance between animal size, sediment, amount of water, and tube size. The experimental design of Wilson and Butterfield (Reference Wilson and Butterfield2014), where carcasses were buried in muds contained in flat plastic boxes, allows for only the two-dimensional pattern to be appreciated. The scales of all components in this case did not match each other, and the heterogeneous portrait of decay in three dimensions was not displayed. Nevertheless, the unevenness of chemical conditions may be seen even in this “flat” experiment: the darkened quartzose sediment has a patchy coloration due to the light spots (Wilson and Butterfield, Reference Wilson and Butterfield2014, supplementary fig. 2).
In the experimental tubes, the low-oxygen conditions in a burying layer were formed in the first few days. The sediment and overlying water, used to maintain the low oxygen content over 6–10 months, caused the formation of dark sulfides. The slow re-oxygenation probably occurred after this period and the white layer gradually widened from the very top, but even after two years it did not exceed 0.7 cm. This means that the oxygen conditions may differ dramatically outside and inside a burying layer. In the case of the experiments carried out in plastic containers (Wilson and Butterfield, Reference Wilson and Butterfield2014), it is possible that oxygen penetrated through the walls of the containers, as some sorts of plastic are not completely impervious (Birger, Reference Birger1993), and this may have caused whitening of the darkened sediment.
The degree of preservation of soft-body remains in kaolinite appears to be extraordinarily high. Anatomical details such as intestines and setae of the exo- and endopodites, which typically disappear rapidly in ambient conditions (Gostling et al., Reference Gostling, Dong and Donoghue2009; Sansom et al., Reference Sansom, Gabbott and Purnell2010, Reference Sansom, Gabbott and Purnell2013), did not undergo significant decomposition in our experimental model. Instead, anatomical details stayed clearly visible after 14 months and even longer. Such long-lived and well-preserved remains were observed for the first time in experimental taphonomy, and the entire morphology and details of nauplial appendages bear a remarkable resemblance to those of Cambrian arthropods exhibiting exceptionally well-preserved setae and filter plates (Butterfield, Reference Butterfield1994; Harvey et al., Reference Harvey, Vélez and Butterfield2012; Vinther et al., Reference Vinther, Stein, Longrich and Harper2014).
Based on the elemental analyses, we infer that nauplial remains had slowly combined with kaolinite derivatives. These half-substituted remains were not completely fossilized but they showed some degree of fossilization and for this reason we consider them subfossils. Chitin was transformed or degraded to a large extent. For kaolinite, the same rapid degradation of chitin relative to proteins was also shown by Wilson and Butterfield (Reference Wilson and Butterfield2014).
In our colloidal system, there are at least two main factors that can slow decaying. The first is high acidity originating from the lactic fermentation of organics in a low-oxygen environment. The acidic “self-pickling” of the decaying organics is a well-known mechanism that can stop bacterial growth and thus slow decomposition. The acidic conditions established in the body-surrounding area in the colloidal sediment resemble some cases of mammalian preservation (Fisher et al., Reference Fisher, Tikhonov, Kosintsev, Rountrey, Buigues and van der Plicht2012). A localized acidic environment has been suggested previously as a preservation mechanism for the Ordovician Soom Shale Lagerstätte (Gabbott, Reference Gabbott1998).
The second agent of preservation is tanning by Al ions. In our model system, Al ions appear as a product of acidic hydrolysis of kaolinite. The organic-aluminum complexes participate in the cross-linking of protein scaffolds, which make the proteins inaccessible for bacterial decomposition. Moreover, Al complexes with organic acids are known to be the best tanning agents (Covington and Sykes, Reference Covington and Sykes1984; Covington, Reference Covington1997). The acidic environment increases the permeability of the integuments with respect to the diffusing preserving agents, mineral salts, and silicates (Mellman et al., Reference Mellman, Fuchs and Helenius1986), which promotes the mineralization of inner tissues. Therefore, decaying in kaolinite provides for self-preservation through tanning by Al ions.
Mineral and chemical tests revealed that the acidic dissociation of kaolinite was the source of Al ions in the solution. At pH 3.4-4.2 the rate of dissociation of kaolinite increases more than an order of magnitude in comparison with the neutral solution (Cama et al., Reference Cama, Metz and Ganor2002). New mineral phases (gibbsite, allophane, halloysite, and the recrystallized kaolinite) confirm the acidic dissolution of kaolinite, as all of the phases are products of kaolinite’s hydrolysis and structural rearrangement. Wilson and Butterfield (Reference Wilson and Butterfield2014) also found a lowering of the pH for the kaolinite experiment and concluded that the tanning was key to inhibiting decay.
Clay-colloid hypothesis of soft-tissue fossilization
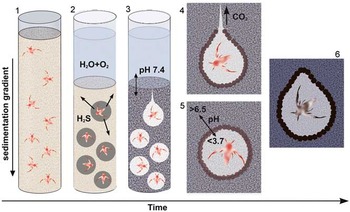
We suggest a stepwise mechanism of decay and the initial fossilization in the fresh-water colloidal clay sediment (Fig. 8). At the first step of rapid burying, the organic matter remains settled and stabilizes its position in accordance with gravity, size and weight, particle buoyancy, viscosity, and other properties of the suspension. In the course of sedimentation, the mineral particles flocculate, which defines the rate of diffusion. Gradients for density and oxygen become established (Fig. 8.1).
The schematic model of the preservation in kaolinite. (1) Sedimentation proceeds; (2) the sediment stabilizes, the concentration of oxygen within the clay begins to decrease, and the aerobic decomposition continues with insoluble sulfides forming and colorizing sediment around the macro-remains; (3) the sediment is saturated with H2S and the deficiency of О2 reaches the threshold, switching the process to anaerobic decomposition. The releasing organic acids increase the local acidity, kaolinite is hydrolyzed, the structure of the colloid collapses, and the distinct diffusion boundary around the animals may form. At the end of this step decomposition becomes very slow or stops; (4) the preserving clay “envelope” may rupture due to the imbalance of external and internal pressures, and the pH increases in the water-sediment interface; (5) the deeper spots with a sharp pH gradient remain intact, and the substitution of surface and internal tissues with the dissolved and/or amorphous clay material proceeds; and (6) the dissolved and/or amorphous kaolinite recrystallizes and calcite crystals may compose within the surface layer.

Aerobic decomposition starts the decay process but soon switches to anaerobic, at least in the vicinity of decaying carcasses. Anaerobic decomposition defines the second step (Fig. 8.2). Hydrogen sulfide begins to diffuse through the still loosely packed sediment and form the insoluble metal sulfides all through the burying layer.
At the third step (Fig. 8.3, 8.4), the following events occur: (1) Acidity around the decaying organism becomes high due to the limitation of diffusion; and (2) in the acidic environments, kaolinite actively dissolves on the organic surface template with the formation of the water-soluble aluminum salts and the complexes with lactates, citrates, oxalates, etc. (Tan, Reference Tan1980; Chin and Mills, Reference Chin and Mills1991; Drever and Vance, Reference Drever and Vance1994). The organic surface then catalyzes the reactions of mineral transformation (Kaiser and Guggenberger, Reference Kaiser and Guggenberger2000; Guggenberger and Kaiser, Reference Guggenberger and Kaiser2003); (3) The acidic hydrolysis of kaolinite favors the development of a contact interface among the mineral particles and thus increases the diffusion limitations even more. This, in turn, accelerates the pH decrease in the vicinity of the decaying body due to the influx of organic acids and hydrogen sulfide into the local environment. The acidic dissolution of metal sulfides leads to the propagating discoloration of the host matrix around the bodies, yielding the distinctive spotted morphology of the burial layer; (4) Rapid increase of the contact area between the clay particles initiates the spontaneous collapse of the ordered clay structure, which further forms more or less amorphous mineral around each buried nauplius. In the presence of sufficient concentration of metal ions, the diffusion boundary between the inner and the outer contents of the spot may become clearly visible (Fig. 8.4, 8.5). This specific local spot favors self-preserving processes and initiates the mineral-organic bonding of body integuments. This is the beginning of the fossilization process.
During this step, the gaseous products of decomposition (mostly carbon dioxide) accumulate within the decaying spot (Fig. 8.4, 8.5). In these conditions, the internal gas-induced pressure should become relatively high. If the hydrostatic pressure is low, this accumulated gas destroys the structural boundary and a “bleaching” acidic solution diffuses upward (Figs. 1.5, 8.4), giving rise to the trickle features. The spots that envelop the bodies at greater depths remain intact as higher hydrostatic pressure compensates gas-induced internal pressure and prevents the rupture of the spot boundary (Fig. 8.5). The diffusive boundary between such a spot and the host sediment could be preserved if insoluble compounds resistant to acidity are present (a sort of a process that guides formation of Liesegang rings) (Fig. 8.5, 8.6).
Unlike the deeper layers, the resulting conditions in the top layer of the sediment become slightly basic due to the formation of aluminum hydroxide. The latter occurs through the saturation of water with hydrogen sulfide, which reacts with gibbsite and other aluminum compounds yielding aluminum sulfide that rapidly converts into aluminum hydroxide. The increase of the pH in the surface layer favors the formation of the calcium carbonate minerals, which cannot form in acidic conditions.
Further fossilization of the non-biomineralized remains would most likely proceed through slow morphological maturation of the organo-mineral system. This process eventually results in the permineralization of inner tissues with diffusing aluminosilicates and the products of their dissolution (Fig. 8.6). All these processes happen in undisturbed conditions; otherwise the sediment structure would not form the diffusive envelope with its specific chemical attributes.
Both the diffusion rate and the chemical affinity of different cations and the aluminosilicate derivatives to the organic residues vary; therefore, the composition of a subfossil (and a subsequent fossil) is non-uniform. The dissolved minerals may precipitate at the surface and slowly maturate as larger and more perfectly ordered crystals (Table 3). We hypothesize that the occurrence of a perfect crystalline phase is a symptom of the gradual mineral maturation in the vicinity of a fossil or within a fossil itself.
The “clay colloid” hypothesis was suggested earlier on the basis of data from the Soom Lagerstätte (reviewed by Whittle et al., Reference Whittle, Gabbott, Aldridge and Theron2007). Different elements of this hypothesis were considered separately, without taking them as an interconnected combination, i.e., the anoxic inhibition; the formation of a sealing calcite cap on the top of a fossiliferous layer; clay particles adhering to the organic surface; and substitution of the organic surface layer by authigenic or host clays. Combined, these parts work effectively in the clay-colloid system.
Comparison between experimental sub-fossils and Lagerstätten fossils
Our experiments were conducted in freshwater. This raises the question whether our model is generally applicable to Lagerstätten formation, as Cambrian Lagerstätten are in marine deposits. However, there are examples of fresh water or brackish water Lagerstätten of other ages, e.g., Mazon Creek, Ingersoll Shale (Savrda et al., Reference Savrda, Bingham, Knight and Lewis2009), Shiobara (Allison et al., Reference Allison, Maeda, Tuzino and Maeda2008), and Jehol (Pan et al., Reference Pan, Sha and Fürsich2014). Obviously, salt water induces different reactions than fresh water and is highly buffered for pH fluctuations. Thus, in marine sediment, any pH decrease would be relatively small (6.4–6.6, as in Sagemann et al., Reference Sagemann, Bale, Briggs and Parkes1999; or 5.1–6.7, as in Wilson and Butterfield, Reference Wilson and Butterfield2014). Consequently, inhibition of bacterial growth, tanning, and clay hydrolysis would not start. Nevertheless, the buffering strength of the marine clay-containing sediments may differ from that of salt water. For example, Wilson and Butterfield’s (Reference Wilson and Butterfield2014) measurements show that in some cases (kaolinite, montmorillonite) the pH in the sediments deviated sharply from that in the overlying water. Our preliminary marine experimental system showed the same pattern of decay as in fresh water (Fig. 9.3), suggesting that marine sediments may undergo the same initial decaying/fossilizing steps.
Lagerstätten fossils demonstrated some features similar to experimental subfossils. (1) A nauplius after thermo-pressure experiment preserved the gut with some content (shown with the red arrow); (2) Redlichia (Pteroredlichia) sp. (from China, Balang Fm, Geyi sec.) preserved in the bleached spot and the diffusive brim stayed undissolved; (3) Mureropodia apae (Spain, Murero Lagerstäten) showing the color of the animal (lighter in the black and white image, light green in color) in contrast to the dark-green host rock; the difference is due to more perfect crystals of chlorite in the fossil than those in the surrounding matrix (refigured from Gamez Vintaned et al., Reference Gamez Vintaned, Liňán and Zhuravlev2011, with permission); (4) the light-colored сalcite-enriched layers (marked with arrows) in X-radiograph of polished slab from BS Lagerstätte (refigured from Gaines et al., Reference Gaines, Hammarlund, Hou, Qi, Gabbott, Zhao and Peng2012 with permission); and (5) the experimental tube with dissolved CaCl2 , the top layer of which contained calcite crystals, is shown for comparison.

Aside from the debate as to whether clay minerals were or were not among the primary entombing sediments in Lagerstätten and Burgess Shale-type Lagerstätten (Butterfield et al., Reference Butterfield, Baltasar and Wilson2007; Page et al., Reference Page, Gabbott, Wilby and Zalasiewicz2008; Cai et al., Reference Cai, Schiffbauer, Hua and Xiao2012), it should be noted that clays are inevitably present in virtually all modern sediments and are frequently found in large quantities. Conversely, clays were most likely present in ancient bottom sediments; the abundance of clays in sedimentary rocks increased rapidly since the Neoproterozoic and achieved considerable levels by the Cambrian (Kennedy et al., Reference Kennedy, Droser, Mayer, Pevear and Mrofka2006). Therefore, the role of clays should not be underestimated even in the examples of preservation in a dominantly carbonate environment.
The hypothesis of clay colloids arresting decay and initiating fossilization seems to be rather simple: all its ingredients look trivial. The obvious conditions for the “clay-colloid” mechanism are rapid burial under a thick layer of clay-containing sediment and the lack of mixing and bioturbation. Most likely, not all clays are suitable for tanning and other chemical defense against bacterial degradation (Painter, Reference Painter1991; Wilson and Butterfield, Reference Wilson and Butterfield2014); conversely, not all animal remains may be equally preserved under such conditions. These questions should be addressed in future investigations.
Our experimentally obtained pattern of decay shows a close resemblance to real Lagerstätten fossils in several crucial aspects:
(1) Fine morphological and anatomical elements were highly resistant to initial degradation and diagenesis. This is probably the most important point for the preservation of soft parts.
(2) The presence of various compounds and/or ions (Fe, S, P, and Ca) was not necessary to start and maintain the fossilization process. Nonetheless, these elements might be involved in constructing a fossil and, therefore, would diversify the ways of further fossilization (e.g., in Pan et al., Reference Pan, Sha and Fürsich2014). This possibility led to a variety of hypotheses concerning fossilization, e.g., in the Burgess Shale-type Lagerstätten, such as Fe-, or Fe-S-induced fossilization (Petrovich, Reference Petrovich2001). In this case, Fe cations act as coagulative agents instead of Al. In other cases, phosphorus-directed preservation leading to apatite replication occurred within the digestive system of animals (Briggs and Kear, Reference Briggs and Kear1994; Briggs, Reference Briggs2003).
(3) In some cases, a well-defined, halo-like zone around the fossil is recognized. The differences between this area and the surrounding rock visually manifest themselves in sharp contrasts either of color, structure, opacity, or texture of rock. In most cases the boundary between such spots and the consolidating sediment disappears as the convection fluids slowly mix with soluble compounds. But sometimes, if the diffusive boundary formed by resistant compounds, the consolidating sediment remains.
(4) Some fossils give evidence for the limitation of the diffusion rate in the vicinity of buried animal. Many specimens of Marrella splendens are represented by body replicas connected to dark stains that protruded from the bodies into the host rock. These stains were interpreted as residues of the hemolymph (Pushie et al., Reference Pushie, Pratt, Macdonald, George and Pickering2014). Biogenic fluids would have escaped from a body unless diffusion was limited for long enough to preserve the body as a stable carcass.
(5) The formation of sharp local acidic gradients in colloidal solution opens the possibility for various modes of fossilization within the neighboring unconsolidated sediment layers. Such differently constituted patches or layers may later be compressed into the same fossiliferous layer. This will result in the complex fossils (partly pyritized and partly as organic-carbon compressions in aluminosilicates), such as those from Gaojiashan, South China (Cai et al., Reference Cai, Schiffbauer, Hua and Xiao2012), or Mount Cap Formation, Canada (Butterfield, Reference Butterfield2003). Their formation is difficult to explain otherwise than by a sharp gradient of acidity and other conditions.
(6) The crystalline phase is better ordered around fossilized remains and within the surface layers of fossils than in the host matrix (Fig. 9.3). This feature has been reported for the Murero Lagerstätte in Spain (Gamez Vintaned et al., Reference Gamez Vintaned, Liňán and Zhuravlev2011) and the Soom Shale in South Africa (Whittle et al., Reference Whittle, Gabbott, Aldridge and Theron2007). It may indicate the dissolution of clay crystals and subsequent recrystallization of amorphous material.
(7) The formation of sharp pH gradients in the sediment can guide the layered deposition of Ca minerals if Ca is present in the system (which it would be in marine sediments). In our experiments, we detected the calcitic crystals only within the top layer with higher pH, but not in the acidic middle layers with the nauplii. Changing Ca-content was found in a number of Lagerstätten in America and China (Gaines et al., Reference Gaines, Hammarlund, Hou, Qi, Gabbott, Zhao and Peng2012). The Ca-rich layers in these Lagerstätten were shown to form at the water-sediment interface and were accounted for by a high alkalinity of Cambrian seawater. This interpretation is conceivable, but it: (1) does not explain the decrease in the Ca-content below the water-sediment interface, and (2) is not exclusive of the other chemical processes for calcite formation. Our explanation, which implies the sharp pH gradient as a mechanism for Ca-content alteration, supposes calcite formation in the surface sediment layers in the water of the neutral or higher pH. However, this mechanism needs to be confirmed in marine-water experiments.
Conclusions
Experiments were performed with kaolinite colloids to recreate the catastrophic deposition and burial of arthropod carcasses. A specific three-dimensional pattern of decay of the buried carcasses was revealed. A sharp acidic gradient formed around them as a result of diffusion being limited. In this acidic environment, the rate of the kaolinite dissolution increased, and the products of acidic hydrolysis played critical roles in the preservation and fossilization of organic remains. Kaolinite colloids may trigger preservation of the organic remains due to at least two processes: 1) high acidity, which inhibits bacterial proliferation; and 2) Al ions, released through the clay hydrolysis, that serve as tanning agents. After 14 months, buried carcasses transformed to clay-organic replicas, which we consider subfossils. They were formed by the amorphous kaolinite derivatives bound to the organic tissues. The subfossils showed considerable stability and retained their original morphology and anatomy after 14 months of the experiment and throughout the two weeks of subsequent treatment by high temperature and pressure. Further experimental work is needed to study the pH fluctuation in the marine sediments. In our experiments, the fresh water condition served to demonstrate the general features of the clay-organic tissues-water interplay. It differs from a duet “organic tissue-water” and in this way seems more realistic.
Acknowledgments
We thank L. Zaytseva and R. Rakitov for the technical help with the SEM analyses, A. Zotov for the technical help with thermostatic cell equipment, and V. Aleoshin for help with the chitin staining procedure. We are also grateful to T. Hegna, S. Peng, and R. Gaines, B. Pratt, J. Kimmig, and the anonymous reviewer for critical and substantive discussion. This work was funded by the Russian Governmental Program “Evolution of the biosphere” and by a Russian Science Foundation, grant No 14-14-00330.
Accessibility of supplemental data
Data available from the Dryad Digital Repository: http://doi.org/10.5061/dryad.qj728