Introduction
There is an impressive corpus of research on historical patterns of mob violence in the American South, which has been both multidisciplinary and multimethod (Bailey and Tolnay Reference Bailey and Tolnay2015; Brundage Reference Brundage1993; Carrigan Reference Carrigan2004; Corzine et al. Reference Corzine, Creech and Corzine1983; Franzosi 2012; Hagen et al. Reference Hagen, Makovi and Bearman2013; Pfeifer Reference Pfeifer2004; Reed Reference Reed1972; Senechal de la Roche Reference Senechal de la Roche and Brundage1997; Smångs Reference Smångs2017; Stovel Reference Stovel2001; Tolnay and Beck Reference Tolnay and Beck1995; Tolnay et al. Reference Tolnay, Deane and Beck1996; Vandiver Reference Vandiver2005; Wood Reference Wood2011; Wright Reference Wright1990). This scholarship has focused primarily on lynching and on the lynching of African Americans. While lynching is arguably indicative of the most extreme form of repressive social control exercised over the Southern black population, we argue that a more comprehensive approach would consider a broader array of extralegal activities and behaviors. In particular, the very act of publicly threatening lethal violence can be a powerful tool of intimidation.
By now, it has been well established that the frequency of lynching varied significantly across the Southern landscape. Most notably, the toll of victims was especially heavy in the “black belt” that runs from South Carolina through Georgia, Alabama, Mississippi, and into Louisiana. But, lynch mobs were also very active in a cluster of counties situated in northern Florida and within other limited locales. The temporal contours of lynching in the post-Reconstruction era are equally clear. After peaking in the 1890s, the annual number of Southern lynchings began a protracted decline, interrupted by intermittent spikes, such as occurred after World War I and during the resurgence of the Ku Klux Klan in the 1920s. By the early 1930s, lynching had become a relatively rare event, although it remained a powerful and occasionally horrific reminder of the vulnerability of the Southern African American population to mob violence.
Empirical research into the history of Southern racial violence has relied almost exclusively on analyses of the number of completed lynchings that occurred during specific periods or within specific locales. Writers from a variety of disciplines have contributed to this literature, including sociologists, historians, political scientists, and economists. Despite the growing body of evidence yielded by empirical studies based on such inventories, disagreement continues to exist about the specific spatial or temporal conditions that were more likely to spawn collective racial violence. However, most researchers likely would agree that Southern lynchings were not distributed randomly over time or across space.Footnote 1
Yet, the historical record of completed lynchings included in existing inventories does not tell the full story of the extent to which Southern blacks were subjected to terroristic social control by their white neighbors. Not all mob action was carried through to completion (Beck Reference Beck2015; Beck et al. Reference Beck, Tolnay and Bailey2016; Hagen et al. Reference Hagen, Makovi and Bearman2013; Raper Reference Raper1933). And, just as the intensity of completed lynchings varied across space, there were subregions of the South that witnessed relatively few lynchings yet experienced frequent threats of violence, generally directed at individual African Americans accused of crimes or racial norm transgressions. For example, between 1877 and 1950, Richland County, South Carolina had no deaths attributable to lynching yet had 14 threatened lynchings that were reported in the media, and six of those were very serious threats where a mob had formed and violence was planned. Similarly, Robeson County, North Carolina and Washington County, Virginia had nine threatened lynchings but no lethal incidents. Even though no one died at the hands of a mob in those counties, it would be naive to believe that they were similar to the 137 Southern counties that had neither serious threats nor lynchings over the same time span. Nor would those counties with threats but no lynchings be similar to Jefferson County, Alabama that experienced 30 threats of lynching and 23 cases of lethal mob violence. In terms of coercive environments, Robeson County and Washington County would seem to lie someplace between Alabama's Jefferson County and the 137 counties that lacked both publicized threats and completed lynchings.
Lynching threats, like completed lynchings, could have been a powerful mechanism for the terrorization and social control of Southern African Americans, even if none of the threats was consummated with a fatality. Such threats were a constant reminder of the vulnerability of the black population and, conversely, the power that was concentrated in the dominant white population. That some potential lynchings were prevented, often through the intervention of state authorities or interested third parties, does suggest limits to the ability of agitated whites to exact lethal extralegal punishment on their black neighbors (Beck Reference Beck2015; Beck et al. Reference Beck, Tolnay and Bailey2016; Hagen et al. Reference Hagen, Makovi and Bearman2013). Nonetheless, given the well-known record of completed lynchings in the South, even the threat of mob violence was surely a cause of great concern for local African Americans. Consequently, we propose that focusing exclusively on actualized lynchings produces an underrepresentation of the pervasiveness of coercion, intimidation, and potential for physical intimidation of the local black population and, therefore, the strength of the message of white supremacy that was communicated through collective violence.
Our primary objective in this article is not to generate definitive evidence regarding the temporal or spatial correlates of the intensity of mob violence, and thereby resolve the continuing dissensus regarding the most important antecedents of lynching behavior. Rather, our purpose is to evaluate critically the measure of lynching intensity that has been used by the overwhelming share of prior scholarship on the topic. That is, our focus is concentrated more heavily on the left-hand side of a typical prediction equation where the number of completed lynchings (however operationalized) is the dependent variable and a set of aggregate spatial or temporal variables (e.g., the relative size of the black population, agricultural specialty, or political party dominance) serves as the independent variables. Specifically, we explore the consequences of ignoring the extent to which mob violence was threatened or attempted, but not necessarily consummated. This is an omission that was required of all previous empirical studies of the intensity of lynching because, until very recently, good information has not been available about the frequency of threatened lynching attempts.
By combining an existing inventory of lynching incidents (Beck and Tolnay Reference Beck and Tolnay2016) with a newly available inventory of cases in which mob violence was threatened but not completed (Beck Reference Beck2015), we are able to assess the extent to which the conclusions of prior research would need to be amended if both completed and threatened lynchings were used to measure the intensity of local, violent social control over the black population. We are not the first to acknowledge the potential value of examining threatened, but aborted, lynching attempts in the study of the history of Southern racial violence. Raper (Reference Raper1933) mentioned averted lynchings in his classic volume The Tragedy of Lynching. More recently, Hagen and colleagues (Reference Hagen, Makovi and Bearman2013) refer to the omission of information about threatened lynchings as a possible source of selection bias. That is, they claim that previous research has been conducted with selection on the dependent variable such that only those incidents in which a lynching was successfully executed are included.
In the sections to follow, we first discuss the conceptual and theoretical implications of omitting information about threatened lynchings in the study of the history of Southern mob violence. We then use data for Southern counties between 1880 and 1929 to estimate a series of empirical models that allows us to assess the extent to which inferences about the contextual predictors of mob violence differ when the outcome variable is measured as: (1) completed lynchings, (2) lynching threats, or (3) a combination of completed and threatened lynchings. We conclude by assessing the extent to which the central inferences drawn from prior research require revision when information about the frequency of threatened mob violence is used to complement the record of completed lynchings as a measure of the intensity of the exercise of violent social control over the local African American population.
Conceptual Framework
Introducing Threatened Lynching to the Conceptual Model of Racialized Terrorism
It is useful to first consider what theoretical concept the number of lynching incidents or lynch victims has been assumed to represent in prior empirical research. Having a better idea of the underlying theoretical concept can help us to evaluate the quality (i.e., validity) of previous measurement strategies. To facilitate this general discussion we focus our attention on the most common scope conditions that have been applied in that previous research—the lynching of black men in counties of the American South between 1880 and 1930. Roughly 3,000 black men were lynched in the South during these five decades that are often referred to as the “lynching era” or the “age of lynching” (Rushdy Reference Rushdy2012; Tolnay and Beck Reference Tolnay and Beck1995).
We contend that most scholars have used the number of completed lynchings within Southern counties to represent, explicitly or implicitly, the intensity of terroristic social control with the black population as the intended target. In addition to a desire to punish specific individuals accused of crimes or racial norm violations, a variety of underlying motivations might have been responsible for such terrorism, including economic or political competition between blacks and whites (e.g., Beck and Tolnay Reference Beck and Tolnay1990; Corzine et al. Reference Corzine, Creech and Corzine1983; Reed Reference Reed1972; Soule Reference Soule, Sarah1992; Tolnay and Beck Reference Tolnay and Beck1995), maintenance of racial caste boundaries (Inverarity Reference Inverarity1976; Nevels Reference Nevels2007; Smångs Reference Smångs2016, Reference Smångs2017), or doubts among whites about the efficiency of local law enforcement and the severity of formal sanctioning (Pfeifer Reference Pfeifer2004; Vandiver Reference Vandiver2005). However, identification of the precise underlying mechanisms that were operating is not required to recognize that the number of successfully completed lynchings may be an incomplete reflection of the total quantum of racialized terrorism. The same, underlying, motivations induced many Southern mobs to threaten lynchings that were never completed or to inflict physical punishments such as beatings, whippings, and mutilations that were not lethal. A better measure of the total quantum of racialized terrorism would include threatened lynchings and extralegal nonlethal violence directed at the Southern black population.
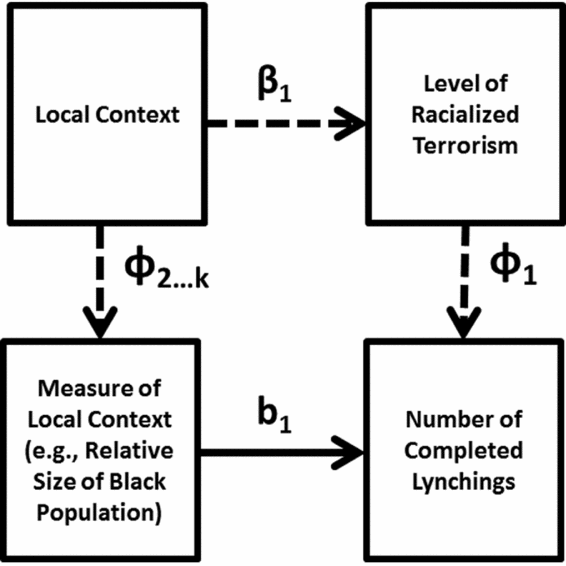
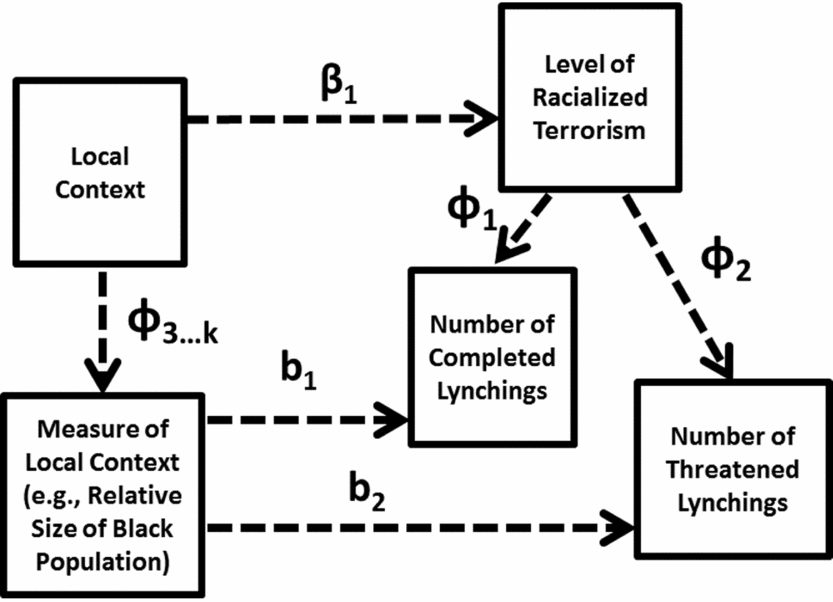
Prior empirical lynching research typically has applied the heuristic conceptual model represented in figure 1. In that model the local context, for example the relative size of the African American population, the vote share received by the Republican or Democratic parties, or the extent to which cotton production dominated the local agricultural economy (defined temporally or spatially), is hypothesized to influence the level of racialized terrorism, as measured by the number (or rate) of successfully executed lynchings (victims or incidents). Based on figure 1, the researcher's best estimate of the causal impact of the local context on the quantum of racialized terrorism (β1) is the observed parameter estimate b1, net of relevant controls.
Conventional conceptual model for the relationship between local context and level of racialized violence

Threats of lynching appeared in newspapers with some regularity and, in many instances, mobs gathered, yet were unsuccessful in carrying out their threats. In some cases, there was no emergent leader to direct the mob into collective action, while in others, agents of the state or private individuals took powerful action to thwart the mob. In such incidents, the motivation for violence clearly existed but, for whatever reason, the motivation was not translated into a completed lynching. That category of behavior was not included in most prior analyses because the required information has not been available. As a result of this omission in most prior research, the number of completed lynchings can understate, to varying and unknown degrees, the local propensity to lynch and, thereby, the underlying level of racialized terrorism. A recent and important exception is the study by Hagen and colleagues (Reference Hagen, Makovi and Bearman2013) that separately considered the contextual predictors of completed lynchings, mob formation, and averted lynching in three Southern states—Georgia, Mississippi, and North Carolina.
In yet other circumstances, Southern African Americans were attacked and punished by whites who had no intention of killing their victims. Often, like completed and threatened lynchings, these incidents were motivated by some alleged offense committed by the victim, but also had the potential to signal to the members of the broader African American community their vulnerable position under a regime of white supremacy. Such violent responses to perceived transgressions by blacks, however major or slight, were rarely prosecuted by legal authorities, or resulted in trivial sentences in line with the Southern racial caste system.
A more accurate measure of the total quantum of racialized terrorism would include both successfully completed and threatened lynching events, as well as nonlethal, extralegal punishment inflicted on Southern blacks. Including threatened lynchings and nonlethal, extralegal punishment has potentially important, and varied, implications for our measurement of the theoretical concept of primary interest—the total quantum of racialized terrorism. For example, the possibilities range from the case in which a community recorded no completed lynchings, but had experienced several lynching threats or nonlethal, extralegal attacks, to the case where a community recorded several completed lynchings but in which no threatened lynchings or nonlethal violence had occurred. In the latter case, the number of successfully completed lynchings would more accurately represent the local motivation for lynching than it would in the former case. In fact, in the former case, without also considering lynching threats and nonlethal punishment, we would conclude that there were no manifestations of racialized terrorism—as in the example of South Carolina's Richland County, mentioned previously.
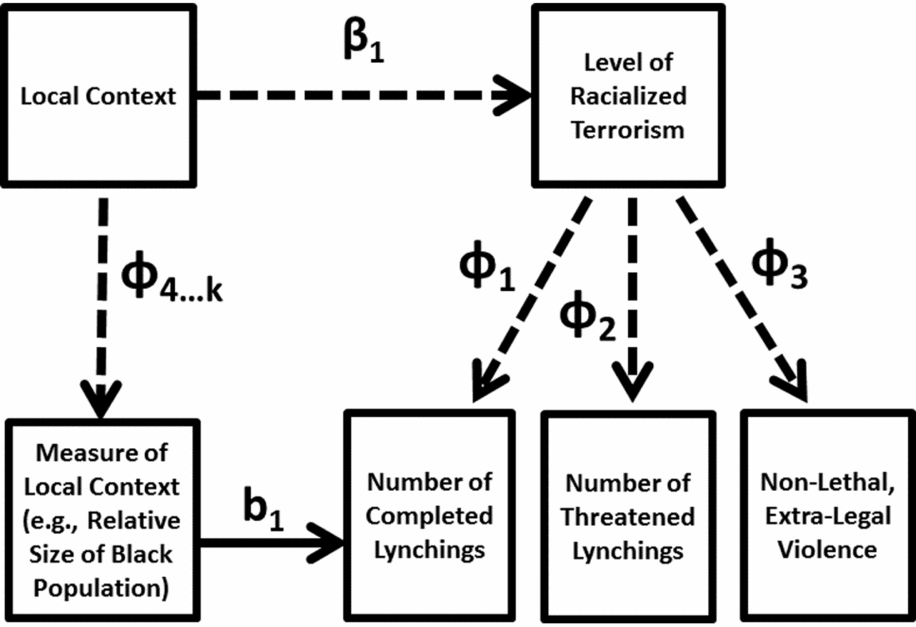
By introducing lynching threats and nonlethal, extralegal violence into the conceptual framework, the heuristic conceptual model shown in figure 1 can be revised as represented in figure 2. The elaborated model in figure 2 indicates that the “true” quantum of racialized terrorism within a local area is composed of three elements—those cases in which the initiated lynching was completed, consistent with past research, but also those cases in which a lynching was threatened or nonlethal violence directed at Southern blacks occurred. The relative frequency of these three components is represented in the elaborated figure by φ1, φ2, and φ3. But, those cases that follow the paths of φ2 and φ3 have been absent from prior research and the focus has been entirely on those cases that follow the path of φ1. For the revised conceptual model shown in figure 2, b1 becomes a dubious estimate for the corresponding parameter β1.
Expanded conceptual model for the relationship between local context and level of racialized violence

Nonlethal, extralegal violence directed at Southern blacks, as represented in figure 2, is an important ingredient in the behavioral dimensions to racialized terrorism. Unfortunately, we can incorporate it only conceptually in this study. To our knowledge, no inventory of extralegal, nonlethal attacks has been created, in contrast to the inventories of completed and threatened lynchings described in the following text. Therefore, the following analyses and discussion are necessarily limited to completed and threatened lynchings as indicators of racialized terrorism.
Consequences for the Level of and Variation in Racialized Terrorism
We next consider two potential consequences that follow from the inability of prior empirical research to include information about φ2, represented in figure 2. The most obvious consequence resulting from the omission of threatened lynchings in prior empirical research is that we have drawn inaccurate conclusions about the absolute level (i.e., the quantum) of racialized terrorism that was exercised within areas or during periods. In some respects, this is not a new challenge. Most researchers have long recognized that even the best inventories of lynching events surely represent some level of an undercount of the actual or “true” number of lynchings that occurred in Southern counties. Some lynchings were never recorded, and we really have no good idea of the extent of this undercount or a plausible strategy for finding out. While continuing archival work will certainly uncover additional cases of completed lynchings, we can be confident that the undercount will never be reduced to zero. In contrast, fewer researchers have acknowledged the potential problem of missing information about lynching threats (for notable exceptions, see Beck Reference Beck2015 and Hagen et al. Reference Hagen, Makovi and Bearman2013). A more accurate picture of the quantum of racialized terrorism (and the motivation for local populations to lynch), we argue, would combine information about both the number of successful and threatened lynching events. To be sure, like inventories of completed lynchings, it could never be claimed that even the very best enumeration of threatened lynchings includes all such incidents.
A second potential consequence of failing to include threatened lynchings in prior empirical research concerns the inferences that have been drawn about the possible social, economic, political, demographic, and cultural determinants of mob violence. Such inferences have been based on the level of covariation between the number of completed lynchings and various measures of the local context. For example, prior research has demonstrated a strong and robust positive relationship between the number of completed lynchings and the dominance of cotton cultivation in the local agricultural economy. So, how might the absence of information about threatened lynchings affect such conclusions? On the one hand, the most benign condition would exist if completed and threatened lynchings were distributed identically across Southern counties. In that case, relying only on the number of completed lynchings and ignoring threatened lynchings would adequately represent the relationship between the intensity of racialized terrorism and the nature of the local context. On the other hand, the situation grows more problematic as the spatial distributions of completed and threatened lynchings diverge. This is due to the fact that the number of completed lynchings is a less valid measure of the theoretical construct “racialized terrorism” when the distributions differ. In the worst case, it is conceivable that prior empirical work has yielded evidence that seriously misrepresents the “true” relationship between the total quantum of racialized terrorism and the nature of the local context.
To our knowledge, the only prior effort to compare the contextual predictors of completed lynchings with potential mob efforts that did not necessarily result in a fatality is the innovative study by Hagen et al. (Reference Hagen, Makovi and Bearman2013). Their separate analyses of completed lynchings, mob formations, and averted lynchings in Georgia, Mississippi, and North Carolina suggest that past inferences of the role of cotton dependency and local racial composition hold up quite well when alternative measures of racial conflict are considered. Likewise, their finding of a negative association between the local strength of the Republican Party and completed lynchings and incidents of mob formation echoes similar evidence presented by Tolnay and Beck (Reference Tolnay and Beck1995: 190–98) for completed lynchings during the Redemption (1882–89) and Populist (1890–99) eras in 10 Southern states.
Completed Versus Threatened Lynching
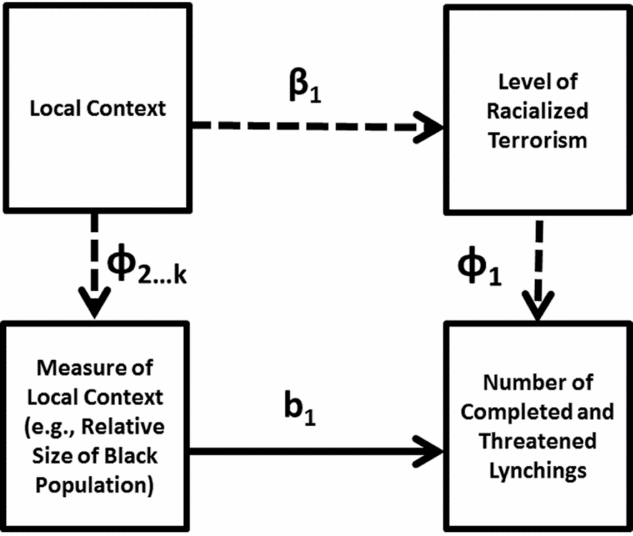
An obvious solution to the problems inherent in the omission of the number of threatened lynchings from prior measures of the intensity of racialized terrorism is to combine completed and threatened mob violence into a single indicator, as shown in figure 3. In contrast to the model represented in figure 2, the parameter estimate, b1, in figure 3 now serves as a reasonable quantification of the relationship between the characteristics of the local context and the volume of racialized terrorism.
Revised conceptual model for the relationship between local context and racialized terrorism, combining completed and threatened lynchings

When implementing this obvious solution, however, it is important to acknowledge potential differences in the underlying processes that resulted in completed and threatened lynching incidents, which are now combined as a single measure of the level of racialized terrorism in figure 3. Any such differences are instrumental in determining the extent to which the conclusions reached about the contextual predictors of racialized terrorism based on the implied analytic model in figure 3 will agree with or depart from those drawn from previous research that was restricted to only the number of completed lynchings as a measure of the volume of racialized terrorism (see figure 1). Figure 4 represents this potential complication to combining completed and threatened lynchings into a single measure of total racialized terrorism, as proposed by figure 3. Specifically, it is prudent to consider the possibility that the nature of the local context (e.g., political, economic, demographic) has different effects on the separate volumes of completed lynchings and threatened lynchings. Therefore, according to figure 4, it would be misleading to assume that b1 is equal to b2 and that they both represent our best estimate of β1.
Revised conceptual model for the relationship between local context and completed and threatened lynchings

With access to information for nearly 2,500 completed lynchings and 2,300 threatened lynchings in 11 Southern states between 1880 and 1929, we can investigate questions regarding the volume of racialized terrorism and the contextual correlates of geographic variation in the total volume of racialized terrorism and its separate components of completed and threatened lynchings. Specifically, we seek answers to the following general research questions:
• How does the inclusion of threatened lynchings change the quantum of racialized terrorism for 11 Southern states and for the years 1880 through 1929?
• How, if at all, does the inclusion of threatened lynchings affect the conclusions that have been drawn from prior research regarding the contextual correlates of spatial variation in racialized terrorism?
• Are there substantial differences between the contextual correlates of completed and threatened lynchings?
Data, Measures, and Method
Our study follows in the tradition of much prior research on Southern lynching by using counties as our primary units of analysis. Specifically, our statistical analyses are based on all counties in the following 11 Southern states: Alabama, Arkansas, Florida, Georgia, Kentucky, Louisiana, Mississippi, North Carolina, South Carolina, Tennessee, and Virginia.Footnote 2
We draw from an updated version of the Beck-Tolnay confirmed inventory of Southern lynchings (Beck and Tolnay Reference Beck and Tolnay2016) for information about successfully completed lynching incidents between 1880 and 1929. For information about threatened lynchings during the same period, we use a relatively new inventory of lynching threats that was constructed by E. M. Beck (Reference Beck2015, Beck et al. Reference Beck, Tolnay and Bailey2016).Footnote 3 Completed lynchings and threatened lynchings are the two dimensions that comprise the construct “racialized terrorism” that is of central importance to the conceptual framework discussed previously. Again, although nonlethal, extralegal violence directed at Southern blacks constitutes a third dimension of racialized terrorism, the lack of a comprehensive inventory of such incidents precludes its inclusion in our empirical analyses. More detail about the inventories of completed and threatened lynchings is provided in the following text.
The pursuit of answers to our three research questions also requires that we have access to information about the local context. For this purpose, we use data for the counties in the same 11 Southern states that are obtained from a variety of historical sources, including the US decennial population and agricultural censuses, voting data, and records of legal executions. The specific measures we use to characterize the local context are drawn from those that have been used most frequently in past research on Southern lynching. Our intent is not to include an exhaustive set of contextual characteristics that have been used in prior research. These data refer to a variety of time points between 1880 and 1929, as described in more detail in the following text.
Inventory of Completed Lynchings
The data for completed lynching incidents with black victims used in our study is an expanded and revised version of the inventory that was created by E. M. Beck and Stewart Tolnay and used in their book A Festival of Violence: An Analysis of Southern Lynchings, 1882 to 1930, and in other publications by the two researchers and, subsequently, by many others. The expanded version of the inventory includes the state of Virginia, which was not included in their original inventory, and extends the period covered to include 1877 through 1950. To maintain consistency with most prior research, our analyses are restricted to the years 1880 through 1929, the temporal boundaries that have typically defined the “lynching era.” The updated inventory of completed lynching incidents with black victims also includes additions, deletions, and corrections that are based on further archival research made possible by the vast improvement in online historical newspaper collections since the original Beck-Tolnay inventory was constructed in the late 1980s and early 1990s.
Inventory of Threatened Lynchings
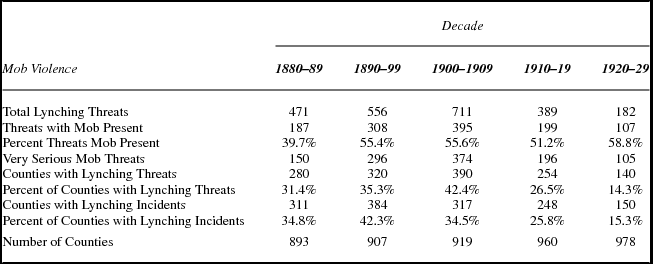
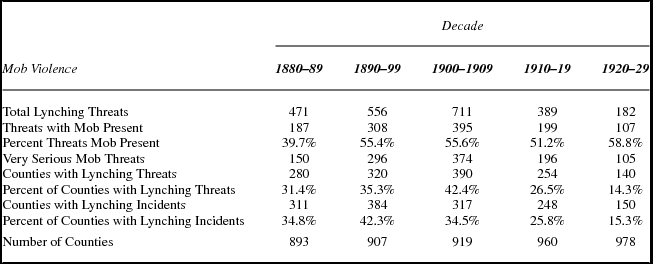
The inventory of threatened lynchings was constructed by searching through historical newspaper archives using Ancestry.com, GenealogyBank.com, ChroniclingAmerica.loc.gov, NewspaperArchive.com, Newspapers.com, ProQuest, or other sources using 49 different search terms.Footnote 4 That searching process generated more than 44,000 hits. A determination was made whether the identified report could be classified as a threatened lynching of a person or persons who had been apprehended. Once an incident was identified, an attempt was made to find additional newspaper reports. Each record in the inventory describes an incident that may involve multiple potential victims, and any given person can appear in multiple incidents. For each threatened incident, data were collected on the name(s), race, and sex of the potential victim(s), and location. This new inventory also catalogs for each incident whether there was an extraordinary intervention by authorities or by civilian third parties whether a mob existed at the time of the threat and, if it did, its size and composition, as well as other germane information.
Not all lynching threats were equally serious.Footnote 5 At the mildest level of threat, a suspect has been apprehended and a lynching is predicted, but there is no evidence that a mob has formed or evidence of extraordinary precautionary actions taken to protect the potential victim. A more serious risk of mob violence was reflected when the local authorities elected to take affirmative action before a lynch mob could form. At the highest level of risk there had been direct action by a mob to lynch a suspected offender, such as attacking a jail or trying to take the prisoner from the custody of authorities or third parties.
Contextual Predictors of Racialized Terrorism
The predictor variables included in the following statistical analyses are intended to tap the social, economic, political, and demographic characteristics of the local context that influence the level of racialized terrorism within Southern counties. As mentioned previously, they are a selective, rather than exhaustive, set of characteristics that have been featured in prior research on lynching.
Demographic Characteristics
The natural logarithm of the county's population size is controlled to account for the likelihood that more completed lynchings and threatened lynchings occurred in more populous areas. That population size is likely correlated with some of the other contextual predictors of racialized terrorism motivates its inclusion as a control variable.
The racial composition of local areas has emerged consistently as a significant predictor of the frequency of lynching. In most cases, the relationship has been found to be nonlinear with a positive slope that weakens, or even turns negative, at higher concentrations of African American population (Bailey and Snedker Reference Bailey and Snedker2011; Hagen et al. Reference Hagen, Makovi and Bearman2013; Smångs Reference Smångs2016; Tolnay and Beck Reference Tolnay and Beck1995). The often-found significant relationship between black population concentration and lynching, including its functional form, has been inferred as support for Blalock's threat models of discriminatory behavior (Blalock Reference Blalock1967; Corzine et al. Reference Corzine, Creech and Corzine1983; Tolnay and Beck Reference Tolnay and Beck1995). To capture this nonlinearity we include percent black and percent black squared in the county population as measures of local context in our prediction equations. Despite the occurrence of several highly visible lynchings in Southern towns and cities (Beck et al. Reference Beck, Tolnay and Bailey2016; Wood Reference Wood2011), lynching has typically been considered primarily a phenomenon of the countryside. To capture this bucolic concentration, we include the percent of the county population that was rural (i.e., residing in an area with population less than 2,500) as a measure of the local context. Information for all county-level demographic measures is drawn from the US decennial censuses of population for 1880 through 1920 (Haines Reference Haines2010).
Political Environment
Several scholars have considered political forces as a possible motivation for Southern mob violence, generally consistent with Blalock's political threat model. These studies have included consideration of the role of political disenfranchisement (Tolnay and Beck Reference Tolnay and Beck1995: ch. 6) as well as the relative strength of political parties in the local area (Beck et al. Reference Beck, Tolnay and Bailey2016; Hagen 2013; Reed Reference Reed1972; Smångs Reference Smångs2016; Soule Reference Soule, Sarah1992; Tolnay and Beck Reference Tolnay and Beck1995: ch. 6). We include in our models the average percentage of votes within a county that were cast for the Democratic candidate in all presidential elections that occurred in each decade. Throughout the lynching era, the Democratic Party was generally considered the party of white supremacy and to be more hostile than the Republican Party to the interests of Southern blacks. Prior research has shown a positive relationship between lynching and the relative vote share garnered by Democrats (e.g., Smångs Reference Smångs2016), and a negative relationship for the relative vote share going to Republicans (e.g., Hagen 2013; Tolnay and Beck Reference Tolnay and Beck1995). The information for Democratic vote share is drawn from county-level historical elections return data (Clubb et al. Reference Clubb, Flanigan and Zingale2006).
Agricultural Specialty
A strong emphasis in prior research on Southern lynching has been placed on the nature of the agricultural economy. This work has emphasized most prominently local crop specialization (Bailey and Snedker Reference Bailey and Snedker2011; Hagan et al. Reference Hagen, Makovi and Bearman2013; Smångs Reference Smångs2016; Soule Reference Soule, Sarah1992; Tolnay and Beck Reference Tolnay and Beck1995). The dominance of cotton cultivation has frequently emerged as a significant predictor of the frequency of mob violence. We therefore include the percentage of improved land within each county that was devoted to cotton cultivation as an indicator of local crop specialization. We also include the percentage of improved land devoted to tobacco cultivation to further specify the nature of the local agricultural economy. In some respects, cotton and tobacco production shared similar characteristics of labor organization and usage, although there were also important differences (Daniel Reference Daniel1985).Footnote 6 Information for county-level measures of crop specialization were drawn from the US decennial censuses of agriculture for 1880 through 1920.
Alternative Legal, Lethal Punishment
The notion that lynching served as a form of “popular justice” or as a “rough justice” alternative to due process has led some scholars to argue that legal state-exercised capital punishment served as a substitute for mob violence, and possibly contributed to the eventual demise of lynching (e.g., Berg Reference Berg, Berg, Kapsch and Streng2006; Pfeifer Reference Pfeifer2004; Vandiver Reference Vandiver2005; Wood Reference Wood2011). Despite its appealing logic, the empirical evidence marshalled in support of this “substitution hypothesis” has been relatively weak (Tolnay and Beck Reference Tolnay and Beck1995: ch. 4; Tolnay et al. Reference Tolnay, Beck and Massey1992). Nonetheless, given prior attention to the possibility that legal executions substituted for, and possibly replaced, mob violence, we include a measure that describes the number of executions that were carried out for crimes committed within the counties of the 11 Southern states included in our analysis. County-level data for legal executions were obtained from a database constructed by M. Watt Espy and John Smykla (Reference Espy and Smykla2004) and made publicly available through the Interuniversity Consortium for Political and Social Research.
Other Predictors
We include as predictors in our models a set of dummy variables representing the five decades covered by our completed lynching and threatened lynching inventories (with 1890–99 serving as the reference category). Substantial temporal variation in the intensity of post-Reconstruction lynching has been demonstrated in prior research (e.g., Tolnay and Beck Reference Tolnay and Beck1995), with the highest annual totals occurring in the 1890s, followed by a protracted decline through the 1920s, interrupted by periodic spikes, for example in the post–World War I period.
To capture subregional differences that are not measured by other covariates in our models, we include a dummy variable distinguishing states in the Deep South (coded “1”) from those in the Border South (coded “0”).Footnote 7 Prior research has revealed higher levels of mob violence in the Deep South subregion.
Analytic Strategy
We begin our analysis by examining simple geographic and temporal variation in the frequencies of completed lynchings, threatened lynchings, and the combination of the two. These descriptive patterns are presented in an initial effort to gauge the extent to which the omission of threatened lynchings from previous research has produced understatements of the total quantum of racialized terrorism in the South between 1880 and 1929, as well as to assess the extent to which the distributions of completed and threatened lynchings were similar or different across space and over time.
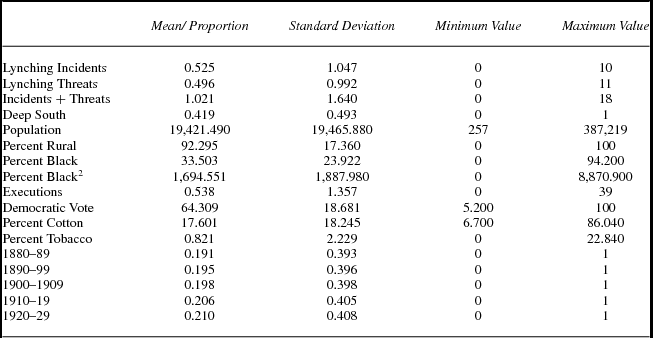
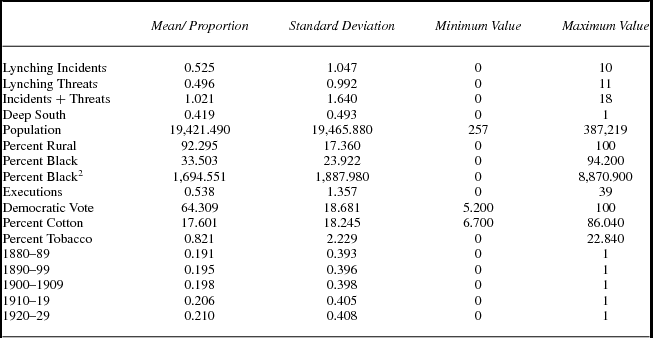
We then turn to multivariate analyses that are based on county-decades as the units of analysis. Three separate dependent variables are considered: (1) the number of completed lynchings during the decade, (2) the number of lynching threats during the decade, and (3) the combined number of completed lynchings and lynching threats during the decade. The predictor variables are matched to the same decades for which the dependent variables are measured. Negative binomial panel regression is used to estimate the three different models, consistent with the positively skewed count variables that serve as our dependent variables. The models were estimated using xtnbreg in Stata Version 14.2. Standard errors are adjusted for the clustering of decades within counties.Table B in the appendix reports basic descriptive statistics for all variables used in the following analyses.
Findings
Descriptive Spatial and Temporal Patterns of Racialized Terrorism
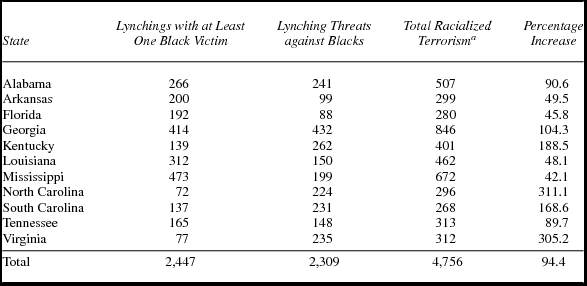
A first indication of the extent to which the estimated frequency of racialized terrorism in the South is changed by introducing information about threatened lynching incidents is provided in table 1. The columns of table 1 report, by state for the years 1880 to 1929, the number of completed lynchings, the number of lynching threats, the combined total of completed and threatened lynchings, and the percentage increase in the quantum of racialized terrorism observed by including threatened lynching incidents. Had all lynching threats been carried through to completion there would have been nearly twice as many (an increase of 94.4 percent) lynchings between 1880 and 1929 in the 11 states represented in table 1. However, there is substantial intraregional variation in the extent to which the total quantum of racialized terrorism is affected by including lynching threats. At one extreme, the lynching toll in North Carolina would have been roughly three times greater; at the other extreme, Mississippi would have seen less than a 50 percent increase in racialized terrorism. Overall, the simple interstate correlation between the number of completed and threatened lynchings is r = +0.27 (p > .05).
Incidents of threatened mob violence against African Americans and incidents of lynching of African Americans, by state, 1880–1929Footnote a

a Total racialized terrorism is the sum of the number of lynching incidents with at least one black victim plus the number of incidents of blacks being threatened with lynching.
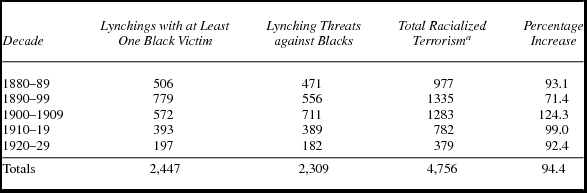
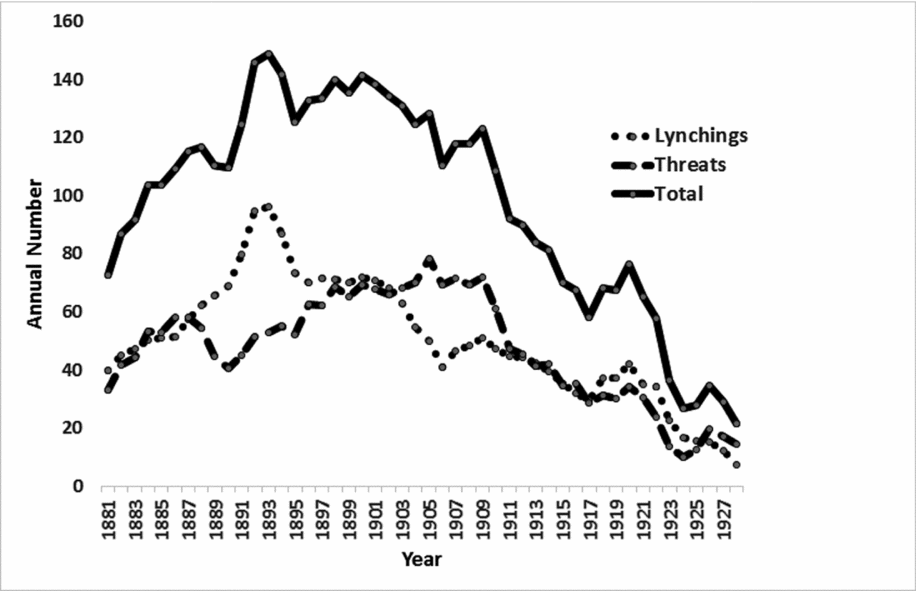
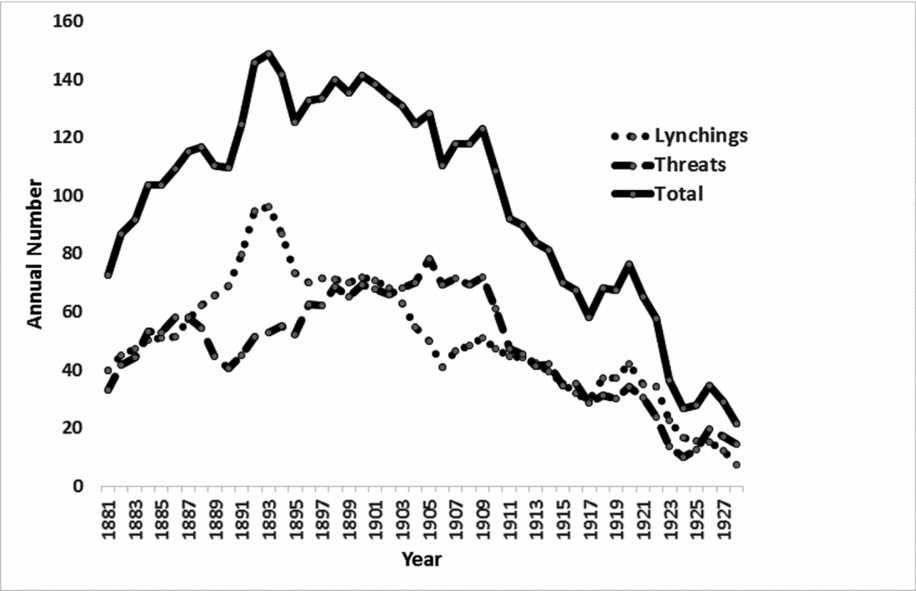
Shifting from a spatial to a temporal orientation, table 2 shows the numbers of completed lynching incidents, lynching threats, and the combined total of completed and threatened lynchings by decade. Substantial temporal variation is apparent in table 2, with threatened lynching incidents contributing considerably more after the turn of the twentieth century. For example, the years 1900 to 1909 would have experienced 124 percent more lynching incidents if all lynching threats had been carried through to completion. In contrast, racialized terrorism would have been only 71 percent more common during the 1890s. The correlation between the annual number of completed and threatened lynchings is r = +0.68 (p < .01).Footnote 8
Incidents of threatened mob violence against African Americans and incidents of lynching of African Africans, by decade, 1880–1929

a Total racialized terrorism is the sum of the number of lynching incidents with at least one black victim plus the number of incidents of blacks being threatened with lynching.
This simple descriptive evidence yields two important conclusions. First, the history of racialized violence in the South between 1880 and 1929 would have been substantially bloodier had all lynching threats been carried through to completion. This would have been particularly true in Virginia and North Carolina, and during the first decade of the twentieth century. An important caveat is appropriate when projecting the percentage increase in total racialized violence that would have occurred, by state or period, if all threatened lynchings had resulted in fatalities. That is, the circumstances surrounding threatened lynchings were not necessarily identical to those for completed lynchings. Therefore, the percentage increases, by state or period, reported in tables 1 and 2 should be considered a maximum scenario.
Second, although the spatial and temporal covariation between completed and threatened lynchings was nontrivial, the two distributions fall far short of perfect redundancy. Therefore, it is quite possible that the contextual antecedents that gave rise to completed lynching incidents were somewhat different from those that resulted in threatened lynching attempts. That is the question to which we next turn.
Multivariate Analysis of Completed Lynching, Lynching Threats, and Total Racialized Terrorism
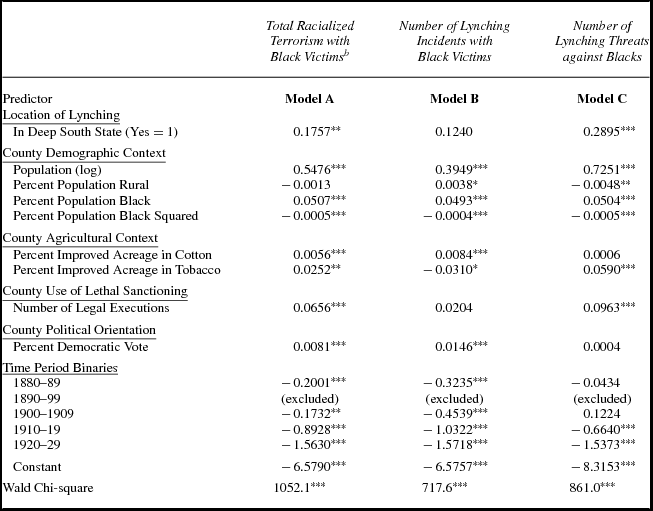
Table 3 presents the results of the multivariate analysis of completed lynchings with black victims, lynching threats against blacks, and the combined total of lynchings and threats. We begin by summarizing the evidence obtained when using the combination of completed and threatened lynchings that better represents the concept of total racialized terrorism that, we argue in the preceding text, is the true underlying concept of interest in most prior research on Southern lynching.Footnote 9 We then compare those findings to the results obtained from parallel, separate analyses of completed and threatened lynching to (1) assess their consistency with past research and (2) identify the source of any differences between the contextual conditions that gave rise to more total racialized terrorism and more completed lynchings.Footnote 10
Negative binomial panel regression results for predicting total racialized terrorism, number of lynching incidents with one or more black victims, and threats of lynching with one or more blacks, 1880–1929Footnote a

a Regressions estimated as population-averaged models, N = 4,594.
b Total racialized terrorism is the sum of the number of lynching incidents and number of serious lynching threats.
*p < 0.10. **p < 0.05. ***p < 0.01.
Contextual Predictors of Total Racialized Terrorism
The results obtained when total racialized terrorism serves as the dependent variable are reported in model A of table 3. With respect to local demographic characteristics, total racialized terrorism was more intense in areas with larger populations. In addition, the frequency of total racialized terrorism rose along with the proportionate size of the local black population, up to a point where blacks represented roughly 52 percent of the population, and then declined. The significant and nonlinear relationship between percent black and total racialized terrorism is consistent with Blalock's economic threat hypothesis (1967) and with most prior research on Southern lynching (e.g., Bailey and Snedker Reference Bailey and Snedker2011; Hagen et al. Reference Hagen, Makovi and Bearman2013; Smångs Reference Smångs2016; Tolnay and Beck Reference Tolnay and Beck1995).
The local agricultural economy also played a significant role in shaping the level of racialized terrorism. Total racialized terrorism was more common in areas in which cotton and tobacco production represented a more important part of the agricultural economy. The role of King Cotton in creating and fostering a local social and economic climate conducive to mob violence has been frequently acknowledged in the previous empirical research on Southern lynching (Bailey and Snedker Reference Bailey and Snedker2011; Hagan et al. Reference Hagen, Makovi and Bearman2013; Smångs Reference Smångs2016; Soule Reference Soule, Sarah1992; Tolnay and Beck Reference Tolnay and Beck1995). Other crop specialties, for example tobacco, have received less attention in previous studies.
Other findings show that racialized terrorism was more frequent in Deep South states, where the Democratic Party vote share in presidential elections was greater and where legal executions were more numerous. The significant role of local political party strength revealed in table 3 is consistent with previous research, some of which has relied on measures of Republican Party vote share (Hagen et al. Reference Hagen, Makovi and Bearman2013; Smångs Reference Smångs2016; Tolnay and Beck Reference Tolnay and Beck1995). That extralegal racialized terrorism and legal execution were used in combination as methods of control over the local black population has been inferred from previous research (e.g., Tolnay and Beck Reference Tolnay and Beck1995; Tolnay et al. Reference Tolnay, Beck and Massey1992). Finally, consistent with earlier studies of Southern lynching, the intensity of total racialized terrorism during the post-Reconstruction era peaked in the 1890s and declined thereafter.
As noted, many of these results resonate with similar findings from previous studies that restricted their focus to the contextual predictors of the number of completed lynching incidents with black victims. But, how do these results compare to those obtained from identical models that are estimated with completed lynchings and threatened lynchings as the dependent variables? As proposed by the conceptual model shown in figure 4, it is possible that the contextual predictors evince different relationships with these two dimensions of total racialized terrorism. By first estimating a model with completed lynchings as the dependent variable, we can compare the results from the conventional approach (i.e., the one used in most previous research) with those obtained by the revised approach (i.e., combining lynching threats and completed lynchings as in model A). The final model, using threatened lynchings as the dependent variable, allows us to further interrogate any differences between the predictors of completed and threatened lynchings. We turn now to those questions.
Contextual Predictors of Completed Lynchings
Using the traditional definition of racialized terrorism (i.e., completed lynching incidents with black victims) yields the results presented in model B of table 3. For the most part, the findings comport with those obtained when the definition of racialized terrorism is expanded to include all lynching threats directed at Southern blacks (model A). Both models reveal the important influence of population size, population racial composition, cotton dominance, and Democratic Party strength as predictors of racialized terrorism. However, the two sets of results are not identical. When only the number of completed lynching incidents is the analytic focus, neither location in the Deep South nor legal executions emerge as significant predictors, in contrast to the findings for total racialized terrorism. Furthermore, the percent of the local population that resided in rural areas is positively related to the number of completed lynchings and the intensity of tobacco production is negatively related. The former was unrelated to total racialized terrorism while the latter was positively related.
Contextual Predictors of Threatened Lynchings
The source of the differences between the conventional (i.e., model B) and revised stories of racialized terrorism (i.e., model A) can be gleaned from a comparison of model B and model C in table 3. Several differences between the contextual predictors of completed lynchings and threatened lynchings are apparent.
• In contrast to the findings for completed lynchings, threatened lynchings were less common in more rural areas (β = +0.0038, p < .10, versus β = −0.0048, p < .05, respectively).
• Net of other predictors, counties in the Deep South experienced significantly more lynching threats, while subregional location was unrelated to the number of completed lynchings (β = +0.2895, p < .01, versus β = +0.1240, p > .10, respectively).
• Local agricultural specialty exhibits different relationships for the two dependent variables. Whereas cotton dominance is positively and significantly related to the number of completed lynchings (β = +0.0084, p < .01) it is unrelated to the number of threatened lynchings (β = +0.0006, p > .10). Conversely, the strength of the local tobacco culture is positively associated with threatened lynchings (β = +0.0590, p < .01) but negatively related to completed lynchings (β = −0.0310, p < .10).
• Local strength of the Democratic Party exhibits a positive and significant relationship with completed lynchings (β = +0.0146, p < .01) but is unrelated to lynching threats (β = +0.0004, p > .10).
• Lynching threats were more common in settings where the state was more active in carrying out lethal sanctioning (β = +0.0093, p < .01), but the number of completed lynchings appears to be unrelated to the number of legal executions (β = +0.0204, p > .10).
• The temporal pattern of threatened lynchings deviates modestly from the parallel gradient for completed lynchings. Unlike the findings for completed lynchings (or for total racialized terrorism), threatened lynchings were not significantly less common in the 1880s or between 1900 and 1909 than they were during the 1890s, the height of the “lynching era.”
• These differences contribute directly to the varying empirical evidence obtained when the measure of racialized terrorism is limited to only completed lynchings (model B) versus the expanded definition that combines completed and threatened lynchings (model A).
With this empirical evidence in hand, we can offer an assessment of the conceptual framework proposed earlier in the article. First, some of the same environmental conditions that were associated with larger numbers of completed lynchings are also associated with more incidents in which a lynching threat existed (e.g., population size and racial composition). Those parallels account for the generally similar conclusions reached about the contextual correlates of racialized terrorism—whether only completed lynchings or the combined number of completed and threatened lynchings is used to operationalize the concept. This outcome is reassuring for scholars who have relied on the findings from previous research that was based only on the analysis of the number of completed lynchings.
Second, the results presented in table 3 suggest that the environmental conditions correlated with the frequency of completed lynchings were not identical to the environmental conditions that led to lynching threats. For instance, rurality, political forces, characteristics of agricultural specialty, subregional location, and time, itself, evinced somewhat different relationships with the number of completed and threatened lynchings. These differences are cause for concern among scholars who consider the environment of racialized terrorism in the American South during the late nineteenth and early twentieth centuries to have transcended the gruesome tally of lynch victims to include threats directed at the local black population (as well as the unmeasured dimension of extralegal, nonlethal violence). While a fuller investigation of these differences is beyond the scope of the current study, a significant conclusion to be reached from the empirical evidence presented in table 3 is that future research into the conditions that contributed to racialized terrorism should be guided by a conceptual framework similar to that proposed in figure 4. That is, our findings suggest that the different forms of racialized terrorism were not necessarily shaped by identical contextual conditions.
Conclusions and Discussion
To assess the implications of the evidence presented for scholars interested in the history of Southern racial violence, we revisit the three primary research questions that motivated our study.
Somewhat predictably, incorporating threatened lynchings into a measure of “racialized terrorism” substantially increases the quantum of such behavior in the 11 Southern states, during the 50-year period, considered in our analyses. Overall, including lynching threats nearly doubles the level of racialized terrorism experienced by the Southern African American population. Somewhat less predictable are our findings that this increase in the quantum of racialized terrorism is substantially greater in some Southern states, for example, Kentucky, North Carolina, and Virginia, and during specific periods, especially the early 1900s and 1920s. However, we repeat the caveat that these conclusions about the extent to which the quantum of racialized terrorism would have increased if all threatened lynchings resulted in a fatality should be considered a maximum estimate.
A second primary objective was to determine whether the conclusions drawn from prior research, based on statistical analyses of the environmental correlates of completed lynchings, are robust to the inclusion of lynching threats in a measure of racialized terrorism. The evidence yielded by our study is generally reassuring regarding the durability of several central findings from earlier research that focused exclusively on the contextual conditions associated with more frequent completed lynching incidents or victims (compare model A and model B in table 3). Coefficients for stalwart predictors of completed lynchings, such as the proportionate size of the local black population, the dominance of cotton in the local agricultural economy, subregional location, and the Democratic Party vote share in presidential elections, remained statistically significant and with consistent directional signs when the broader definition of racialized terrorism was used as the dependent variable. Moreover, total racialized terrorism followed the same general temporal gradient as did the number of completed lynchings.
Yet, sufficient discrepancies exist between the models predicting the number of completed lynchings and the combined total of completed and threatened lynchings to discourage complete sanguinity by scholars on this issue. Most notably, the statistically significant positive association between the rurality of the local population and completed lynchings is not found when lynching threats are included, and the use of legal executions emerges as a significant predictor of completed and threatened lynchings combined, but not of completed lynchings alone. Overall, however, it is our judgment that the more robust relationships involve characteristics of the local area that have received the most attention in previous research that has attempted to identify the environmental correlates of the intensity of racialized terrorism.
Regarding our third motivating research question, we observe some predictors that have varying relationships with the number of completed and threatened lynchings (compare model B and model C in table 3). Rurality of the local population has conflicting implications for the two dependent variables—significantly positive for completed lynchings but significantly negative for threatened lynchings. Likewise, tobacco specialization has opposite effects on the two dimensions of racialized terrorism—negative for completed lynchings and positive for lynching threats. In addition, cotton acreage, legal executions, strength of the Democratic Party, subregional location, and even the binary variables representing the 1880–89 and 1900–1909 periods are statistically significantly related to one dimension of total racialized terrorism, but not to the other. As noted earlier, these contrasts contribute to the differences in the strength and statistical significance of predictors in the models for completed lynchings and total racialized terrorism.
Our findings strongly suggest that the antecedents of racialized terrorism were not uniform across its different dimensions, as anticipated by the conceptual model reported in figure 4. There appear to have been fundamental differences between the types of areas that relied more on completed lynchings than on lynching threats to reinforce white supremacy. Or, perhaps, part of the difference lies in the willingness of, or capacity for, local areas to intercede when faced with a serious threat of lynching (e.g., Beck et al. Reference Beck, Tolnay and Bailey2016; Hagen et al. Reference Hagen, Makovi and Bearman2013). It is beyond the scope of this study to explore the contribution of areal variation in the likelihood of intervention by state authorities to the observed differences in the predictors of completed and threatened lynchings. However, that remains an important objective for future research.
In this article, we have argued for expanding the definition of racialized terrorism to include mob activity that did not necessarily result in the death of the intended victim. Most scholars have long recognized that Southern racial violence was about much more than the punishment of suspected criminals. Rather, it was also a powerful signal of white supremacy to the African American population. We contend that a corpse was not necessary to convey this message; even threats of lynching demonstrated the vulnerability of Southern blacks to the whims and aggression of their white neighbors. Most scholars have also recognized that racialized terrorism was not distributed randomly throughout the South, or across decades. And significant effort has been devoted to identifying social, economic, demographic, political, and cultural correlates of the intensity of such behavior.
On the one hand, our study should bolster confidence in the accumulated evidence regarding the most substantively important predictors of racialized terrorism. The evidence strongly supports previous conclusions regarding the roles of agricultural specialty, political party strength, and local racial composition in shaping the local propensity for mob violence. The robustness of these conclusions helps to establish a more solid foundation for future research into the contextual antecedents of racialized terrorism.
On the other hand, the differences we observed between the results from our analysis of completed lynchings and total racialized terrorism, as well as those between the models for completed lynchings and threatened lynching threats, identify potentially fruitful directions for future research. More generally, by introducing the potentially important role of lynching threats as a component of total racialized violence, we have complicated—conceptually, substantively, and methodologically—the study of Southern racial violence. Future research would do well to not ignore these additional complexities.
Incidents of threatened mob violence against African Americans and incidents of lynching of African Americans, 1880–1929
Number of completed lynchings, threatened lynchings, and combined completed and threatened lynchings, 1880–1929. Incidents with at least one black victim or black target for lynching (three-year moving averages).
Descriptive statistics for all variables used in multivariate analyses. County-decades for 10 Southern states, 1880–1929.