INTRODUCTION
The challenge of maximizing farm profit by means of improving farm-grown forage production and their efficient utilization is a common goal of dairy farming systems all over the world (Chapman et al., Reference Chapman, Kenny, Beca and Johnson2008). The small-scale dairy systems (SSDS) in Mexico need to improve on-farm resource efficiency to increase milk production to remain competitive in national and international markets.
In the temperate regions of Central Mexico, the main fodder in SSDS crops is maize because it provides grain, stover and weeds to feed dairy cattle (Estrada-Flores et al., Reference Estrada-Flores, Gonzales-Ronquillo, Mould, Arriaga-Jordán and Castelán-Ortega2006); other fodder crops are oats and lucerne. Grazing grass is reported to be the cheapest feed, source of nutrients available for dairy cows (O'Neill et al., Reference O'Neill, Lewis, O'Donovan, Shalloo, Galvin, Mulligan, Boland and Delagarde2013; Peyraud and Delagarde, Reference Peyraud and Delagarde2013) and it is the fundamental component of the dairy cow diet for the majority of the dairy systems in the world (Kennedy et al., Reference Kennedy, McEvoy, Murphy and O'Donovan2009).
There are two types of grazing pasture for dairy cows in SSDS in Central Mexico: (1) native pastures communally grazed, which are considered important for farmers since they believe that these pastures are an important resource of feed that they can use without any cost, and (2) cultivated pastures (Arriaga-Jordán et al., Reference Arriaga-Jordán, Flores-Gallegos, Peña-Carmona, Albarrán-Portillo, García-Martínez, Espinoza-Ortega, González-Esquivel and Castelán-Ortega2001).
During the rainy season, native pastures communally grazing systems comprise a mixture of multispecies grasses such as legumes and weeds or they are dominated by kikuyu grass (Penisetum clandestinum) (Rayas-Amor et al., Reference Rayas-Amor, Estrada-Flores, Mould and Castelán-Ortega2012). Cultivated pastures are used either in cut-and-carry systems or in continuously grazing systems. The pastures in cut-and-carry systems are sown annually with ryegrass (Lolium multiflorum), white clover (Trifolium repens), festuca grass (Festuca arundinacea) and orchardgrass (Dactylis glomerata). The pastures in continuous grazing systems are mainly sown with perennial ryegrass (Lolium perenne) and white clover. If access to irrigation is available, this type of pasture can be grazed year-round.
It is well known that sward characteristics have a major influence on the ingestive behaviour of cattle grazing pastures (Dobos et al., Reference Dobos, Fulkerson, Sinclair and Hinch2009). Among pastures, there are large differences between the quantity and the quality of the leaf, and the nutritive value of the herbage changes from top to base, so this may influence the behaviour of grazing cows (Stobbs, Reference Stobbs1975). The leaves on the top layers of the sward are the first to be removed (Waite, Reference Waite, Worden, Sellers and Tribe1963), so the quantity and quality of the diet selected by grazing animals will depend on the intensity of defoliation.
According to O'Callaghan et al. (Reference O'Callaghan, Cripps, Downham and Murray2003), Roelofs et al. (Reference Roelofs, van Eerdenburg, Soede and Kemp2005) and Moreau et al. (2009), studies of grazing behaviour may improve the understanding of how the animals take advantage of the vegetation on offer and may enable improved management to enhance animal performance, such as reproduction and lactation. In order to develop more efficient grazing in SSDS and to improve herbage dry-matter (DM) intake, it is essential to understand how the cow grazes and how it adapts its grazing behaviour due to changes in sward condition (Dobos et al., Reference Dobos, Fulkerson, Sinclair and Hinch2009).
There has been no significant research that investigates the factors affecting grazing behaviour of dairy cows on different pasture types in SSDS. Therefore, the objectives of the current study were to determine: (1) the relationship between SH and chemical composition of four types of pastures in association with grazing behaviour (time spent grazing, ruminating and resting) and BCS of dairy cows and (2) develop predictive equations of the nutrient intake and grazing behaviour within a continued grazing system.
MATERIALS AND METHODS
Case studies
The study area was situated in the Central highlands of Mexico (19° 04′ and 19° 28′N and 99° 31′ and 99° 47′W), at an altitude of 2600 m. The climate is temperate sub-humid dominated by summer–autumn (June to October) rainfalls. The mean rainfall and mean temperature during the evaluation periods were 244.5 mm and 14.9 °C, respectively. From a total of 205 small-scale dairy farms in Toluca Valley (INEGI, 2007), 5% of the farms were randomly selected and pre-interviewed in order to take into account the willingness of the farmers to supply technical and economic information of their farms. It was verified whether or not the farmers considered milk production to be their largest single income. Only four farms agreed to take part as case studies, from which four types of pastures were evaluated (one pasture type per farm).
Pasture sampling and sward composition
Samples were collected from four different pastures: (1) RW, (2) kikuyu (KP), (3) and (4) two native pastures (NP1 and NP2, respectively); the sampling was carried from January to June 2007, six sampling months were evaluated (January, February, March, April, May, June), and each sampling process consisted of 28 days. Thirty individual samples per hectare were collected from each pasture per month (180 samples per pasture type).
The sward composition was obtained by harvesting at ground level all the herbage mass within a quadrant of 0.25 m2 which was thrown 30 times on each pasture, all samples were placed in plastic bags and taken to the laboratory for separating plant species and after species separation, the samples were dried at 100 °C until constant weight. The pastures had the following species: RW pasture: Lolium perene (53%), T. repens (29%), Pennisetum clandestinum (9%), F. arundinacea (7%) and weeds (2%); KP pasture: P. clandestinum (87%), Dactilis glomerata (5%), L. perene (5%), weeds (3%); NP1: Bouteloua gracilis (30%), Bouteloua hirsute (26%), weeds (16%), Sporobolus indicus (13%), P. clandestinum (9%), Juncus drummondii (4%), Trifolium amabile (1%), Cyperus esculentus (1%); NP2; Bulbostylis capilaris (50%), P. clandestinum (18%), J. drummondii (12%), S. indicus (8%), B. gracilis (1%), B. hirsute (1%), Eleocharis dombeyana (1%), Lupinus versicolor (1%), T. amabile (1%).
Dry matter available and sward height
The grass samples were collected with a quadrant of 0.50 m2 randomly thrown 30 times within each pasture; all standing plants within the quadrant were cut 5 cm above ground level with shears and the material was weighed, placed into plastic bags, labelled and taken to the laboratory. In the laboratory, the weight was recorded after drying the samples at 60 °C until constant weight was achieved. Afterwards, the samples were ground with a hammer mill in order to pass through a 1 mm sieve and stored at room temperature for further chemical analyses.
The dry matter availability pre- and post-grazing of each pasture type was determined by regressing SH (average of 300 measurements were made monthly) using a rising plate metre (RPM) within the 0.5 m2 quadrant against the DM harvested from the quadrant.
Chemical composition of pastures
All chemical analyses were determined in duplicate, the DM content was determined by oven-drying a sample at 105 °C for 24 h (AOAC, 1990; ID 950.01), ash was determined by ashing the sample at 550 °C for 4 h (AOAC, 1990; ID 942.05) and the OM content was calculated by difference of DM and ash content. The total nitrogen was determined by following the micro-Kjeldahl procedure, crude protein (CP) content was calculated by multiplying the total nitrogen content x 6.25 (AOAC, 1990; ID 954.01).
Neutral and acid detergent fibre (NDF and ADF), and acid detergent lignin were estimated according to the method described by Van Soest et al. (Reference Van Soest, Robertson and Lewis1991). The NDF, ADF and ADL were determined sequentially from the same subsample and expressed inclusive of residual ash. The metabolizable energy (ME) and MP content of forages were calculated according to the equations stated in AFRC (1993).
Animals, feeding and management
A total of 12 lactating cows were used for the behavioural observations, three Holstein crossbred mature cows of 497 kg (±30, SD) per pasture were identified with an ear tag for monitoring purposes throughout the evaluation. Due to variations in milk production among farms, only cows in early lactation (75±11.5 days, SD) were selected, their characteristics were multiparous Holstein crossbred cows with mean milk production of 15 L cow−1 day−1 (±5.7, SD) and the same grazing management and feeding was used for all cows at each farm.
Milking was carried out from 6:30 to 8:00 and then all cows were taken to the pasture after milking at each farm, hence the grazing period started at 8:30 am and finished at 16:30. After grazing, the cows were housed for milking from 17:00 to 18:30 and were supplemented twice a day with the same commercial compound (11.0 MJ ME kg−1 DM, 160 g kg−1 DM of CP) at a rate of 3 kg cow−1 milking−1. At night, the cows were housed and fed with 6 kg DM of oaten hay and had free access to water. The average stocking rate during the evaluation period in each farm was 3.5 cows ha−1 (±0.5, SD).
Grazing behaviour and body condition score
Three observers were trained to monitor the cows throughout by visual observations. The evaluations were carried out within three consecutive days due to grazing behaviour variation within the day.
The cows were observed during 30 min at 9:00 h after entering their paddock; on day two 30 min at 13:00 h and on day three 30 min at 16:00 h. The measured variables during the 30-min intervals were: EGT (min), bite rate (BR min−1), ruminating time (RT, min), number of chews before swallowing during RT (CW) and socializing time (SC). BCS was evaluated every month using a 5-point scale (1 to 5; Edmonson et al., Reference Edmonson, Lean, Weaver, Farver and Webster1989; Wildman et al., Reference Wildman, Jones, Wagner, Boman, Troutt and Lesch1982) by the same observer.
Organic matter intake and bite mass
Organic matter intake (OMI) was calculated from the difference between pre- and post-grazing pasture mass according to the equation (1). This procedure was carried out daily during the observation days of grazing behaviour.
 $$\begin{eqnarray}
{\rm{OMI }}\left( {{\rm{g OM/cow}}} \right) &=& \left( \left( {{\rm{pre}}\;{\rm{DM}}*\left( {{\rm{OM}}/1000} \right)} \right)\right. \nonumber\\
&&\left.- \left( {{\rm{post}}\;{\rm{DM}}*\left( {{\rm{OM}}/1000} \right)} \right) \right)*{\rm{area}}/{\rm{cows}}.
\end{eqnarray}$$
Where: OMI is OMI of herbage; pre and post DM are the pre (on offer) and post (residue) grazing pasture (kg DM ha−1) estimated with the RPM; OM is the OM content (g kg−1 DM) of pastures; area is the area of the grazed pasture (ha) and cows is the number of cows grazing each pasture. Bite mass was calculated using the following the equation (2):
 $$\begin{equation}
{\rm{BM}}\left( {{\rm{mg}}\;{\rm{OM}}/{\rm{bite}}} \right) = \left( {\left( {{\rm{OMI}}/{\rm{EGT}}} \right)/{\rm{BR}}} \right)*1000.
\end{equation}$$
Where: BM is bite mass; OMI is obtained from equation (1); EGT is effective grazing time (min), BR is bite rate (min−1).
Statistical analysis
Mean values of SH, chemical composition, OMI, bite mass and time spent grazing were analysed using a randomized block design. This research was carried out under a participatory approach in SSDS and because no replicates of pastures were available, each pasture was considered as a blocking factor, however three cows/pasture were available, and the observations were carried out over a period of six months. The general linear model was Yijk = μ + Ti + W j + e ijk; where μ = mean; Ti = month of sampling (i = 1 to 6); W j = type of pasture (j =1 to 4) and e ijk = residual error term. The OMI, bite mass and grazing behaviour variables were correlated with SH and chemical composition. Therefore, a stepwise procedure was applied for identifying a useful subset of the predictors, multiple linear regression was used for obtaining equations that predicted OMI, grazing behaviour and BCS. MINITAB (2003) was used for all statistical analyses.
RESULTS
Sward characteristics
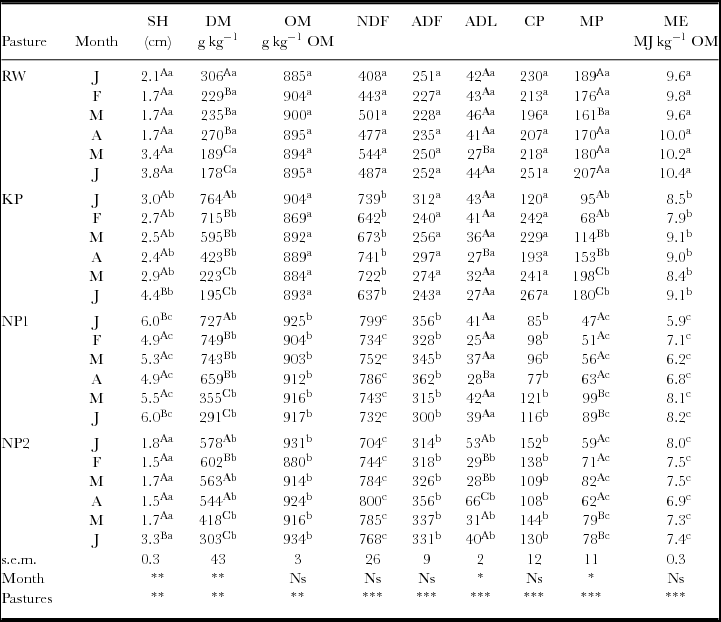
There was a significant (p < 0.01) effect due to months and pasture type on DM content (Table 1). The highest contents were observed in NP1 and NP2. The OM content (p > 0.05) was not significantly affected by month, however NP1 and NP2 had higher OM contents than RW and KP pastures.
Chemical composition of four pasture types.***

RW= ryegrass–white clover; KP= kikuyu pasture; NP1 and NP2= native pasture 1 and 2, respectively; SH= sward height; DM= dry matter; OM= organic matter; NDF= neutral detergent fibre; ADF= acid detergent fibre; CP= crude protein; MP= metabolizable protein; ME= metabolizable energy. Different upper-case superscripts indicate significant differences among months (*= p < 0.05; **= p < 0.01). Different lower-case superscripts indicate significant differences among pastures (***= p < 0.001). Ns= not significant (p > 0.05).
The NDF and ADF content were not significantly different in RW and KP pastures but were different (p < 0.001) for NP1 and NP2, these two pastures had a high content of NDF and ADF throughout the months of evaluation.
The CP content of RW and KP did not differ significantly (p < 0.05), but these two pastures were significantly (p < 0.001) different to NP1 and NP2. It is important to notice that the highest CP contents were observed during June in RW and KP while in NP1 and NP2 were present in May and March, respectively.
There were significant (p < 0.05) differences in SH and MP due to month and pasture types (p < 0.001). The RW pasture showed the highest content of MP and ME followed by KP, these two pastures were significantly different (p < 0.001) from NP1 and NP2 as these two showed the lowest nutrient contents, however NP1 presented the highest values of SH in all periods.
Grazing behaviour
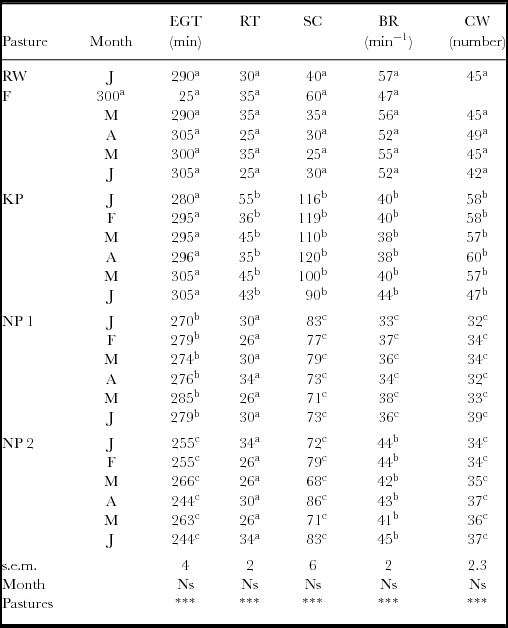
Grazing behaviour was significantly (p < 0.001) different due to month and pasture type (Table 2). There was no significant (p > 0.05) effect due to periods on EGT, but there was a slight increase in RW, KP and NP1 from April to June and the lowest EGT was observed when cows grazed NP2.
Behaviour of cows grazing four pasture types.

RW= ryegrass–white clover; KP= kikuyu pasture; NP1 and NP2= native pasture 1 and 2, respectively; EGT= effective grazing time; RT= ruminating time; BR= bite rate; SC= socializing time; CW= the number of chewing before swallowing during ruminating time. Different lower-case superscripts indicate significant differences among pastures (***= p < 0.001). Ns= not significant (p > 0.05).
There was a significant (p < 0.001) effect due to KP on ruminating, chewing and socializing times than for RW, NP1 and NP2. However, the highest BR was for RW, followed by KP and NP2. The lowest values for these behavioural variables were observed for NP1.
Body condition score
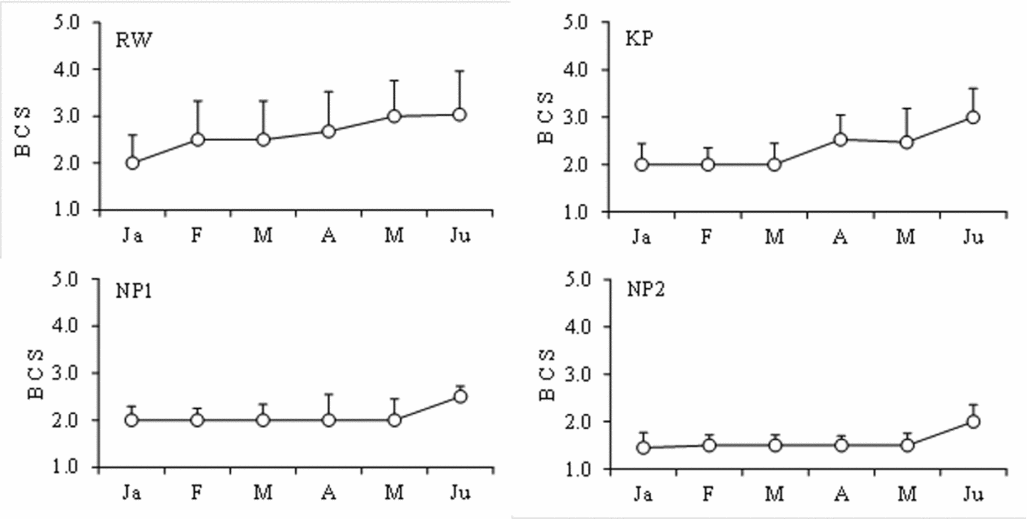
Figure 1 shows the BCS across the grazing periods in each pasture type. Cows grazing RW showed one-point increase from January to June while the same increment was observed from March to June in KP pasture. It is observed that BCS in NP1 and NP2 did not change from January to May and the lowest values of BCS were observed in NP2.
Body condition score (based on 5-point scale) of dairy cows grazing four pasture types from January to June. RW= ryegrass–white clover; KP= kikuyu pasture; NP1 and NP2= native pasture 1 and 2, respectively. Bars= (SD). Ja= January; F= February; M= March; A= April; M= May; Ju= June.

Nutrient intake
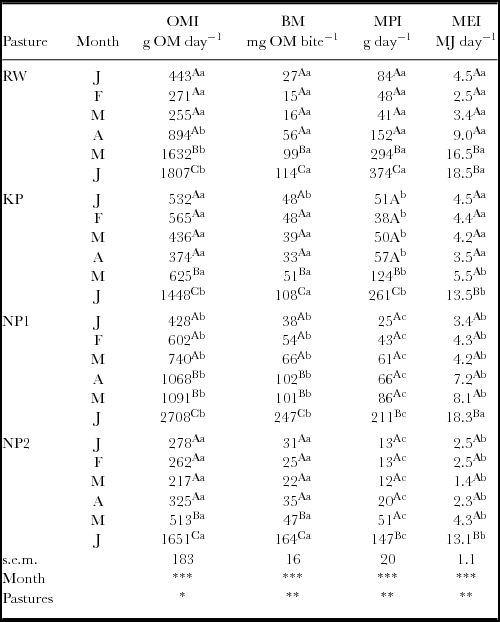
The OMI, MPI, MEI and BM for each pasture type and month are shown in Table 3. There were significant (p < 0.05) differences due to month and pasture type for these variables. There was an increase from January to June; NP2 and RW pastures showed high values of OMI and BM, mainly during the month of June. In this period of time, NP1 had higher BM compared to that of RW and KP pastures.
Organic matter intake, bite mass, metabolizable protein intake and metabolizable energy intake of cows grazing four pasture types.

RW= ryegrass–white clover; KP= kikuyu pasture; NP1 and NP2= native pasture 1 and 2, respectively; OMI= organic matter intake; BM= bite mass; MPI and MEI= metabolizable protein and metabolizable energy intake, respectively; Different upper-case superscripts indicate significant differences among months (***= p < 0.001). Different lower-case superscripts indicate significant differences among pastures (*= p < 0.05; **= p < 0.01). Ns= not significant (p > 0.05).
There was a significant (p < 0.01) increase in MPI from January to June, with RW having the highest values each month. The MEI for RW was significantly (p < 0.01) higher for May and June (Table 3).
Relationships among nutrient intake, grazing behaviour and BCS
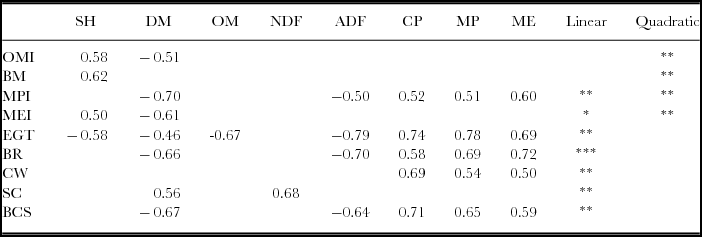
The relationship between OMI, BM, MPI and MEI, grazing behaviour, BCS, SH and chemical composition of pastures is presented in Table 4. SH was positively related with OMI, BM and MEI indicating that the higher the SH, the higher the MEI. However, the DM content negatively affected OMI, MPI MEI and for these relationships, a quadratic effect was observed (Table 4).
Correlation between OMI, MPI, MEI, BCS, grazing behaviour and SH and chemical composition.

OMI= organic matter intake (g OM cow−1); BM= bite mass (mg OM bite−1); MPI and MEI= metabolizable protein and metabolizable energy intake (g day−1 and MJ day−1), respectively; EGT (min)= effective grazing time; BR=Bite rate (min−1); CW= number of chewing before swallowing during ruminating time; SC= Socializing time (min); SH: sward height (cm); DM= dry matter (g kg−1), OM= organic matter (g kg−1 DM), NDF= neutral detergent fibre (g kg−1 OM), ADF= acid detergent fibre (g kg−1 OM); CP= crude protein (g kg−1 OM); MP= metabolizable protein (g kg−1 OM); ME= metabolizable energy (MJ kg−1 OM); *= p < 0.05; **= p < 0.01; ***= p < 0.001.
The EGT and BR were negatively associated with SH, DM, OM and ADF content, the strongest negative association was observed in DM and ADF content. However, MP content had a positive strong association with EGT while ME content was strongly associated with BR. The chews variable (number of chewing before swallowing during RT) was positively associated with CP, MP and ME content, which was unexpected.
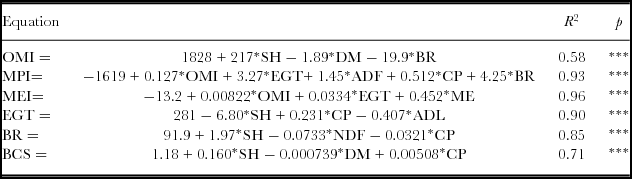
There was a good relationship between MEI, MPI, EGT and BR with their predictors (0.85 < R2 < 0.96). However, OMI and BCS were not related strongly with SH, DM, BR and SH, DM CP, respectively (Table 5).
Multiple linear regressions for estimating OMI, MPI, MEI, EGT, BR and BCS from SH and chemical composition.

OMI= organic matter intake (g OM cow−1); MPI and MEI= metabolizable protein and metabolizable energy intake (g day−1 and MJ day−1), respectively; EGT (min)= effective grazing time; Bite rate (min−1); BCS= body condition score; SH= sward height; DM= dry matter; ADF= acid detergent fibre; CP= crude protein; ME= metabolizable energy; *** = p < 0.001.
DISCUSSION
Sward characteristics influence the ingestive behaviour of cattle significantly. Therefore, to develop more efficient grazing systems in small-scale dairy operations and improve the intake of OM, we investigated how the cow utilizes the pasture and how it adapts its grazing behaviour to changes in sward characteristics. This was achieved by assessing the relationship between SH and chemical composition of four pasture types (unreplicated) and developing predictive equations of nutrient intake and grazing behaviour.
Effects of sward height on nutrient intake
A significant (p < 0.01) quadratic effect in the relationship between BM and SH was observed and this is similar to the observations of Mezzalira et al. (Reference Mezzalira, De Faccio, Fonseca, Bremm, Cangiano, Leandro and Laca2014). Nevertheless, the strength of the relationship between BM and SH (Table 4) could be considered weak.
A high OMI for NP2 does not necessarily mean a high nutrient intake, because individual intake is high when grazing occurs on tallest swards, but if animals are offered much more herbage than they are able to consume, much of this will decay and be wasted, reducing the ME content (Parsons and Chapman, Reference Parsons, Chapman and Hopkins2000). We found that although RW showed lower OMI than NP2, the average of MPI and MEI across the months was higher (165 g day−1; 8.8 MJ day−1, respectively) than NP2 (82 g day−1; 7.7 MJ day−1), KP (96 g day−1; 5.6 MJ day−1) and NP1 (43 g day−1; 4.1 MJ day−1). This can be explained by the low SH in RW, the shortest SH achieved high herbage utilization and nutrient intakes per hectare, and this may lead to higher tiller density and ME (Brockman and Wilkins, Reference Brockman, Wilkins and Soffe2003; Peyraud and Delagarde, Reference Peyraud and Delagarde2013; Pulido and Leaver, Reference Pulido and Leaver2001) but it may also have decreased the individual intake of animals (Parsons and Chapman, Reference Parsons, Chapman and Hopkins2000).
Effects of sward height on effective grazing time and bite rate
According to Forbes and Hodgson (Reference Forbes and Hodgson1985), grazing time is regulated by pasture availability and increases as SH decreases in order to compensate for lower bite mass. However, the quality of the sward is a factor that may explain the more intensive grazing activities of cows (Orr et al., Reference Orr, Penning, Harvey and Champion1997; Valentine, Reference Vallentine2001).
The EGT was greater on RW than on the other three pastures, however, cows on RW and KP pastures grazed for 62% of the total access time (480 min), which is similar to the one reported by Ferreira et al. (Reference Ferreira, Celaya, Benavides, Jáuregui, García, Santos, García, Rodríguez and Osoro2013) and Pérez-Ramírez et al. (Reference Pérez-Ramírez, Delagarde and Delaby2008), where proportion of time spent grazing was 68% during 480 min; for NP1 and NP2 the cows grazed 58% and 53% of the total access time, respectively. That is, the cows on NP2 grazed 14.3 min less for each centimetre of height above the average for RW.
The RW and NP2 presented similar SH throughout the evaluation periods, nevertheless, BR in NP2 was lower due to a negative association between BR and ADF (Table 4). Animals that grazed a high-quality spring–summer pasture (RW, up to 10 MJ kg−1 OM of ME and 207g kg−1 OM of MP) showed higher EGT and BR than animals grazing on NP2 from January to June.
It is important to consider that cows on NP1 had the highest BM mainly between April and June and was associated with sward depth, which is a constant proportion of SH, thus increasing with SH (Mezzalira et al., Reference Mezzalira, De Faccio, Fonseca, Bremm, Cangiano, Leandro and Laca2014). However, MEI and MPI were low in this current study (Table 3) because of a low mean ME and MP over the study period (7 MJ kg−1 OM and 72 g kg−1 OM, respectively).
Effects of chemical composition of swards on body condition score of cows
Maximizing dairy cow performance from grazed pasture remains a key objective in the pasture-based systems of dairy production (Kennedy et al., Reference Kennedy, McEvoy, Murphy and O'Donovan2009). As BCS is an indicator of cow performance, we found in this current study that cows grazing on RW increased their BCS over the study period, followed by KP. BCS of cows on these two pasture types were significantly (p < 0.01) different to those cows grazing NP1 and NP2 (see Figure 1). These differences may be associated with variations in pasture quantity and quality (Roche et al., Reference Roche, Friggens, Kay, Fisher, Stafford and Berry2009). The quantity of herbage consumed by grazing animals is normally regulated by grazing time, biting rate and intake per bite (Holmes, Reference Holmes and Jarrige1989). Therefore, all these factors can influence herbage intake while grazing.
Grazing animals are attracted to zones where more plants are found and where the quality of the sward is higher, to maintain nutrient intake (Vallentine, Reference Vallentine2001). Non-structural carbohydrates are an indicator of forage quality, which may either regulate BCS (Gearhart et al., Reference Gearhart, Curtis, Erb, Smith, Sniffen, Chase and Cooper1990) or DMI, and may also regulate deposition of adipose tissue (Roche et al., Reference Roche, Friggens, Kay, Fisher, Stafford and Berry2009). Even though in this current study non-structural carbohydrates were not determined, it is well known that perennial ryegrass accumulates high levels of non-structural carbohydrates, particularly water soluble carbohydrates in the leaves, sheath and stems during vegetative growth under defoliation conditions (Trethewey and Rolston, Reference Trethewey and Rolston2009). Therefore, this may explain the result that cows grazing RW exhibited higher BCS than animals grazing NP1 and NP2 which had lower digestibility and higher fibre content.
CONCLUSION
This current study is the first research attempt to quantify grazing behaviour of dairy cows on SSDS in Mexico. Although there was no pasture replications because of limitations, the results suggest that pasture type and SH could influence grazing behaviour and BCS of dairy cows during the dry season.
SH negatively affected EGT, but it promoted OMI and ME. The contents of ME and MP of pastures stimulated EGT, BR, MPI and BCS. Therefore, RW showed higher EGT, BR, nutrients intake and BCS than the other three pastures, suggesting that cultivated pastures that appear to be more expensive in SSDS could result in an increased cow performance if managed correctly. Additionally, the results of this current study allowed to develop equations for predicting nutrient intake from sward characteristics and chemical composition of pastures; however, further testing at field level is required.
Acknowledgements
This work was supported by the CONSEJO NACIONAL DE CIENCIA Y TECNOLOGÍA, MÉXICO.