I. INTRODUCTION
Electric fatigue has been an ongoing research topic in ferroelectric communities for several decades due to the technological importance and extensive application of ferroelectric-based devices such as nonvolatile memories, field-effect transistors, ferroelectric tunneling junctions, transducers, and actuators.Reference Lupascu1–Reference Kim, Hong, Streiffer and Kingon8 A fingerprint of electric fatigue in ferroelectric oxides is the degradation of their functionality (e.g., switchable polarization) during repetitive polarization switching.Reference Tagantsev, Stolichnov, Colla and Setter9,Reference Lou10 It has severely hindered the long-term operation and reliability of ferroelectric materials. Throughout the past half-century, a large body of experimental and theoretical studies has been conducted to investigate the origin of electric fatigue.Reference Lupascu1,Reference Tagantsev, Stolichnov, Colla and Setter9,Reference Lou10 Several phenomenological scenarios and microscopic mechanisms have been proposed such as electrode degradation,Reference Tagantsev, Stolichnov, Colla and Setter9 near-electrode passive layer formation,Reference Larsen, Dormans, Taylor and van Veldhoven11 nucleation inhibition,Reference Colla, Tagantsev, Taylor and Kholkin12 domain wall pinning,Reference Warren, Dimos, Tuttle, Pike, Schwartz, Clews and McIntyre13 and local phase decomposition.Reference Lou, Zhang, Redfern and Scott14 However, a consensus has not been reached due to the complex nature of the fatigue process.Reference Lupascu1,Reference Tagantsev, Stolichnov, Colla and Setter9
As is well known, the polarization state and polarization switching in ferroelectric crystals are intrinsically linked to ferroelectric domain arrangements and their transformations. Essentially, ferroelectric domains dictate the dielectric, piezoelectric, and ferroelectric properties for ferroelectric crystals. Thus, direct imaging of domain evolution during electric cycling is critical to elucidate the underlying mechanisms for electric fatigue. Unfortunately, a vast majority of previous fatigue studies have mainly focused on macroscopic property measurements without microscopic pictures.Reference Tagantsev, Stolichnov, Colla and Setter9,Reference Lou10,Reference Kim, Kim, Hong, Streiffer and Kingon15,Reference Shannigrahi, Lee and Jang16 Until now, very limited techniques, such as piezoresponse force microscopy (PFM)Reference Zou, You, Chen, Ding, Wu, Wu, Chen and Wang17–Reference Tsurekawa, Hatao, Takahashi and Morizono23 and x-ray microdiffraction,Reference Do, Evans, Isaacs, Kim, Eom and Dufresne24 were developed to provide microscopic insight for electric fatigue. However, the application of these probing tools is still restricted by technical challenges. For example, PFM only recorded top morphology change during fatigue and was not able to monitor crystal structure evolutions.Reference Zou, You, Chen, Ding, Wu, Wu, Chen and Wang17–Reference Tsurekawa, Hatao, Takahashi and Morizono23 It is now understood that both macroscopic properties and microscopic morphologies are significantly influenced by structural phase transitions.Reference Guo, Zhang, Beckman and Tan25–Reference Qu, Zhao and Tan30 For x-ray microdiffraction, high spatial resolution is still not approachable when the length scale is reduced to individual grain level and multidomain structures are presented within. To circumvent these technical hindrances effectively and obtain a comprehensive understanding of electric fatigue from a microscopic viewpoint, electric field in situ transmission electron microscopy (TEM)Reference Tan, He and Shang31–Reference Tan, Xu, Shang and Han35 is used and extended by applying an AC electric field in this study.
The in situ TEM technique has been demonstrated to be a powerful probing tool for investigating microstructural origins of functionality (e.g., the piezoelectricity) evolution under electric field.Reference Guo, Zhang, Beckman and Tan25–Reference Qu, Zhao and Tan30 Domain morphology transformations over a length scale from micrometers to nanometers can be effectively recorded due to its high resolution. Simultaneously, crystal structures evolution can also be monitored by electron diffraction patterns, especially when phase variants are inferred by superlattice diffractions.Reference Guo, Zhang, Beckman and Tan25,Reference Ma, Guo, Beckman and Tan27 Our previous in situ TEM studies have focused on the microstructural response to the DC electric field.Reference Guo, Zhang, Beckman and Tan25–Reference Qu, Zhao and Tan30 Here, microstructures evolution during a bipolar fatigue process was directly visualized using an electric field in situ TEM technique. Polycrystalline 0.7Pb(Mg1/3Nb2/3)O3–0.3PbTiO3 (0.7PMN-0.3PT) ceramic was used for the demonstration. In situ observations combined with dielectric, piezoelectric, and ferroelectric properties measurements on bulk specimens eventually allow for elucidation of the underlying mechanism for electric fatigue in 0.7PMN-0.3PT.
II. EXPERIMENTAL
A. Ceramic preparation
The 0.7Pb(Mg1/3Nb2/3)O3–0.3PbTiO3 ceramic (TRS Ceramics, State College, PA) was synthesized through the columbite precursor method.Reference Wang, Jiang, Shrout and Cao36 MgNb2O6 was prepared by the reaction MgO + Nb2O5 → MgNb2O6 at 1200 °C for 4 h. After dry-milling and passing through 100 mesh sieve, the columbite powder slurry was further milled with a high-energy attritor-mill for 6 h. Then, PbCO3 and TiO2 were added to the columbite powder and vibratory-milled for 18 h. The mixture was dried and then calcined at 700 °C for 4 h. This powder was ground and passed through 80 mesh, then attritor-milled for 8 h. With acrylic resin as a binder, the calcined powder was biaxially pressed into 76 mm × 50 mm × 50 mm blocks. The green bodies were sintered at 1250 °C for 3 h in alumina crucibles with PbZrO3 source powder to maintain a PbO atmosphere. After sintering, the blocks were hot isostatically pressed at 1150 °C for 2 h in an O2/Ar atmosphere.
B. Fatigue measurements on bulk specimen
The fatigue experiment was performed on bulk specimen by applying a bipolar triangular waveform with a frequency of 2 Hz and a peak field of 20 kV/cm. Silver films were sputtered to serve as electrodes. Macroscopic properties were measured for various cycling intervals. For ferroelectric characterizations, the polarization (P) versus electric field (E) hysteresis loops were measured using a standardized ferroelectric test system (RT-66A, Radiant Technologies, Albuquerque, NM) at 4 Hz at room temperature. The polarization current density J was determined by taking the derivative of polarization with respect to time, i.e., dP(t)/dt. For piezoelectric measurements, the piezoelectric coefficient d 33 was measured by a piezo-d 33 meter (Model ZJ-4B, Institute of Acoustics, Chinese Academy of Science, China) to take 10 measurements across the electrode of the sample. The room temperature dielectric constant was measured using an LCR meter (HP-4284A, Hewlett-Packard, Palo Alto, CA) at a frequency of 1 kHz.
C. In situ TEM study
For electric field in situ TEM experiments, disk specimens (3 mm in diameter) were prepared from ceramic pellets through standard procedures including grinding, cutting, dimpling, and ion milling. The dimpled disks were annealed at 300 °C for 2 h to minimize the residual stresses before Ar-ion milling to the point of electron transparency. In situ TEM experiments were carried out on a Philips CM-30 microscope (Philips, Amsterdam, Holland) operated at 200 kV. The detailed experimental setup can be found in our previous reports.Reference Tan, He and Shang31–Reference Tan, Xu, Shang and Han35 After the initial poling process (a DC field applied at the very first quarter cycle) from its virgin state, a bipolar cycling with a frequency of 10 Hz and a peak field of 10 kV/cm was applied. TEM micrographs were recorded at zero field after certain cycles were made. In this study, only the nominal electric field (the applied voltage divided by the electrode spacing) is cited for the in situ TEM results. However, it should be noted that the TEM specimen has a central perforation which intensifies the actual field in the target grains.Reference Tan, He and Shang31,Reference McMeeking37 In the present case, an intensification ratio of 2 is considered for the actual field strength due to the circular-shaped geometry of the perforation.Reference Tan, He and Shang31,Reference McMeeking37 Therefore, for the fatigue measurements mentioned in Sec. II. B on bulk specimens, an amplitude of 20 kV/cm was applied during the bipolar electric cycling.
III. RESULTS AND DISCUSSION
A. Domain morphology in the virgin state
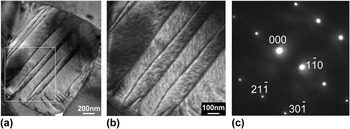
The crystalline solution (1−x)PMN-xPT is known to have a systematic domain structure evolution when the phase variant evolves with PbTiO3 content.Reference Viehland, Li and Colla38–Reference Wu, Xue, Lv, Gao, Guo, Zhou, Ding, Zhou, Yang, Yang and Ren40 For tetragonal phase compositions (x > 0.35), normal micrometer-sized lamellar domains were observedReference Viehland, Li and Colla38–Reference Wu, Xue, Lv, Gao, Guo, Zhou, Ding, Zhou, Yang, Yang and Ren40; whereas for rhombohedral phase compositions (x ∼0.25–0.3), miniaturized polar nanodomains were found to form spindle-like domain features.Reference Bai, Li and Viehland39,Reference Wu, Xue, Lv, Gao, Guo, Zhou, Ding, Zhou, Yang, Yang and Ren40 Between these two (x ∼0.3–0.35), a morphotropic phase boundary (MPB) with a monoclinic phase was present to bridge the tetragonal and rhombohedral structures.Reference Viehland, Li and Colla38,Reference Bai, Li and Viehland39,Reference Noheda, Cox, Shirane, Gao and Ye41,Reference Wang, Zhu, Lu, Bokov, Ye and Zhang42 Correspondingly, a hierarchical domain pattern with the micrometer-sized lamellar-type consisting of cross-hatched nanodomains inside was adopted.Reference Viehland, Li and Colla38,Reference Bai, Li and Viehland39,Reference Wang, Zhu, Lu, Bokov, Ye and Zhang42–Reference Kurushima, Kobayashi and Mori44 This typical domain configuration was commonly observed for both single crystals and polycrystalline ceramics at, or in the vicinity of the MPB.Reference Viehland, Li and Colla38–Reference Wu, Xue, Lv, Gao, Guo, Zhou, Ding, Zhou, Yang, Yang and Ren40,Reference Wang, Zhu, Lu, Bokov, Ye and Zhang42–Reference Kurushima, Kobayashi and Mori44 In the present study, a consistent observation was also obtained in the 0.7PMN-0.3PT polycrystalline ceramic. As shown in Fig. 1, for a representative grain along its [113] zone axis in the virgin state 0.7PMN-0.3PT ceramic, the typical hierarchy domain feature was clearly demonstrated: the micrometer-sized  $\left( {1\bar 10} \right)$ lamellar domains were manifested with two traces of tweed-like nanodomains coexisting inside. These nanodomains were found roughly along two
 $\left\langle {30\bar 1} \right\rangle$ directions, and crosshatched with each other to form a substructure.
(a) Bright-field micrograph of a representative grain along its [113] zone axis in the virgin state of 0.7PMN-0.3PT ceramic. (b) Higher magnification image of the boxed area in (a) to show the hierarchical domain structure. (c) The corresponding selected area diffraction pattern.

B. Domain morphology evolution during fatigue
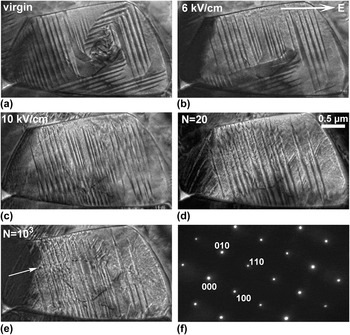
Microstructure evolution under electric process in 0.7PMN-0.3PT ceramic is exemplified in Fig. 2 by a [001]-aligned grain. Prior to the cycling, the domain morphology evolution during the first quarter cycle (referred to as “initial poling” hereafter) was initially shown in Figs. 2(a)–2(c). In the virgin state [Fig. 2(a)], two sets of orthogonal lamellar domains were clearly observed and found parallel to the {110} planes. Inside these micrometer-sized domains, nanodomains were also manifested. However, they became nearly invisible due to their extremely weak contrast at lower magnifications, as can be seen in Fig. 1(a). When the electric field reached 6 kV/cm, apparent domain switching was noted. Some portions of the  $\left( {\bar 110} \right)$ domains were consumed by the other set of (110) domains. Further increasing the electric field to 10 kV/cm facilitated the consummation process, and finally the entire grain was occupied by the (110) domains. In addition, large domain mixed with thin domain striations were also formed at the far left side of the grain during this domain alignment process. Domain evolution during initial poling was found to be irreversible. The configuration of the poled state remained unchanged upon removal of the poling field.
In situ TEM observations of a grain along its [001] zone axis in a 0.7PMN-0.3PT specimen during initial poling and bipolar electric reversals. Bright-field micrographs at (a) virgin state, (b) 6 kV/cm, and (c) 10 kV/cm during initial poling; (d) after 20 cycles and (e) after 103 cycles of bipolar cycling with a nominal amplitude of 10 kV/cm. The produced defects after 103 cycles are marked roughly along the direction of the bright arrow shown in (e). The selected area diffraction pattern recorded at the virgin state is shown in (f). The positive direction of applied fields in the TEM experiment is indicated by the bright arrow in (b). No apparent changes in the electron diffraction pattern are noticed during initial poling and fatigue process.

Electric reversals were then carried out by repetitively applying bipolar cycles at a nominal amplitude of 10 kV/cm. It is interesting to note that after 20 cycles a substructure with nanometer-sized domain traces developed within the lamellar domains and formed a herringbone type of domain configuration [Fig. 2(d)]. Those confined short domains appeared to have domain walls along (010) and (100) planes. Also, the far left part of this grain split into a cluster of [010]-aligned thin domain strings. Upon further cycling, domain switching proceeded. As shown in Fig. 2(e), for the end-state after 103 cycles some portion of nanodomain traces disappeared, but still with some portion preserved and mixed with lamellar domains. Additionally, some newly formed defects were observed, as roughly aligned along the bright arrow indicated in Fig. 2(e). It has been known that structural imperfections are generated in fatigued ferroelectrics.Reference Dawber and Scott45–Reference Chou, Hou and Pan48 For the defects in Fig. 2(e), they might be oxygen vacancy clustersReference Dawber and Scott45,Reference Lupascu and Rabe46 or dislocations.Reference Chou, Hou and Yeh47,Reference Chou, Hou and Pan48 After 103 cycles, nearly all the domains became incapable of switching with further cycling, leading to a frozen configuration after fatigue. In addition to these immobilized domains, some inhibited small domains seem to have appeared at the grain boundary in the lower part in Fig. 2(e). On the other hand, the crystal structure was also monitored by the electron diffraction pattern during the initial poling and fatigue process. No noticeable changes were found compared with the virgin state pattern [Fig. 2(f)].
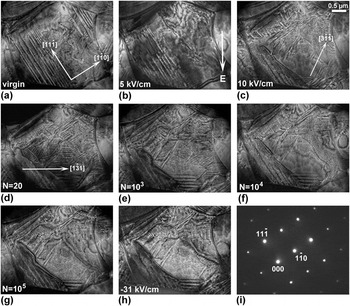
Fatigue-induced domain freezing under the influence of electric reversals in 0.7PMN-0.3PT was reproducibly observed, as shown by another grain along its [112] zone axis in the same TEM specimen (Fig. 3). The first three micrographs [Figs. 3(a)–3(c)] still show microstructural evolution during initial poling. In the virgin state [Fig. 3(a)], in addition to the tweed-like fine domain clusters, micrometer-sized lamellar domains lying on the  $\left( {1\bar 10} \right)$ crystallographic planes were observed. When the electric field was increased to 5 kV/cm, the large lamellar domains at the upper-right corner were transformed into thin-aligned striation-like domains with traces along the
 $\left[ {1\bar 10} \right]$ direction [Fig. 3(b)]. At 10 kV/cm, the domain striations became predominant, as manifested by the disappearance of the large lamellar domains and the occurrence of another set of
 $\left[ {3\bar 1\bar 1} \right]$-aligned fine traces [Fig. 3(c)]. During the fatigue process, an apparent alteration of domain morphology was observed before 103 cycles. As exemplified in Fig. 3(d), a significant portion of
 $\left[ {1\bar 31} \right]$-aligned domain striations were induced after 20 cycles, leading to a condensed domain configuration for the entire grain. When the cycling numbers increased to 103, most of the well-defined domain striations were gradually transformed into fine domain traces and large domain areas [Fig. 3(e)]. With further increase of electric reversals, most of the domains were found inactive to the electric stimulus; the switching ability of the domains was substantially impeded. Only minor switching was noticed after 104 cycles [Fig. 3(f)], and eventually the grain was dominated by an immobilized domain configuration [Fig. 3(g)]. The frozen domain morphology remained even when a much higher DC field of −31 kV/cm was applied [Fig. 3(h)]. Again, the electron diffraction pattern of the virgin state [Fig. 3(i)] stayed unchanged during the initial poling and fatigue process.
In situ TEM observations of another grain along its [112] zone axis in the same 0.7PMN-0.3PT specimen during initial poling and electric reversals. Bright-field micrographs at (a) virgin state, (b) 5 kV/cm, and (c) 10 kV/cm during initial poling; (d) after 20 cycles, (e) after 103 cycles, (f) after 104 cycles, and (g) after 105 cycles during fatigue. After fatigue, the grain shown in (g) was further stressed at −31 kV/cm, as displayed in (h). The selected area diffraction pattern recorded at the virgin state is shown in (i). The positive direction of applied fields in the TEM experiment is indicated by the bright arrow in (b). No apparent changes in the electron diffraction pattern are noticed during initial poling and fatigue process.

C. Impact on macroscopic properties
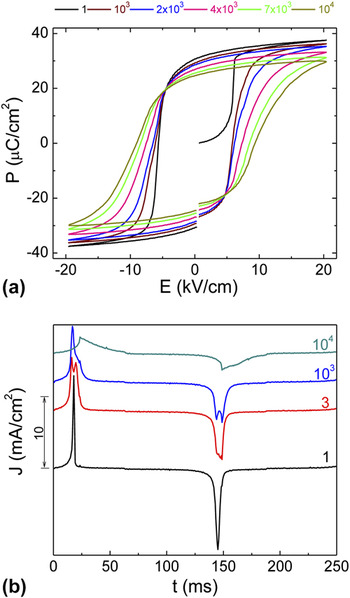
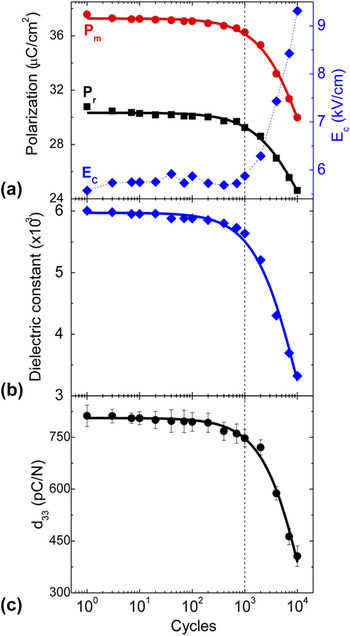
To correlate the fatigue-induced microstructural evolution to macroscopic properties, measurements on dielectric, piezoelectric, and ferroelectric properties were carried out on bulk ceramic specimen. A well-illustrated structure–property relationship was established. As shown in Figs. 4 and 5, a degradation of dielectric, piezoelectric, and ferroelectric properties was manifested, which was similar to the fatigue behavior of lead-based thin films, as reported in previous literature.Reference Lee, Thio and Desu49–Reference Colla, Kholkin, Taylor, Tagantsev, Brooks and Setter52
(a) Change of the polarization hysteresis loop and (b) polarization current density curves during electric fatigue in 0.7PMN-0.3PT bulk ceramic.

(a) Polarization and coercive field, (b) dielectric constant, and (c) piezoelectric coefficient as a function of cycling number measured from the same bulk specimen as in Fig. 4. The experimentally measured results are shown as discrete points, while the solid fitting curves are derived using the power-law relation. The fitting equations are shown in the text.

Figure 4 depicted the polarization hysteresis and corresponding polarization current density evolutions during fatigue. As can be seen, an apparent fatigue behavior was manifested by a reduction of remnant polarization (P r) as well as an increase in coercive field (E C) upon electric reversals [Fig. 4(a)], while corresponding polarization current density (J) peaks became lower and broadened [Fig. 4(b)]. Moreover, splitting of the current density peaks was found during the fatigue process.Reference Thompson, Munkholm, Streiffer, Stephenson, Ghosh, Eastman, Auciello, Bai, Lee and Eom53,Reference Schloss and Mclntyre54 It is interesting to notice that electric reversal from the virgin state (N = 1) has only one very sharp and narrow current density peak, suggesting a direct 180° reversal at the very first cycle. After that, doublets were seen on the two peaks (see cycle 3 and 103 curves). This may suggest that the polarization reversal occurred through a multistep process.Reference Baek, Folkman, Park, Lee, Bark, Tybell and Eom19,Reference Kubel and Schmid55–Reference Kitanaka, Yanai, Noguchi, Miyayama, Kagawa, Moriyoshi and Kuroiwa60 Further cycling smeared out the doublets and broadened the two peaks. This appears to indicate that the reversal process takes place within a wide field range due to severe domain freezing.
Generally, the degradation of remnant polarization (P r) and maximum polarization (P m) is an indication of electric fatigue in ferroelectric properties.Reference Tagantsev, Stolichnov, Colla and Setter9,Reference Lou10 Both of them describe the amount of domains that can be effectively switched under electric field. However, the coercive field is usually used to characterize how difficult domain switching becomes when electric field direction is reversed. As summarized in Fig. 5(a), both polarization and coercive field followed a plateau trend and changed slightly before 103 cycles. Remarkable polarization decay was observed thereafter, accompanied by a bump up of the coercive field. Quantitatively, P m and P r showed a similar degradation to 79.8% and 80.0% of their original values after 104 cycles, respectively, whereas E C increased to 167.1% of its initial value. For dielectric and piezoelectric properties, as characterized by dielectric constant (εr) and piezoelectric coefficient (d 33), the overall evolution followed the same reduction trend as the polarization: the dielectric constant and piezoelectric coefficient remained 93.8% and 92.0% of their original values after 103 cycles, respectively, but significantly dropped to 55.3% and 50.0% after 104 cycles.
For classic ferroelectrics, such as Pb(Zr,Ti)O3 and BiFeO3, the fatigue behavior usually exhibits a nonlinear decay by plotting remnant polarization with respect to logarithm of electric reversals.Reference Lou10 Obtained fatigue profiles are generally fitted by functions like P r ∝ N −1/4, P r ∝ (aN + 1)−m, or P r ∝ A + exp(−aN).Reference Tagantsev, Stolichnov, Colla and Setter9,Reference Shur, Akhmatkhanov and Baturin61 Typically, a plateau stage of slow reduction is initially observed, followed by a sharp decay and subsequent logarithmic stage.Reference Lou10 In this study, a similar fatigue behavior was also observed, as demonstrated by a stable stage within the initial 103 cycles and a fast decay stage thereafter. These macroscopic behaviors were well correlated to the in situ TEM observations, where the domains remained actively switched within the initial 103 cycles and were progressively frozen thereafter. The degradation profile for the macroscopic properties can be well fitted by the power-law P r ∝ (aN + 1)−m relation.Reference Tagantsev, Stolichnov, Colla and Setter9,Reference Shur, Akhmatkhanov and Baturin61 The fitting curves (solid lines in Fig. 5) are shown as the following, where P r0, P m0, d 0, and εr0 are parameters of denoting the unfatigued state; N is the cycle number; a is the fitting constant; and m is the decay constant which characterizes the speed of the fatigue.
 $${P_{\rm{r}}}(N) = {P_{{\rm{r}}0}}{\left( {aN + 1} \right)^{ - {\rm{m}}}}\quad {\rm{,}}$$
with P r0 = 30.330 µC/cm2, a = 2.067 × 10⁻⁴, and m = 0.188.
 $${P_{\rm{m}}}(N) = {P_{{\rm{m}}0}}{(aN + 1)^{ - {\rm{m}}}}\quad {\rm{,}}$$
with P m0 = 37.274 µC/cm2, a = 1.164 × 10⁻⁴, and m = 0.286.
 $${d_{33}}(N) = {d_0}{(aN + 1)^{ - {\rm{m}}}}\quad {\rm{,}}$$
with d 0 = 805.928 pC/N, a = 1.184 × 10⁻⁵, and m = 6.517.
 $${\varepsilon _{\rm{r}}}(N) = {\varepsilon _{{\rm{r}}0}}{(aN + 1)^{ - {\rm{m}}}}\quad {\rm{,}}$$
with εr0 = 5972.600, a = 8.448 × 10⁻⁵, and m = 0.999.
D. Discussion
It has been shown that electric fatigue in ferroelectric oxides is a complicated process, and both intrinsic and extrinsic contributions devote to the reduction of switchable polarization.Reference Lupascu1,Reference Tagantsev, Stolichnov, Colla and Setter9,Reference Lou10 During the past several decades of intensive studies, various models have been proposed, for example, electrode degradation, passive layer formation, domain wall pinning, and seed inhibition.Reference Lupascu1,Reference Tagantsev, Stolichnov, Colla and Setter9,Reference Lou10 According to Tagantsev et al.,Reference Tagantsev, Stolichnov, Colla and Setter9 these mechanisms can be phenomenologically distinguished based on different fatigue behaviors: for the electrode degradation model, polarization parameters of the P–E loop (e.g., P r and P m) and the small-signal dielectric constant are supposed to scale down by the same factor.Reference Tagantsev, Stolichnov, Colla and Setter9 However, this is not the case here because the notable difference of the decay constant m has been demonstrated for all parameters [see Eqs. (1), (2), and (4)]. The cycling-driven formation of the near-electrode passive layer should be manifested by a strong tilt of the polarization hysteresis loop, whereas the coercive field is either not influenced or slightly decreased.Reference Tagantsev, Stolichnov, Colla and Setter9 This expectation is inconsistent with the remarkable bumping of the coercive field in the present study. For domain wall pinning and seed inhibition mechanisms, both cases show the frozen domain configuration after fatigue. For the former scenario, the domain walls are pinned due to their interaction with the charged defects, while for the later one the nucleation seeds for the reversed domains are blocked in their embryonic state before they can create a macroscopic domain.Reference Tagantsev, Stolichnov, Colla and Setter9 However, these two mechanisms can still be experimentally distinguished from each other. The essential feature of the domain wall pinning is the dense domain structure.Reference Tagantsev, Stolichnov, Colla and Setter9 A clear manifestation of the fatigued state induced by this mechanism should be demonstrated by a high concentration of immobilized domain walls. As a consequence, the small-signal dielectric constant is expected to increase.Reference Tagantsev, Stolichnov, Colla and Setter9 In contrast, the fatigued state created by the seed inhibition mechanism generally contains relatively large domain regions, yielding to a decrease of the small-signal dielectric constant.Reference Tagantsev, Stolichnov, Colla and Setter9 From our in situ TEM observations (Figs. 2 and 3), growths of relatively large domains were generally observed. Since the domain density of the fatigued state did not show a notable increase, and also a substantial degradation of dielectric constant occurred after fatigue [Fig. 5(b)], it seems to suggest a leading contribution from the seed inhibition mechanism. Here, it should be pointed out that the electrode degradation and passive layer formation models are not necessarily contradictory to the seed inhibition mechanism. According to Lou et al.,Reference Lou and Wang50 the disappearance of the interface nucleation sites may be resulted from the growth of interfacial layer after fatigue.
Lastly, it should be stressed that other factors may also contribute to polarization fatigue, for example, cycling-induced microcracks, and the internal bias field from charge-accumulation at grain boundaries.Reference Lupascu1,Reference Tagantsev, Stolichnov, Colla and Setter9,Reference Lou10 Since such effects are always manifested beyond individual grains they are beyond the primary focus of the present work at the individual grain level.
IV. CONCLUSIONS
In conclusion, an electric field in situ TEM study was conducted to investigate the microstructural origin for electric fatigue in the 0.7PMN-0.3PT ceramic. The domain evolution within individual grains was directly visualized during the fatigue process. The in situ observations correlated well with the macroscopic property measurements on bulk specimens. It was found that the fatigue behavior in this composition was due to the frozen domain configuration after 103 cycles, yielding to a progressive degradation of polarization, dielectric constant, and piezoelectric coefficient. Both microscopic and macroscopic observations suggested the seed inhibition as the primary mechanism for the resulted fatigue behaviors. The electric field in situ TEM technique used in this study was demonstrated to be a powerful and promising probing tool to reveal the underlying mechanism with microscopic insight for electric fatigue.
ACKNOWLEDGMENT
The National Science Foundation (NSF), through Grant DMR-1037898, supported this work.