







1. Introduction
Vapour bubbles appear in many scientific studies and real-world applications that involve laser radiation. To researchers who study cavitation and bubble dynamics, laser is a convenient tool to create bubbles at a precise location without too much disturbance to the surrounding environment (Brujan et al. Reference Brujan, Nahen, Schmidt and Vogel2001; Tomita et al. Reference Tomita, Robinson, Tong and Blake2002; Zwaan et al. Reference Zwaan, Le Gac, Tsuji and Ohl2007). To technology developers and practitioners who use high-power laser in a liquid environment, cavitation is often an inevitable phenomenon and the resulting vapour bubbles may have both beneficial and detrimental effects. Example applications in this regard include liquid-assisted laser processing (e.g. underwater laser cutting (Chida et al. Reference Chida, Okazaki, Shima, Kurihara, Yuguchi and Sato2003) and laser cleaning (Song et al. Reference Song, Hong, Lukyanchuk and Chong2004; Ohl et al. Reference Ohl, Arora, Dijkink, Janve and Lohse2006)), ocular laser surgery (Vogel et al. Reference Vogel, Hentschel, Holzfuss and Lauterborn1986; Požar Reference Požar2020), laser angioplasty (Vogel et al. Reference Vogel, Engelhardt, Behnle and Parlitz1996) and laser lithotripsy (Fried & Irby Reference Fried and Irby2018; Ho et al. Reference Ho2021). The most common effects of laser-induced cavitation include the creation of a vapour channel, the disturbance of the local flow field, a propulsive force from bubble expansion, and material damages caused by the shock waves and microjets from bubble collapse (Dijkink & Ohl Reference Dijkink and Ohl2008; Mohammadzadeh, Mercado & Ohl Reference Mohammadzadeh, Mercado and Ohl2015; Chen et al. Reference Chen, Ho, Xiang, Sankin, Preminger, Lipkin and Zhong2022; Xiang et al. Reference Xiang, Li, Chen, Mishra, Sankin, Zhao, Tang, Wang, Yao and Zhong2023). Improving a technology often requires optimising the trade-offs between different effects.
While laser-induced cavitation can be roughly described as localised phase change due to radiation, the detailed physics involves laser emission and absorption, phase transition and the dynamics and thermodynamics of a two-phase fluid flow. Within this multiphysics problem, a key external (i.e. user-specified) parameter is the duration of the laser pulse. In different applications, the value of this parameter varies from femtoseconds ( $10^{-15}$ s) to more than 1 second (Juhasz et al. Reference Juhasz, Kastis, Suárez, Bor and Bron1996; Zwaan et al. Reference Zwaan, Le Gac, Tsuji and Ohl2007; Ho et al. Reference Ho2021). For example, nanosecond pulsed lasers are widely used in experiments of cavitation studies (Zwaan et al. Reference Zwaan, Le Gac, Tsuji and Ohl2007), microsecond pulsed lasers are common in laser lithotripsy operations (Ho et al. Reference Ho2021) and lasers with millisecond duration are utilised in underwater laser cutting experiments (Jain et al. Reference Jain, Agrawal, Vishwakarma, Choubey, Upadhyaya and Oak2010; Choubey et al. Reference Choubey, Jain, Ali, Singh, Vishwakarma, Agrawal, Arya, Kaul, Upadhyaya and Oak2015).
When the pulse duration is much smaller than the acoustic time scale in the fluid medium (i.e. characteristic length divided by sound speed), the laser energy input is referred to as short-pulsed. Typically, the laser energy is absorbed by the medium through nonlinear processes, leading to intense light absorption and cascading ionisation in the medium. This process results in the formation of a plasma bubble, commonly referred to as optical breakdown (Schoppink et al. Reference Schoppink, Krizek, Moser and Rivas2023). In this case, laser radiation can be assumed to be a preceding event that ends before the bubble starts to expand. Therefore, the analysis of fluid and bubble dynamics can be separated from that of laser radiation (Byun & Kwak Reference Byun and Kwak2004; Zein, Hantke & Warnecke Reference Zein, Hantke and Warnecke2013; Koch et al. Reference Koch, Lechner, Reuter, Köhler, Mettin and Lauterborn2016; Zhang & Prosperetti Reference Zhang and Prosperetti2021). In this paper, we study cavitation induced by long-pulsed laser, which means the duration of the laser pulse is longer than the acoustic time scale, yet shorter than the thermal diffusion time in the fluid. Unlike short-pulsed lasers, heating in this scenario occurs through linear absorption, leading to localised liquid–vapour phase transition, known as thermocavitation (Padilla-Martinez et al. Reference Padilla-Martinez, Berrospe-Rodriguez, Aguilar, Ramirez-San-Juan and Ramos-Garcia2014). In this case, laser radiation and phase transition may continue after the formation of the initial bubble. The assumption mentioned above is no longer valid. Laser radiation, phase transition and the fluid dynamics and thermodynamics are now interdependent. They need to be analysed together.
The vapour bubbles generated by long-pulsed laser often have a non-spherical shape that reflects some characteristics of the laser beam, such as its direction and width. Figure 1 shows two commonly observed shapes that will be studied in this paper, namely a rounded pear-like shape and an elongated conical shape. Depending on the application, one or the other may be preferred. For example, a rounded bubble, when it collapses, is more likely to generate a strong liquid jet that damages a surrounding material (Chen et al. Reference Chen, Ho, Xiang, Sankin, Preminger, Lipkin and Zhong2022; Xiang et al. Reference Xiang, Li, Chen, Mishra, Sankin, Zhao, Tang, Wang, Yao and Zhong2023). An elongated bubble, on the other hand, can be more energy efficient in creating a long vapour channel that allows laser to pass through. While bubbles of both shapes have been observed in many experiments (Mohammadzadeh et al. Reference Mohammadzadeh, Mercado and Ohl2015; Hardy et al. Reference Hardy, Kennedy, Wilson, Irby and Fried2016; Fried & Irby Reference Fried and Irby2018; Xiang et al. Reference Xiang, Li, Chen, Mishra, Sankin, Zhao, Tang, Wang, Yao and Zhong2023), elucidating the formation mechanisms of non-spherical shapes remains challenging. Moreover, the causal relation between bubble morphology and laser setting (e.g. wavelength, power magnitude and distribution, pulse duration and diverging angle) is still unclear. Many fundamental questions of practical significance are unresolved, such as the following.
(i) Does phase transition (vaporisation) last for a substantial period of time or does it occur instantaneously?
(ii) What fraction of the laser energy input is used to create the vapour bubble?
(iii) How can we control the laser setting so that the vapour bubble has a desired shape?
Non-spherical vapour bubbles generated by long-pulsed laser. (a) A rounded, pear-shaped bubble generated by Ho:YAG laser with wavelength  $2080\ \text {nm}$, pulse energy
 $0.2\ \text {J}$, pulse duration
 $70\ \mathrm{\mu }$s and acoustic time scale (fibre diameter divided by sound speed)
 $0.25\ \mathrm {\mu }$s. (b) An elongated bubble generated by thulium fibre laser with wavelength
 $1940\ \text{nm}$, pulse energy
 $0.11\ \text {J}$, pulse duration
 $170\ \mathrm {\mu }$s and acoustic time scale
 $0.25\ \mathrm {\mu }$s.

It is difficult to answer these questions by laboratory experiment only. While the evolution of bubble shape can be measured by high-speed optical imaging, measurement of the pressure, velocity and temperature fields inside and around the vapour bubble is challenging (Dular & Coutier-Delgosha Reference Dular and Coutier-Delgosha2013; Khlifa et al. Reference Khlifa, Coutier-Delgosha, Fuzier, Vabre and Fezzaa2013; Petkovšek & Dular Reference Petkovšek and Dular2013). Such limitations hinder the possibility to predict the time span of phase changes and to provide detailed explanations for bubble dynamics. The literature does offer studies on bubble shape transitions, including the relationship between bubble morphology and laser pulse duration (Asshauer, Rink & Delacretaz Reference Asshauer, Rink and Delacretaz1994; Jansen et al. Reference Jansen, Asshauer, Frenz, Motamedi, Delacrétaz and Welch1996), as well as the influence of pulse energy (Ho et al. Reference Ho2021). However, the experimental constraints impede a comprehensive exploration of the link between laser parameters and bubble geometry. For example, some parameters of laser (e.g. wavelength) cannot be varied continuously in experiments. Therefore, the partition of energy and the cause of the bubble's shape change cannot be determined easily. In this work, we combine laboratory experiment with numerical simulation to study long-pulsed laser-induced cavitation, focusing on the physics behind pear-shaped and elongated bubbles. We try to investigate the causal relation between the laser's parameters and the vapour bubble's shape, and to gain some insight on the three open questions mentioned previously.
In this work, we adopt a new computational model that combines compressible multiphase fluid dynamics with laser radiation and phase transition. In the past, bubble dynamics simulations were typically based on the solution of Rayleigh–Plesset, boundary integral or multi-dimensional Navier–Stokes equations (Plesset & Prosperetti Reference Plesset and Prosperetti1977; Klaseboer et al. Reference Klaseboer, Turangan, Fong, Liu, Hung and Khoo2006; Warnez & Johnsen Reference Warnez and Johnsen2015; Wang Reference Wang2017; Cao et al. Reference Cao, Wang, Coutier-Delgosha and Wang2021a). A simulation usually starts with one or multiple spherical bubbles as the initial condition. In most cases, the initial state inside each bubble is set to a constant. Although there are studies focused on simulating bubble dynamics induced by lasers, they tend to decouple the laser radiation and vaporisation process from bubble dynamics. The phase transition due to laser exposure is modelled separately to determine the constant initial states inside the bubble. This approach can be justified for bubbles generated by short-pulsed laser, given that radiation and vaporisation both complete at a smaller time scale compared with that of fluid dynamics. For long-pulsed laser-induced cavitation, the same approach is no longer valid. It would not be able to predict the effects of the lasting energy input, such as the possible continuation of phase transition and the formation of non-spherical bubbles. In this work, we couple the multiphase compressible inviscid Navier–Stokes equations with a laser radiation equation that models the absorption of laser energy by the fluid flow. The laser radiation equation is obtained by customising the radiative transfer equation (RTE) using the special properties of laser, including monochromaticity, directionality and a measurable (often non-zero) focusing or diverging angle. The fundamental components of the computational framework include an embedded boundary method that allows the solution of laser and fluid governing equations on the same mesh, a method of latent heat reservoir for vaporisation prediction, a local level set method for interface tracking and the FIVER (FInite Volume method with Exact multi-material Riemann solvers) method to enforce interface conditions. The algorithms and properties of this framework were published recently together with some verification tests (Zhao, Ma & Wang Reference Zhao, Ma and Wang2023). The FIVER method by itself is the pivot of a body of literature that includes simulation method development, verification and validation, and various applications in aerospace, ocean and biomedical engineering (see Farhat, Gerbeau & Rallu (Reference Farhat, Gerbeau and Rallu2012), Main et al. (Reference Main, Zeng, Avery and Farhat2017), Ma et al. (Reference Ma, Zhao, Islam, Narkhede and Wang2023), Islam et al. (Reference Islam, Ma, Michopoulos and Wang2023), Huang, De Santis & Farhat (Reference Huang, De Santis and Farhat2018) and the references therein). Compared with the physical model presented in Zhao et al. (Reference Zhao, Ma and Wang2023), a few improvements are made in this work, such as the inclusion of heat diffusion and the modelling of laser fibre using an embedded boundary method.
In two separate laboratory experiments, we use a holmium:yttrium–aluminum–garnet (Ho:YAG) laser and thulium fibre laser (TFL) to generate a pear-shaped bubble and an elongated bubble. In both cases, the bubble dynamics is recorded by high-speed optical imaging. In addition, the temporal profile of laser power is measured using a photodetector. These experimental measurements are treated as ground truth in this study. We simulate the two experiments using the computational model described previously. The measured laser power profile is used as an input to each simulation, which starts with a single phase (liquid water) in the entire computational domain. The simulations are capable of predicting bubble nucleation due to laser radiation. They provide transient, full-field results of laser irradiance, temperature, pressure, velocity and density. They also track the dynamics of the vapour bubble using a level set function. To validate the computational model, we compare the bubble dynamics predicted by the simulations with the high-speed images obtained from the experiments. Then, we analyse the full-field simulation results to explain the bubble dynamics and energy transmission. Based on the results, we hypothesise that the bubble's shape is determined by a race between advection and phase transition. At any time instant, if the speed of advection is higher than that of vaporisation, the bubble tends to grow spherically. Otherwise, it tends to elongate along the laser beam direction. To clarify this hypothesis, we build a simplified model problem for which the aforementioned two speeds can be defined analytically. Then, we test the hypothesis using our simulation results. This analytical definition of growth velocities forms a bridge between laser parameters and bubble morphology, providing guidance for the manipulation of laser settings to achieve targeted bubble shapes.
The remainder of this paper is organised as follows. Section 2 describes the physical model adopted in this study, including governing equations, constitutive models, and a phase transition model. Section 3 provides a summary of the numerical methods used to solve the model equations. In §§ 4 and 5, we present the experimental and simulation results for a pear-shaped bubble and an elongated bubble. In § 6, we discuss the transition between these two different shapes. Finally, § 7 provides a summary of this study and some concluding remarks.
2. Physical model
2.1. Fluid dynamics and thermodynamics
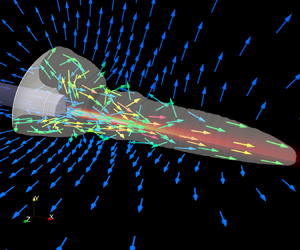
Figure 2 illustrates the problem investigated in this paper, showing a test case that generates a pear-shaped vapour bubble. The computational analysis is designed to start at the time when laser is just activated. At this time, the fluid domain is occupied completely by liquid water. The analysis is expected to predict the localised water vaporisation due to laser radiation, the subsequent bubble and fluid dynamics, and the dissipation of laser energy in this two-phase fluid medium. Therefore, we solve the following compressible inviscid Navier–Stokes equations that include radiative heat transfer, applied to both liquid and vapour phases:
 \begin{equation} \frac{\partial \boldsymbol{W}(\boldsymbol{x},t)}{\partial t} + \boldsymbol{\nabla} \boldsymbol{\cdot} \mathcal{F}(\boldsymbol{W}) = \boldsymbol{\nabla}\boldsymbol{\cdot}\mathcal{G}(\boldsymbol{W}),\quad \forall \boldsymbol{x} \in \varOmega = \varOmega_0 \cup \varOmega_1,\enspace t>0, \end{equation}
with
 \begin{equation} \boldsymbol{W}=\begin{bmatrix} \rho \\ \rho \boldsymbol{V} \\ \rho e_{t} \end{bmatrix},\quad \mathcal{F} = \begin{bmatrix} \rho \boldsymbol{V}^{{\rm T}} \\ \rho \boldsymbol{V} \otimes \boldsymbol{V} + p \boldsymbol{I} \\ (\rho e_{t} + p)\boldsymbol{V}^{\rm T} \end{bmatrix},\quad \mathcal{G} = \begin{bmatrix} \boldsymbol{0}^{\rm T} \\ \boldsymbol{0}\\ (k\boldsymbol{\nabla} T- \boldsymbol{q}_r)^{\rm T} \end{bmatrix}. \end{equation}
Long-pulse laser-induced vaporisation and bubble expansion: an example problem.

Here,  $\varOmega \subset \mathbb {R}^3$ denotes the domain of the fluid flow. Open subsets
 $\varOmega _0$ and
 $\varOmega _1$ represent the subdomains occupied by the liquid and vapour phases, respectively. They are time-dependent. In our experiments, a sharp boundary between the liquid and vapour phases can be clearly captured by high-speed imaging. Therefore, we assume
 $\varOmega _0 \cap \varOmega _1 = \emptyset$. Here
 $\rho$,
 $\boldsymbol {V}$,
 $p$ and
 $T$ denote the fluid's density, velocity, pressure and temperature, respectively, and
 $e_t$ is the total energy per unit mass, given by
 \begin{equation} e_t = e + \tfrac{1}{2} |\boldsymbol{V}|^2, \end{equation}
where  $e$ denotes the fluid's internal energy per unit mass,
 $k$ is the thermal conductivity coefficient, which takes different values in
 $\varOmega _0$ and
 $\varOmega _1$, and
 $\boldsymbol {q}_r$ denotes the radiative heat flux induced by laser. Equation (2.1) can be viewed as a generalisation of classical models for spherical bubbles (Plesset & Prosperetti Reference Plesset and Prosperetti1977; Prosperetti & Plesset Reference Prosperetti and Plesset1978). For example, the heat equation in Prosperetti & Plesset (Reference Prosperetti and Plesset1978) can be derived from the energy conservation equation in (2.1) by assuming an incompressible flow, spherical symmetry, a linear temperature equation and absence of radiative heating.
Equation (2.1) needs to be closed by a complete equation of state (EOS) for each phase. The computational model and solver utilised in this study supports arbitrary convex EOS (Ma et al. Reference Ma, Zhao, Islam, Narkhede and Wang2023). In this study, we adopt the Noble–Abel stiffened-gas equation (Le Métayer & Saurel Reference Le Métayer and Saurel2016) for both phases. Specifically,
 \begin{equation} p_{\mathcal{I}}(\rho,e) = (\gamma_\mathcal{I} - 1) \frac{e-q_\mathcal{I}}{\dfrac{1}{\rho} - b_\mathcal{I}} - \gamma_\mathcal{I} p_{c\mathcal{I}}, \end{equation}
in which the subscript  $\mathcal {I} \in \{0, 1\}$ identifies the liquid (
 $0$) and vapour (
 $1$) phases. For each phase,
 $\gamma$,
 $p_c$,
 $q$ and
 $b$ are constant parameters that characterise its thermodynamic properties. For example, a non-zero
 $b$ allows the model to have a variable Grüneisen parameter that depends on
 $\rho$. Clearly, (2.4) is a generalisation of perfect-gas, stiffened-gas and Noble–Abel EOSs (Le Métayer & Saurel Reference Le Métayer and Saurel2016).
For a given pressure equation such as (2.4), the choice of temperature equation is not unique. We adopt that proposed by Le Métayer & Saurel (Reference Le Métayer and Saurel2016), i.e.
 \begin{equation} T_\mathcal{I}(\rho,e) = \frac{1}{c_{v\mathcal{I}}} \left(e-q_\mathcal{I} -\left(\dfrac{1}{\rho} -b_\mathcal{I}\right)p_{c\mathcal{I}}\right), \end{equation}
where  $c_v$ denotes the specific heat capacity at constant volume, assumed to be a constant. It can be shown that the specific heat capacity at constant pressure,
 $c_p$, is also a constant, given by
 $c_p = \gamma c_v$. Combining (2.4) and (2.5) gives a complete EOS that satisfies the first law of thermodynamics.
Two groups of EOS parameter values are tested in this study, as shown in table 1. Neither of them was calibrated specifically for laser-induced cavitation (see Zein, Hantke & Warnecke Reference Zein, Hantke and Warnecke2013; Le Métayer & Saurel Reference Le Métayer and Saurel2016). We show in § 4 that the simulation result is indeed influenced by these parameter values.
Noble–Abel stiffened gas EOS parameters for water.

2.2. Liquid–vapour interface
We model the bubble surface as a sharp interface with zero thickness. It is defined by
 \begin{equation} \varGamma = \partial \varOmega_0 \cap \partial \varOmega_1. \end{equation}
On the interface, we assume continuity of normal velocity and pressure, i.e.
 \begin{equation} \begin{array}{l} \displaystyle\left(\lim_{\boldsymbol{x}'\rightarrow\boldsymbol{x}, \boldsymbol{x}'\in\varOmega_0} \boldsymbol{V}(\boldsymbol{x}',t) - \lim_{\boldsymbol{x}'\rightarrow\boldsymbol{x},\ \boldsymbol{x}'\in \varOmega_1} \boldsymbol{V}(\boldsymbol{x}',t) \right) \boldsymbol{\cdot} \boldsymbol{n}(\boldsymbol{x},t) = 0, \\ \displaystyle\lim_{\boldsymbol{x}'\rightarrow \boldsymbol{x},\ \boldsymbol{x}'\in \varOmega_0} p(\boldsymbol{x}',t) = \lim_{\boldsymbol{x}'\rightarrow \boldsymbol{x},\ \boldsymbol{x}'\in \varOmega_1} p(\boldsymbol{x}',t), \end{array}\quad \forall \boldsymbol{x}\in \varGamma,\quad t\geq 0, \end{equation}
where  $\boldsymbol {n}$ denotes the normal to
 $\varGamma$.
Here  $\varGamma$ is time-dependent, and must be solved for during the analysis. We represent it implicitly as the zero level set of a signed distance function,
 $\phi$, defined in the closure of
 $\varOmega$. That is,
 \begin{equation} \varGamma(t) = \{\boldsymbol{x}\in\bar{\varOmega},\ \phi(\boldsymbol{x},t)=0\}, \end{equation}
where  $\bar {\varOmega }$ denotes the closure of
 $\varOmega$.
In this way, the aforementioned phase identifier,  $\mathcal {I}$, is given by
 \begin{equation} \mathcal{I}(\boldsymbol{x},t) = \begin{cases} 0, & \text{if } \phi(\boldsymbol{x},t)>0\},\\ 1, & \text{if } \phi(\boldsymbol{x},t)<0\}. \end{cases} \end{equation}
The evolution of  $\varGamma$ in time is driven by both phase transition and advection. The advection of
 $\varGamma$ by the fluid flow is governed by the level-set equation,
 \begin{equation} \frac{\partial \phi}{\partial t} + \boldsymbol{V} \boldsymbol{\cdot}\boldsymbol{\nabla} \phi = 0, \end{equation}
where  $\boldsymbol {V}$ is the flow velocity due to advection.
At the beginning of the analysis,  $\varOmega = \varOmega _0$, and
 $\varGamma = \emptyset$. Therefore, we initialise
 $\phi$ to be a constant positive value everywhere in the domain, and start solving (2.10) only after phase transition starts. The detection and handling of laser-induced phase transition are discussed in § 2.4.
2.3. Laser radiation
Following Zhao et al. (Reference Zhao, Ma and Wang2023),  $\varOmega _L\subset \varOmega$ denotes the region in the fluid domain that is exposed to laser. The laser generators used in this study have a flat surface with a small diverging angle. Therefore,
 $\varOmega _L$ is in the shape of a truncated cone (figure 2, also see Zhao et al. Reference Zhao, Ma and Wang2023). Within
 $\varOmega _L$, energy conservation implies
 \begin{align} \boldsymbol{\nabla}\boldsymbol{\cdot} (\mathcal{L}\hat{\boldsymbol{s}}) &= \mu_{\alpha}(\eta) \mathcal{L}_{b}( \boldsymbol{x}, \eta) - \mu_{\alpha}(\eta)\mathcal{L}(\boldsymbol{x}, \hat{\boldsymbol{s}}, \eta) - \mu_{s}(\eta) \mathcal{L}(\boldsymbol{x}, \hat{\boldsymbol{s}}, \eta) \nonumber\\ &\quad +\frac{\mu_{s}(\eta)}{4 {\rm \pi}} \int_{4 {\rm \pi}} \mathcal{L}(\boldsymbol{x}, \boldsymbol{\hat{s}_i}, \eta) \varPhi(\boldsymbol{\hat{s}_i},\boldsymbol{\hat{s}}) \,{\rm d} \boldsymbol{\hat{s}}_i, \end{align}
where  $\mathcal {L}=\mathcal {L}(\boldsymbol {x},\hat {\boldsymbol {s}}, \eta )$ denotes the spectral radiance (dimensions: [mass][time]
 $^{-3}$[length]
 $^{-1}$) at position
 $\boldsymbol {x}\in \mathbb {R}^3$, along direction
 $\hat {\boldsymbol {s}}$, at wavelength
 $\eta$. Here
 $\mu _{\alpha }$ and
 $\mu _{s}$ denote the coefficients of absorption and scattering, respectively. They depend on the laser's wavelength and the medium. We use
 $\mathcal {L}_{b}$ to denote the blackbody radiance and
 $\varPhi (\boldsymbol {\hat {s}_i},\boldsymbol {\hat {s}})$ to denote the scattering phase function, which gives the probability that a ray from one direction
 $\boldsymbol {\hat {s}_i}$ would be scattered into another direction
 $\boldsymbol {\hat {s}}$. If
 $\hat {\boldsymbol {s}}$ is independent of
 $\boldsymbol {x}$, the left-hand side of (2.11) simplifies to
 $\boldsymbol {\nabla } \mathcal {L} \boldsymbol {\cdot } \boldsymbol {s}$, which gives the well-known RTE (Modest Reference Modest2013; Howell et al. Reference Howell, Mengüç, Daun and Siegel2020).
The radiative heat flux  $\boldsymbol {q}_r$ in (2.1) is obtained by integrating
 $\mathcal {L}$ over all directions and the interval of relevant wavelengths,
 $(\eta _{{min}},\eta _{{max}})$. That is,
 \begin{equation} \boldsymbol{q_{r}} (\boldsymbol{x}) = \int_{\eta_{{min}}}^{\eta_{{max}}} \int_{4{\rm \pi}} \mathcal{L}(\boldsymbol{x}, \hat{\boldsymbol{s}}, \eta) \boldsymbol{\hat{s}} \,{\rm d}\hat{\boldsymbol{s}} \,{\rm d}\eta. \end{equation}
The special properties of laser light allow us to simplify (2.11) and (2.12). The intensity of the laser light is much higher than the blackbody radiance. Therefore, we assume
 \begin{equation} \mathcal{L}_b(\boldsymbol{x},\eta)=0. \end{equation}
In addition,  $\mathcal {L}$ is non-zero only along the direction of laser propagation (
 $\boldsymbol {s}$) and at the fixed laser wavelength. That is,
 \begin{equation} \mathcal{L}(\boldsymbol{x},\hat{\boldsymbol{s}},\eta) = L(\boldsymbol{x})\delta(\hat{\boldsymbol{s}}-\boldsymbol{s})\delta(\eta-\eta_0), \end{equation}
where  $\delta ({\cdot })$ denotes the delta function, and the variable
 $L(\boldsymbol {x})$ on the right-hand side is irradiance (dimensions: [mass][time]
 $^{-3}$). With these assumptions, a laser radiation equation is obtained by substituting (2.14) and (2.13) into (2.11), i.e.
 \begin{equation} \boldsymbol{\nabla}\boldsymbol{\cdot}(L\boldsymbol{s}) = \boldsymbol{\nabla} L \boldsymbol{\cdot}\boldsymbol{s} + (\boldsymbol{\nabla}\boldsymbol{\cdot}\boldsymbol{s}) L ={-} \mu_\alpha L. \end{equation}
For a diverging beam,
 \begin{equation} \boldsymbol{s} (\boldsymbol{x}) = \frac{\boldsymbol{x} - \boldsymbol{x}_a}{| \boldsymbol{x} - \boldsymbol{x}_a |}, \end{equation}
where  $\boldsymbol {x}_a$ denotes the focal point of the beam. Then, substituting (2.14) into (2.12) yields
 \begin{equation} \boldsymbol{q}_r = L \boldsymbol{s}. \end{equation}
In this study, we measure the time history of laser power,  $P_0(t)$, in laboratory experiments. We assume the laser irradiance on the surface of the laser fibre (i.e.
 $\varGamma _{LS}$ in figure 2) follows a Gaussian distribution, also known as a Gaussian beam (Welch & Van Gemert Reference Welch and Van Gemert2011). Therefore, on
 $\varGamma _{LS}$ we have
 \begin{equation} L(\boldsymbol{x},t) = \frac{2P_0(t)}{{\rm \pi} w_0^2} \exp\left(\frac{-2 |\boldsymbol{x}-\boldsymbol{x}_0|^2}{w_0^2} \right), \end{equation}
where  $\boldsymbol {x}_0$ denotes the centre of
 $\varGamma _{LS}$,
 $w_0$ is the waist radius and
 $P_0(t)$ is the time-dependent laser power function, which is adjusted from measured laboratory data to account for the finite domain of the Gaussian function.
2.4. Vaporisation
We employ the method of latent heat reservoir proposed in Zhao et al. (Reference Zhao, Ma and Wang2023) to predict laser-induced vaporisation. As shown in figure 3, the fundamental idea of this method is to introduce a new variable,  $\varLambda (\boldsymbol {x},t)$, to track the intermolecular potential energy in the liquid phase. The vaporisation temperature,
 $T_{{vap}}$, and latent heat,
 $l$, are assumed to be constant and used in the method as coefficients. When the analysis starts,
 $\varLambda (\boldsymbol {x},t)$ is initialised to
 $0$ everywhere. As the liquid absorbs laser energy, temperature increases gradually. At any point
 $\boldsymbol {x}\in \varOmega _0$, once
 $T_{{vap}}$ is reached, additional heat, due to radiation, advection or diffusion, is added to
 $\varLambda$. When
 $\varLambda$ reaches
 $l$, phase transition occurs. The accumulated heat represented by
 $\varLambda$ is released and subsequently added to the internal energy of the vapour phase. In figure 3, this time instant is denoted by
 $t_4$. We assume that phase transition completes instantaneously at each point in the domain through an isochoric process. The state variables before and after phase transition are related by
 $$\begin{gather} \mathcal{I}^{+}= 1,\quad \textrm{(i.e. vapour)} \end{gather}$$
 $$\begin{gather}\rho^{+}= \rho^-, \end{gather}$$
 $$\begin{gather}e^{+}= e^-+ \varLambda^-, \end{gather}$$
 $$\begin{gather}\varLambda^{+}= 0, \end{gather}$$
 $$\begin{gather}\phi^{+}= -\frac{\Delta x}{2}, \end{gather}$$
where the superscripts  $-$ and
 $+$ indicate the variable's value before and after phase transition, e.g.
 \begin{equation} \rho^{+} \equiv \lim_{t\rightarrow t_4 \atop t>t_4}\rho(\boldsymbol{x},t). \end{equation}
Predicting laser-induced vaporisation by the method of latent heat reservoir.

In (2.23),  $\Delta x$ denotes the local element size in the computational mesh. The pressure and temperature after phase transition are obtained naturally from the EOS of the vapour phase, i.e.
 $$\begin{gather} p^{+}= p_1(\rho^+, e^+), \end{gather}$$
 $$\begin{gather}T^{+}= T_1(\rho^+, e^+). \end{gather}$$
The pressure rise,  $p^+ - p^-$, drives the expansion of the vapour bubble.
At each time step, if phase transition occurs, the level set function  $\phi$ is restored to a signed distance function by solving the reinitialisation equation,
 \begin{equation} \frac{\partial\phi}{\partial \tilde{t}} + S(\phi_0)(|\boldsymbol{\nabla}\phi| - 1) = 0, \end{equation}
to the steady state. Here,  $\tilde {t}$ is a fictitious time variable,
 $\phi _0$ is the level set function before reinitialisation and
 $S(\phi _0)$ is a smoothed sign function, given by
 \begin{equation} S(\phi_0) = \frac{\phi_0}{\sqrt{\phi_0^2 + \varepsilon^2}}, \end{equation}
where  $\varepsilon$ is a constant coefficient, set to the minimum element size of the mesh. The steady-state solution of (2.27) is then used as the new initial condition to integrate the level set equation (2.10) forwards in time.
3. Numerical methods
3.1. FIVER (FInite Volume method based on Exact multiphase Riemann problem solvers)
We apply a recently developed laser–fluid computational framework to solve the above model equations (Zhao et al. Reference Zhao, Ma and Wang2023). The fluid governing equations are semi-discretised using a fixed, non-interface conforming finite-volume mesh, denoted by  $\varOmega ^h$ (figure 4). The laser fibre is modelled as a fixed slip wall, and the associated boundary condition is enforced using an embedded boundary method (Wang Reference Wang2017; Cao, Main & Wang Reference Cao, Main and Wang2018; Cao et al. Reference Cao, Wang, Coutier-Delgosha and Wang2021a; Cao, Wang & Wang Reference Cao, Wang and Wang2021b). Therefore,
 $\varOmega ^h$ also covers the region occupied by the laser fibre. Around each node
 $\boldsymbol {n}_i\in \varOmega ^h$, a control volume
 $C_i$ is created. Applying the standard finite-volume spatial discretisation to (2.1) yields
 \begin{equation} \frac{\partial \boldsymbol{W}_i}{\partial t} + \frac{1}{|{C_i}|} \sum_{j \in Nei(i)} \int_{\partial C_{ij}} \mathcal{F}(\boldsymbol{W}) \boldsymbol{\cdot} \boldsymbol{n}_{ij} \,{\rm d} S = \frac{1}{|{C_i}|} \int_{C_i} \boldsymbol{\nabla}\boldsymbol{\cdot}\mathcal{G}(\boldsymbol{W}) \,{\rm d}\kern0.07em\boldsymbol{x}, \end{equation}
where  $\boldsymbol {W}_i$ denotes the average value of
 $\boldsymbol {W}$ in
 $C_i$,
 $Nei(i)$ denotes the set of nodes connected to node
 $\boldsymbol {n}_i$,
 $\partial C_{ij} = \partial C_i \cap \partial C_j$,
 $\boldsymbol {n}_{ij}$ is the unit normal to
 $\partial C_{ij}$ and
 $|C_i|$ denotes the volume of
 $C_i$.
Finite-volume discretisation of the spatial domain.

The FIVER method is used to calculate the advective flux across each facet  $\partial C_{ij}$. Depending on the locations of nodes
 $\boldsymbol {n}_i$ and
 $\boldsymbol {n}_j$, there are four different cases.
(i) If
 $\boldsymbol {n}_i$ and $\boldsymbol {n}_j$ belong to the same phase subdomain ($\varOmega _0$ or $\varOmega _1$), the conventional monotonic upstream-centred scheme for conservation laws (MUSCL) is used to compute the flux across $\partial C_{ij}$, i.e.
(3.2)where\begin{equation} F_{ij} = \| \partial C_{ij} \| \varPhi(\boldsymbol{W}_{ij}, \boldsymbol{W}_{ji}, \boldsymbol{n}_{ij}, \text{EOS}^{(i)}) ={-}F_{ji}, \end{equation}$\| \partial C_{ij} \|$ is the area of $\partial C_{ij}$, $\boldsymbol {W}_{ij}$ and $\boldsymbol {W}_{ji}$ denote the reconstructed state variables on the two sides of $\partial C_{ij}$ and $\varPhi$ represents the numerical flux function. In this work, the local Lax–Friedrichs flux function is employed. Here $F_{ij}$ and $F_{ji}$ are used to update the state variables within control volumes $C_i$ and $C_j$, respectively.
(ii) If
$\boldsymbol {n}_i$ and $\boldsymbol {n}_j$ belong to different phase subdomains, a one-dimensional (1-D) bimaterial Riemann problem is constructed along the edge between $\boldsymbol {n}_i$ and $\boldsymbol {n}_j$, i.e.
(3.3)where\begin{equation} \frac{\partial \boldsymbol{w}}{\partial \tau} + \frac{\partial \mathcal{F}(\boldsymbol{w})}{\partial \xi} = 0,\quad \text{with}\ \boldsymbol{w}(\xi,0) =\begin{cases} \boldsymbol{w}_i, & \text{if}\ \xi \leq 0, \\ \boldsymbol{w}_j, & \text{if}\ \xi > 0, \end{cases}\end{equation}$\tau$ denotes the time coordinate and $\xi$ denotes the spatial coordinate along the axis aligned with $\boldsymbol {n}_{ij}$ and centred at the phase interface between $\boldsymbol {n}_i$ and $\boldsymbol {n}_j$. The initial states $\boldsymbol {w}_i$ and $\boldsymbol {w}_j$ are the projections of $\boldsymbol {W}_i$ and $\boldsymbol {W}_j$ on the $\xi$ axis. This 1-D two-phase compressible flow problem can be solved exactly (Ma et al. Reference Ma, Zhao, Islam, Narkhede and Wang2023). The solution is self-similar, and satisfies the interface conditions (2.7). The state variables on the $i$- and $j$-sides of the interface, denoted by $\boldsymbol {W}^{*}_{ij}$ and $\boldsymbol {W}^{*}_{ji}$, are substituted into the same numerical flux function $\varPhi$. Specifically,
(3.4)$$\begin{gather} F_{ij} = \| \partial C_{ij} \| \varPhi(\boldsymbol{W}_{ij}, \boldsymbol{W}^{*}_{ij}, \boldsymbol{n}_{ij}, \text{EOS}^{(i)}), \end{gather}$$(3.5)$$\begin{gather}F_{ji} = \| \partial C_{ij} \| \varPhi(\boldsymbol{W}_{ji}, \boldsymbol{W}^{*}_{ji}, \boldsymbol{n}_{ij}, \text{EOS}^{(j)}). \end{gather}$$(iii) If one of
$\boldsymbol {n}_i$ and $\boldsymbol {n}_j$ belongs to a fluid-phase subdomain ($\varOmega _0$ or $\varOmega _1$), whereas the other is covered by the laser fibre, a 1-D half-Riemann problem is constructed and solved exactly (Wang Reference Wang2017; Cao et al. Reference Cao, Wang, Coutier-Delgosha and Wang2021a). The solution at the wall boundary is used to compute the advective fluxes across $\partial C_{ij}$, similar to the previous case.(iv) If both
$\boldsymbol {n}_i$ and $\boldsymbol {n}_j$ are covered by the laser fibre, the flux across $\partial C_{ij}$ is set to zero.


Details of FIVER can be found in previous papers such as Farhat et al. (Reference Farhat, Gerbeau and Rallu2012) and Main et al. (Reference Main, Zeng, Avery and Farhat2017). It is noteworthy that this method is not strictly conservative, mainly for two reasons (Main et al. Reference Main, Zeng, Avery and Farhat2017). First, the flux balance  $F_{ij} + F_{ji} = 0$ typically does not hold when
 $\boldsymbol {n}_i$ and
 $\boldsymbol {n}_j$ are in different phase subdomains. Second, when the material interface crosses one node due to advection, the state variables within the corresponding control volume are updated either by extrapolation or using the Riemann solution, both of which lead to a loss of conservation.
3.2. Diffusive heat fluxes
The right-hand side of (3.1) includes two parts, namely the heat diffusion term ( $\int _{C_i} \boldsymbol {\nabla }\boldsymbol {\cdot } (k \boldsymbol {\nabla } T) \,\textrm {d}\kern0.07em\boldsymbol {x}$) and the radiation term (
 $\int _{C_i} \boldsymbol {\nabla }\boldsymbol {\cdot } \boldsymbol {q}_r \,\textrm {d}\boldsymbol {x}$). The heat diffusion term is evaluated using a finite-volume method, i.e.
 \begin{equation} \int_{C_i} \boldsymbol{\nabla}\boldsymbol{\cdot} (k \boldsymbol{\nabla} T) \,{\rm d}\kern0.07em\boldsymbol{x} = \int_{\partial C_{ij}} (k \boldsymbol{\nabla} T) \boldsymbol{\cdot} \boldsymbol{n}_{ij} \,{\rm d} S = \sum_{j\in Nei(i)} (k \boldsymbol{\nabla} T)_{ij} A_{ij} \boldsymbol{\cdot} \boldsymbol{n}_{ij},\end{equation}
where  $A_{ij}$ is the area of facet
 $\partial C_{ij}$ and
 $(k \boldsymbol {\nabla } T)_{ij}\boldsymbol {\cdot } \boldsymbol {n}_{ij}$ denotes the heat flow due to diffusion that crosses the facet
 $\partial C_{ij}$. In this work, it is computed by
 \begin{equation} (k \boldsymbol{\nabla} T)_{ij}\boldsymbol{\cdot} \boldsymbol{n}_{ij} = k_{ij} \frac{T_i - T_j}{\|\boldsymbol{x}_i - \boldsymbol{x}_j\|_2}, \end{equation}
with
 \begin{equation} k_{ij} = \frac{2k_i k_j}{k_i + k_j}.\end{equation}
Here,  $k_i$ and
 $k_j$ denote the thermal conductivity at nodes
 $\boldsymbol {n}_i$ and
 $\boldsymbol {n}_j$, specifically. We assume that the liquid–vapour interface is isothermal, and it can be shown that if
 $\boldsymbol {n}_i$ and
 $\boldsymbol {n}_j$ belong to different phase subdomains, (3.7) and (3.8) enforce energy balance at the interface, with interface temperature (Faghri & Zhang Reference Faghri and Zhang2006)
 \begin{equation} T_{ij} = \frac{k_i T_i + k_j T_j}{k_i + k_j}. \end{equation}
We set the thermal conductivity at all the nodes covered by the laser fibre to zero. In this way, (3.7) and (3.8) enforce the adiabatic boundary condition at the surface of the laser fibre.
3.3. Laser radiation and laser–fluid coupling
The radiation term is evaluated by
 \begin{equation} \int_{C_i} (\boldsymbol{\nabla}\boldsymbol{\cdot} \boldsymbol{q}_r)\,{\rm d}\kern0.07em\boldsymbol{x} = (\boldsymbol{\nabla}\boldsymbol{\cdot} \boldsymbol{q}_r)_i {|{C_i}|}. \end{equation}
At each time step, the divergence of the radiative flux,  $\boldsymbol {\nabla }\boldsymbol {\cdot } \boldsymbol {q}_r$, is computed using the current solution of the laser radiation equation (2.15). In this work, the laser radiation equation is discretised using the same finite-volume mesh (
 $\varOmega ^h$) created for the fluid governing equations (figure 4). Specifically, integrating (2.15) within an arbitrary cell
 $C_i$ yields
 \begin{equation} \sum_{j\in Nei(i)} A_{ij}L_{ij} (\boldsymbol{s}_{ij}\boldsymbol{\cdot} \boldsymbol{n}_{ij}) ={-} {| {C_i} |} \mu_{\alpha}(T_i)L_i, \end{equation}
where  $L_{i}$ is the cell average of
 $L$ within
 $C_i$. Here
 $\boldsymbol {s}_{ij}$ represents the laser direction at
 $\partial C_{ij}$. It is set to the laser direction at the midpoint between nodes
 $\boldsymbol {n}_i$ and
 $\boldsymbol {n}_j$ and is calculated by (2.16).
 $L_{ij}$ is the value of
 $L$ at facet
 $\partial C_{ij}$. In this work, it is evaluated by the mean flux method, i.e.
 \begin{equation} L_{ij} =\begin{cases} \alpha L_i + (1-\alpha) L_j & \text{if } \boldsymbol{s}_{ij} \boldsymbol{\cdot} n_{ij} \geq 0,\\ (1-\alpha) L_i + \alpha L_j & \text{if } \boldsymbol{s}_{ij} \boldsymbol{\cdot} n_{ij} < 0, \end{cases} \end{equation}
where  $\alpha \in [0.5, 1]$ is a numerical parameter. Substituting (3.12) into (3.11) yields a system of linear equations with the cell averages of laser irradiance as unknowns. The Gauss–Seidel method is applied to solve this system to get
 $L_i$.
Notably, the fluid mesh  $\varOmega ^h$ does not contain a subset of nodes, edges and elements that resolve the boundary of
 $\varOmega _L$ or the laser propagation directions
 $\boldsymbol {s}(\boldsymbol {x})$. To address this issue, the embedded boundary method proposed in Zhao et al. (Reference Zhao, Ma and Wang2023) is adopted in this work. This method involves the population of ghost nodes outside the side boundary of the laser domain using second-order mirroring and interpolation techniques.
After solving the laser radiation equation,  $\boldsymbol {\nabla }\boldsymbol {\cdot }\boldsymbol {q}_r$ in (3.10) is obtained by
 \begin{equation} (\boldsymbol{\nabla}\boldsymbol{\cdot}\boldsymbol{q}_r)_i = \boldsymbol{\nabla}\boldsymbol{\cdot} (L_i \boldsymbol{s}) ={-} \mu_{\alpha}(T_i) L_i, \end{equation}
and then added to (3.1).
3.4. Vaporisation model implementation
The method of latent heat reservoir described in § 2.4 is implemented numerically to predict vaporisation. At the end of each time step, for each control volume  $C_i$ in
 $\varOmega _0$, the liquid temperature
 $T_i$ is obtained from (2.5) and compared with
 $T_{{vap}}$. If
 $T_i > T_{{vap}}$, we reduce
 $T_i$ to
 $T_{{vap}}$, and move the excessive heat to the latent heat reservoir,
 $\varLambda _i$. In this case, we update the state variables as follows:
 $$\begin{gather} T_i = T_{vap}, \end{gather}$$
 $$\begin{gather}\varLambda_i = \varLambda_i + (e_i - e_{vap}), \end{gather}$$
 $$\begin{gather}e_i = e_i - (e_i - e_{vap}) = e_{vap}, \end{gather}$$
where  $e_{vap}$ denotes the internal energy corresponding to
 $T_{vap}$, that is, the solution of (2.5) with
 $\mathcal {I}=0$ (liquid),
 $\rho = \rho _i$ and
 $T_\mathcal {I} = T_{vap}$.
If  $T_i\leq T_{{vap}}$, this means the fluid material within control volume
 $C_i$ is still below (or exactly equal to) the vaporisation temperature. If
 $\varLambda _i = 0$, nothing needs to be done. Because of flow advection, it may happen that
 $\varLambda _i > 0$. In this case, the latent heat stored in the control volume is used to increase the local temperature up to
 $T_{vap}$. Specifically, we set
 $$\begin{gather} \varLambda_i = \varLambda_i - \min (e_{vap}- e_i,\varLambda_i), \end{gather}$$
 $$\begin{gather}e_i = e_i + \min (e_{vap}- e_i, \varLambda_i), \end{gather}$$
 $$\begin{gather}T_i = T_\mathcal{I}(\rho_i,e_i),\quad \mathcal{I}=0. \end{gather}$$
Following these operations, we compare  $\varLambda _i$ and
 $l$ to determine if vaporisation should occur in
 $C_i$. If
 $\varLambda _i \geq l$, this control volume undergoes phase transition, and the fluid state is updated according to (2.19)–(2.26).
The numerical methods described above are implemented in the open-source M2C solver (Wang et al. Reference Wang, Ma, Zhao, Islam and Narkhede2021), which is used to run the simulations reported in this paper. Several verification studies can be found in Islam et al. (Reference Islam, Ma, Michopoulos and Wang2023), Zhao et al. (Reference Zhao, Ma and Wang2023), Cao et al. (Reference Cao, Wang, Coutier-Delgosha and Wang2021a) and earlier papers cited therein. An outline of the solution procedure within each time step is provided as follows. For simplicity, the forward Euler method is assumed here for time integration. In the actual simulations presented in this paper, a second-order Runge–Kutta method is used.
Input: Numerical solution at
$t^n$: $\boldsymbol {W}^n$, $\mathcal {I}^n$, $\phi ^n$, $L^n$ and $\varLambda ^n$.(1) Compute the residual of the Navier–Stokes equations (3.1).
(2) Advance the fluid state by one time step
$\Rightarrow$ $\boldsymbol {W}^{n+1}$, $\varLambda ^{n+1}$. Apply boundary conditions.(3) Compute the residual of the level set equation (2.10).
(4) Advance the level set function by one time step
$\Rightarrow$ $\phi ^{n+1}$. Apply boundary conditions.(5) Update phase identifier using
$\phi ^{n+1}$ $\Rightarrow$ $\mathcal {I}^{n+1}$. Update fluid state ($\boldsymbol {W}^{n+1}$, $\varLambda ^{n+1}$) at nodes that changed phase due to interface motion.(6) Check for phase transition (§§ 2.4 and 3.4). Update
$W^{n+1}$, $\varLambda ^{n+1}$, $\mathcal {I}^{n+1}$, and $\phi ^{n+1}$ at nodes that have undergone phase transition (2.19)–(2.26).(7) If phase transition occurred, reinitialise the level set (2.27).
(8) Solve the laser radiation equation for
$L^{n+1}$ (3.11).Output: Numerical solution at
$t^{n+1}$: $\boldsymbol {W}^{n+1}$, $\mathcal {I}^{n+1}$, $\phi ^{n+1}$, $L^{n+1}$, and $\varLambda ^{n+1}$.


4. A pear-shaped bubble
We employ the computational framework described previously to simulate a laboratory experiment that generates a pear-shaped bubble. The key parameters of the simulation, including laser fibre diameter, laser absorption coefficient and the divergence angle of the laser beam, are set to match the set-up of the experiment. The laser power used in the simulation (i.e.  $P_0(t)$ in (2.18)) is determined by fitting the laser power profile measured in the experiment. The simulation's output includes the time histories of the density, temperature, pressure, velocity and laser irradiance fields of the two-phase flow, and the level-set function that tracks the liquid–vapour interface. The bubble's nucleation and evolution are compared with high-speed optical images obtained from the experiment. By analysing the full-field results obtained from the simulation, we try to investigate the causal relation between the laser setting and the bubble's shape.
4.1. Comparison of experimental and numerical results
4.1.1. Laboratory experiment
In this experiment, a commercial Ho:YAG laser lithotripter (H Solvo  $35$-W laser, Dornier MedTech, Munich, Germany) with a wavelength of
 $2080\ \textrm {nm}$ is used to generate the vapour bubble. It is operated at the energy level of
 $0.2\ \textrm {J}$ with a pulse duration of
 $70\ \mathrm {\mu }$s, measured at full width at half maximum. It is clearly a long-pulsed laser, as the acoustic time scale is less than
 $1\ \mathrm {\mu }$s. Figure 5(a) shows a schematic representation of the experimental set-up. To facilitate the delivery of the pulsed laser, an optical fibre (Dornier SingleFlex
 $400$, Munich, Germany, numerical aperture
 $0.26$) with a core diameter of
 $0.365\ \textrm {mm}$ is used. The fibre directs laser into a transparent acrylic container (
 $150\ \textrm {mm} \times 150\ \textrm {mm} \times 300\ \textrm {mm}$) filled with degassed water. During the experiment, a series of high-speed images are captured using an ultrahigh-speed camera. To enable direct shadowgraph imaging, a
 $10$-ns pulsed laser system (SI-LUX-
 $640$, Specialised Imaging) provides the required illumination.
Schematic representation of the experimental set-up for laser-induced cavitation. (a) Set-up for capturing the bubble dynamics and (b) set-up for measuring the temporal profile of laser power.

To measure the laser power profile, an additional procedure is conducted in air. The laser pulse is directed towards a photodetector (PDA $10$D, Thorlabs, Newton, NJ) positioned at a distance of
 $1.5$ m, as illustrated in figure 5(b). The photodetector converts the received light into an electronic signal, which is displayed on an oscilloscope. Since air has minimal absorption of laser energy, the recorded data can be considered a reliable indication of the laser power output from the laser fibre when generating the vapour bubble in the bulk fluid.
Figure 6(a) presents the time history of the laser power measurement. The laser power increases from the beginning and reaches the maximum at approximately  $17\ \mathrm {\mu }$s. After that, it gradually drops to zero. The graph reveals some fluctuations, which are attributed to measurement noise. Integrating the measured laser power in time yields a total pulse energy of 0.2 J, which is in good agreement with the specified energy level. Figure 6(b) presents a series of high-speed images that show the nucleation and evolution of a vapour bubble at the tip of the laser fibre. In the initial stages (at
 $5\ \mathrm {\mu }$s), observable streaks emanate from the fibre tip. This phenomenon may arise due to the imperfect Gaussian distribution of the spatial profile of the Ho:YAG laser, characterised by fluctuations (Blackmon, Irby & Fried Reference Blackmon, Irby and Fried2010; Traxer & Keller Reference Traxer and Keller2020). These fluctuations result in multiple hot spots, causing non-uniform superheating of the liquid beneath the fibre, which displays as streaks from the side view. The bubble becomes visible at
 $15\ \mathrm {\mu }$s. It expands continuously, eventually acquiring a pear-like shape. The bubble maintains cylindrical symmetry about the central axis of the laser beam. However, it is not spherical, unlike the bubbles obtained from previous experiments that use short-pulsed lasers (e.g. Brujan et al. Reference Brujan, Nahen, Schmidt and Vogel2001; Lauterborn & Vogel Reference Lauterborn and Vogel2013; Zhong et al. Reference Zhong, Eshraghi, Vlachos, Dabiri and Ardekani2020).
Experimental results obtained with a Ho:YAG laser: (a) laser pulse profile measured in air and (b) dynamics of the vapour bubble in the bulk fluid. Perfect circles are drawn in (b) to show that the vapour bubble is not spherical.

Using the measured laser power profile, we can estimate the time it takes to heat water near the laser fibre tip to the vaporisation temperature,  $T_{{vap}}$. Here, we assume
 $T_{{vap}} = 373.15\ \textrm {K}$. We define a cylindrical region next to the laser fibre tip, with a diameter of
 $0.365\ \textrm {mm}$ (the laser fibre diameter) and a small depth of
 $0.1\ \textrm {mm}$. The energy required to raise water temperature in this region from the room temperature (assumed to be
 $293.15\ \textrm {K}$) to
 $T_{{vap}}$ can be estimated by
 \begin{equation} \Delta E = c_v \Delta T \rho V \approx 0.003\ \text{J}, \end{equation}
with  $c_v = 4.285\times 10^3\ \textrm {J}\ (\textrm {kg}\ \textrm {K})^{-1}$ and
 $\Delta T = 80\ \textrm {K}$. The percentage of laser energy absorbed in this region can be roughly estimated by the Beer–Lambert law, which is the one-dimensional version of (2.15). That is,
 \begin{equation} \frac{\partial{L}}{\partial x} ={-}\mu_{\alpha} L. \end{equation}
The solution of this equation is simply  $L(x) = L_0 \exp ({-\mu _\alpha x})$, where
 $L_0$ denotes the laser irradiance at the source (i.e.
 $x=0$). Setting
 $\mu _{\alpha } = 2.42\ \textrm {mm}^{-1}$ for the Ho:YAG laser (Fried & Irby Reference Fried and Irby2018), we find that approximately
 $21.5\,\%$ of the laser energy is absorbed within the depth of the cylindrical region defined previously. Now, by integrating the measured laser power profile (figure 6a), we can estimate that at approximately
 $9\ \mathrm {\mu }$s, the temperature within the small cylindrical region reaches
 $T_{{vap}}$. From the high-speed images, the vapour bubble does not appear until
 $15\ \mathrm {\mu }$s. This finding implies a clear delay in bubble nucleation, which can be attributed to the high latent heat of water.
4.1.2. Numerical simulation
Figure 7 shows the set-up of the simulation. A cylindrical domain with a radius of  $12$ mm and a length of
 $24$ mm is adopted. It is initially occupied by liquid water with density
 $\rho _0 = 0.001\ \textrm {g}\ \textrm {mm}^{-3}$, velocity
 $v_0=0\ \textrm {mm}\ \textrm {s}^{-1}$, pressure
 $p_0 = 100\ \textrm {kPa}$ and temperature
 $T_0 = 293.15\ \textrm {K}$. A far-field boundary condition, ensuring that outgoing waves do not reflect back, is applied to the domain boundaries.
Vapour bubble generated by a Ho:YAG laser: simulation set-up. (a) Spatial domain with cylindrical symmetry. (b) Geometry of the laser radiation domain and mesh resolution. (c) Spatial profile of laser irradiance on the laser source plane. (d) Temporal profile of laser power.

The laser source is positioned at  $x=-0.5\ \textrm {mm}$, as shown in figure 7(b). The laser fibre is modelled as a rigid structure, embedded in the computational domain. It has a radius
 $r = 0.1825\ \textrm {mm}$, consistent with the laboratory experiment. The spatial profile of laser irradiance on the source plane is specified as a Gaussian function (2.18) with waist radius
 $w_0 = 0.165\ \textrm {mm}$, as shown in figure 7(c). This value is calibrated based on references indicating a beam diameter of approximately
 $0.3\ \textrm {mm}$ for the Ho:YAG laser (Fried Reference Fried2018). The temporal profile of laser power (
 $P_0$ in (2.18)) is specified as the blue line shown in figure 7(d). It is obtained by fitting the experimental measurement using fast Fourier transform (FFT). The pulse shape is approximately a triangle, with the power growing from
 $0$ to
 $2.98\ \textrm {kW}$ within
 $24\ \mathrm {\mu }$s, then vanishing gradually within
 $136\ \mathrm {\mu }$s. The laser beam propagates in the
 $x$ direction with a divergence angle
 $\theta _{{div}} = 7.53^{\circ }$. Along the beam direction, the length of the laser radiation domain (
 $\varOmega _L$) is set to
 $10\ \textrm {mm}$. This length is large enough such that at the far end, laser irradiance is close to zero. The laser absorption coefficient,
 $\mu _\alpha$, is set to
 $2.42\ \textrm {mm}^{-1}$ for liquid water (Fried & Irby Reference Fried and Irby2018) and
 $0.001\ \textrm {mm}^{-1}$ for the vapour. The vaporisation temperature and latent heat of vaporisation are set by
 $T_{{vap}} = 373.15\ \textrm {K}$ and
 $l = 2256.4\ \textrm {J}\ \textrm {g}^{-1}$, respectively.
The Noble–Abel stiffened-gas EOS (2.4) is employed to model both liquid water and water vapour. First, we adopt the EOS parameters presented in Zein et al. (Reference Zein, Hantke and Warnecke2013), which are listed as Group  $1$ in table 1. The thermal conductivity,
 $k$, is set to
 $5.576\times 10^{-4}\ \textrm {W}\ (\textrm {mm}\ \textrm {K})^{-1}$ for liquid water and
 $2.457\times 10^{-5}\ \textrm {W}\ (\textrm {mm}\ \textrm {K})^{-1}$ (Wagner et al. Reference Wagner, Kretzschmar, Span and Krauss2010) for the vapour.
By the assumption of cylindrical symmetry, we solve the fluid governing equations on a two-dimensional mesh, while adding source terms to the equations to enforce the symmetry (see e.g. Islam et al. Reference Islam, Ma, Michopoulos and Wang2023). The mesh has approximately  $2.4$ million rectangular elements. In the most refined area, the characteristic element size is about
 $1.5\times 10^{-3}\ \textrm {mm}$ (as illustrated in figure 7b). To put this into context, the diameter of the laser fibre is resolved by about
 $240$ elements. This mesh, chosen after a mesh convergence analysis, provides the appropriate resolution necessary for accurate results. The local level set method with a bandwidth of six elements on each side of the interface is used to track the vapour bubble. Both the fluid governing equations and the level set equation are integrated in time using a second-order Runge–Kutta method. The time step size is approximately
 $4\times 10^{-4}\ \mathrm {\mu }$s. The simulation is terminated at
 $t = 120\ \mathrm {\mu }$s, which roughly covers the bubble nucleation and expansion stage observed in the laboratory experiment.
The simulation also generates a pear-shaped bubble, as observed in the experiment. Figure 8 presents a detailed comparison between the experimental data and the simulation result. In figure 8(a), the high-speed images obtained from the experiment and the simulation results (bubble dynamics and laser irradiance) are shown side by side. The simulation predicts that the vapour bubble nucleates at approximately  $17.4\ \mathrm {\mu }$s. This is similar to the finding from the experiment, in which the bubble appears at
 $15\ \mathrm {\mu }$s. The overall bubble dynamics predicted by the simulation, that is, the evolution of the bubble's size and overall shape, agrees reasonably well with the experimental data.
Vapour bubble generated by a Ho:YAG laser: comparison of bubble dynamics obtained from numerical simulation and laboratory experiment. (a) Bubble nucleation and evolution. In each subfigure, the left half shows the imaging result from the experiment and the right half shows the bubble and laser irradiance field predicted by the simulation. (b) Evolution of bubble size and shape. Here  $l_b$ and
 $d_b$ denote the maximum length of the bubble along and perpendicular to the laser fibre direction, respectively.

To make a quantitative comparison between the simulation result and the experimental data, we measure the maximum length of the bubble in two directions, that is, along and perpendicular to the laser fibre direction. These two measurements are denoted as  $l_b$ and
 $d_b$, respectively, and plotted in figure 8(b). The value of
 $l_b$ obtained from the simulation matches its experiment counterpart very well. The discrepancy between the simulation and the experiment in
 $d_b$ is a bit larger, between
 $4\,\%$ and
 $15\,\%$ at different time instants. In addition, the bubble's expansion speed in the perpendicular direction is slightly larger in the simulation than in the experiment. Furthermore, the aspect ratio of the bubble, defined as
 $l_b/d_b$, is also calculated, and plotted in figure 8(b). In both the experiment and the simulation, it varies between
 $0.75$ and
 $1$.
4.2. Delay of bubble nucleation due to latent heat
As mentioned in § 4.1.1, the laboratory experiment reveals a delay of bubble nucleation, that is, the time of bubble nucleation is clearly after the time when the vaporisation temperature ( $T_{{vap}}$) is reached at the fibre tip. The same phenomenon is observed in the simulation.
Figure 9 shows the temperature field at eight time instants during the early period of the simulation. At the beginning, the temperature of water in front of the laser fibre increases continuously, as it absorbs laser energy. This can be seen in the solution snapshots taken at  $0$ to
 $7\ \mathrm {\mu }$s. At
 $7\ \mathrm {\mu }$s, the temperature of water next to the centre of the fibre tip first reaches
 $T_{{vap}}$. This is about
 $10\ \mathrm {\mu }$s before bubble nucleation, which occurs at
 $17.4\ \mathrm {\mu }$s. Within this time period, the region that reaches
 $T_{{vap}}$ expands continuously, but phase transition does not occur.
Vapour bubble generated by a Ho:YAG laser: temperature evolution in the first  $20\ \mathrm {\mu }$s. For the solutions between 17.4 and
 $20\ \mathrm {\mu }$s, a different colour map is applied to show temperature variation inside the bubble.

This time delay is due to the fact that water has a high latent heat of vaporisation. Based on the values of  $l$ and
 $c_v$ adopted in the simulation, the latent heat is about
 $8$ times the energy needed to raise water temperature from
 $T_0$ to
 $T_{{vap}}$. Using the phase transition model described in § 2.4, as soon as
 $T_{{vap}}$ is reached, any additional heat contributes towards increasing the intermolecular potential energy, thereby overcoming the required latent heat of vaporisation. To examine this process more closely, we define
 \begin{equation} \varLambda_{\varOmega} = \int_\varOmega \rho\varLambda \,{\rm d}\kern0.07em\boldsymbol{x}, \end{equation}
which measures the total amount of latent heat in the computational domain. Figure 10 shows the time history of  $\varLambda _{\varOmega }$. At
 $6.9\ \mathrm {\mu }$s,
 $\varLambda _{\varOmega }$ becomes non-zero and begins to increase. Up to the time of bubble nucleation (
 $17.4\ \mathrm {\mu }$s), the total energy stored in the latent heat reservoir is around
 $6.3$ mJ. By integrating the power profile (figure 7d), we find that this value is approximately
 $16.84\,\%$ of the laser energy input up to the same time.
Vapour bubble generated by a Ho:YAG laser: time history of the stored latent heat.

In this simulation, vaporisation starts at  $17.4\ \mathrm {\mu }$s, and continues for a short period of time (less than
 $1\ \mathrm {\mu }$s). Figure 10 shows that after vaporisation stops,
 $\varLambda _{\varOmega }$ drops to around 0.8 mJ. Given that the total laser pulse energy is 0.2 J, this result implies that only a small fraction of the laser energy input (
 $(6.3-0.8\ \textrm {mJ})/0.2\ \textrm {J}=2.75\,\%$) is directly used to create the bubble.
The enlarged view images in figure 9 reveal that the temperature inside the newly formed vapour bubble is highly non-uniform. In general, this reflects the complexity of the fluid flow inside the bubble, caused by the non-uniform laser beam, the continuation of vaporisation and the laser fibre acting as a wall boundary. Near the bubble's surface, temperature is significantly higher, reaching around 2000 K at  $17.4\ \mathrm {\mu }$s, and displays wavelike perturbations. In contrast, the maximum temperature of the liquid water outside the bubble is 373.15 K (i.e.
 $T_{{vap}}$). Therefore, the temperature field is discontinuous across the bubble's surface, which implies that heat is temporarily trapped inside the bubble. This discontinuity can be explained by the fact that only pressure and normal velocity are enforced to be continuous across the liquid–vapour interface (§ 2.2). Density is not constrained, and is generally discontinuous across the interface. Using the EOSs (2.4) and (2.5), temperature can be written as a function of density and pressure. Due to the discontinuities in both the EOS and density across the interface, the temperature field is also discontinuous. This result may be related to the ‘radiation slip’ condition in the literature of radiation heat transfer, which is used to account for temperature jumps across material interfaces (Sparrow Reference Sparrow2018). It should be noted that although the overall phenomenon of high-temperature perturbation near the bubble's surface can be explained by the physical model, this finding has not been confirmed by experimental measurement. The small size of the initial bubble makes it difficult to completely rule out the influence of numerical discretisation errors. Therefore, details of this phenomenon may not be considered as definitive.
4.3. Generation of a pear-shaped bubble
In both the experiment and the simulation, a pear-shaped vapour bubble is obtained. To explain the formation of this shape, we look at the pressure and velocity fields obtained from the simulation (figures 11 and 12).
Vapour bubble generated by a Ho:YAG laser: evolution of the pressure field. For the solutions between 17.6 and  $19\ \mathrm {\mu }$s, a different pressure range (
 $-20$ to
 $40$ MPa) is applied to clearly show the pressure wave induced by the bubble.

Vapour bubble generated by a Ho:YAG laser: evolution of the velocity field. The solution fields of velocity and vorticity magnitude inside the vapour bubble are shown for the time instants 50 and  $120\ \mathrm {\mu }$s, respectively.

First, the two pressure snapshots at 0.4 and  $1\ \mathrm {\mu }$s (figure 11) capture an outgoing acoustic wave that emanated from the fibre tip. This is a weak shock wave caused by the rapid increase of laser power. The vapour bubble nucleates at
 $17.4\ \mathrm {\mu }$s. The pressure and velocity fields at this time are shown in figures 11 and 12. At this time, the bubble is already non-spherical. The pressure inside the bubble is high and non-uniform. Specifically, the pressure at the forward end is around 500 MPa. The pressure at the backward end, that is, near the fibre tip, is much lower, around 100 MPa. This pressure variation is a result of the brief continuation of vaporisation. Regions that have just undergone phase transition have high pressures. Then, the pressure drops as the bubble expands. Therefore, the continuation of vaporisation along the beam direction leads to the higher pressure at the forward end of the bubble. In summary, the simulation result at the time of bubble nucleation (
 $17.4\ \mathrm {\mu }$s) already implies that the bubble will likely grow into a non-spherical shape, longer in the laser beam direction.
The high pressure inside the initial bubble also generates a weak shock wave that propagates outwards at approximately the speed of sound in water. This wave can be seen in the pressure snapshots taken at  $17.6\unicode{x2013} 19\ \mathrm {\mu }$s (figure 11). This wave is also evident in the temperature snapshots acquired at 17.6 and
 $18\ \mathrm {\mu }$s (figure 9). Afterwards, the pressure field becomes quiet, and the bubble continues growing due to inertia. The velocity field at
 $50\unicode{x2013} 120\ \mathrm {\mu }$s (figure 12) shows that the velocity around the bubble is non-uniform. It is higher at the forward end of the bubble compared with other regions. Furthermore, the velocity distribution within the bubble exhibits significant non-uniformity. The velocity is notably higher in the vicinity of the central axis of the fibre, particularly near the forward end. This also explains the formation of a pear-like shape, instead of a sphere. In addition, as the bubble expands, small vortices form within the vapour bubble. Two enlarged view images showing these vortices are included in figure 12.
These observations can serve as references to explain the formation of pear-shaped bubbles induced by long-pulsed lasers with similar laser settings. For example, a similar pear-shaped bubble is observed in an experiment detailed in Jansen et al. (Reference Jansen, Asshauer, Frenz, Motamedi, Delacrétaz and Welch1996). In this experiment, the bubble is also generated by a Ho:YAG laser with the same pulse energy  $0.2\ \textrm {J}$ and a comparable pulse duration
 $100\ \mathrm {\mu }$s.
4.4. Effect of the choice of EOS
We show that the result obtained from our laser–fluid coupled computational framework can be influenced by the choice of EOS and, more precisely, the choice of EOS parameter values in this case. Here, we present another simulation with a different group of EOS parameter values, listed as Group  $2$ in table 1. All the other (physical and numerical) parameters remain the same. The results, compared in figure 13, show both parameter groups predict the nucleation of a vapour bubble over a very short period of time, followed by expansion due to high internal pressure, resulting in a rounded bubble shape.
Vapour bubble generated by a Ho:YAG laser: side-by-side comparison of simulation results obtained with different EOS parameter values. In each subfigure, the left and right halves show the result obtained with Group  $1$ and
 $2$ parameter values, respectively.

However, a few differences can be found between the two simulations. First, there is a difference in the time when vaporisation occurs. With Group  $1$ parameter values, vaporisation takes place at
 $17.4\ \mathrm {\mu }$s. With Group
 $2$ parameter values, it occurs later, at
 $18.8\ \mathrm {\mu }$s. The laser parameters are the same in both cases. Therefore, this discrepancy should be attributed mainly to the different temperature increase rates determined by the EOS, as defined in (2.5). Moreover, the speed of bubble growth is found to be lower with Group
 $2$ parameter values than with Group
 $1$. In figure 13, at both 25 and
 $30\ \mathrm {\mu }$s, the bubble obtained with Group
 $1$ parameter values is clearly larger than that obtained with Group
 $2$. The difference in growth speed can be explained by the pressure field. As shown in figure 13(b), the bubble's internal pressure reaches a maximum of
 $73\ \textrm {MPa}$ with Group
 $2$ parameter values. This is much lower than the maximum pressure obtained with Group
 $1$ parameter values, which is
 $500\ \textrm {MPa}$. Lastly, the shapes of the bubbles obtained from the two simulations are slightly different. A pear-shaped bubble is captured with Group
 $1$ parameter values. With Group
 $2$, the bubble is more rounded.
5. An elongated bubble
In this section, we investigate the generation of an elongated bubble using Thulium Fibre Laser (TFL). The experiment is conducted in the same acrylic water tank, but the laser wavelength, the beam geometry and the power profile are different. The simulation set-up is modified to match the new experiment. Because of these changes, the vapour bubbles obtained from the experiment and the simulation both have a long, conical shape, different from the pear-shaped bubble shown in § 4. Again, we examine the full-field solutions obtained from the simulation to explain the bubble and fluid dynamics. In addition, we also discuss the effect of bubble dynamics on the delivery of laser energy.
5.1. Comparison of experimental and numerical results
5.1.1. Laboratory experiment
A TFL (TFL- $50$/
 $500$-QCW-AC, IPG Photonics, Oxford, MA) with a 1940 nm wavelength is used to generate the vapour bubble. The laser generator is operated at the energy level of
 $0.11\ \textrm {J}$, which is roughly half of the pulse energy in the Ho:YAG experiment (§ 4.1.1). The diameter of the laser fibre remains the same, but the laser beam is narrower (Blackmon et al. Reference Blackmon, Irby and Fried2010). Again, the time history of laser power is measured in air using a photodetector and an oscilloscope (figure 5b). The obtained result is shown as the red line in figure 15(b). The power profile exhibits a trapezoidal shape, with the laser power fluctuating around
 $0.6\ \textrm {kW}$ for the first
 $140\ \mathrm {\mu }$s. Then, it gradually decays to zero. Compared with the Ho:YAG laser (figure 6a), the pulse duration is longer, but the peak power is lower.
Figure 14 shows  $12$ high-speed images of the vapour bubble during its nucleation and expansion stage (
 $0\unicode{x2013} 120\ \mathrm {\mu }$s). It can be observed that the laser pulse generates an elongated vapour bubble, clearly different from the pear-shaped bubble obtained with the Ho:YAG laser. Starting from the first frame at
 $t = 5\ \mathrm {\mu }$s, a small bubble appears at the fibre tip. This means vaporisation starts at a time between
 $0$ and
 $5\ \mathrm {\mu }$s, earlier than that in the Ho:YAG experiment. From 5 to
 $120\ \mathrm {\mu }$s, the bubble grows continuously, forming a long, conical shape.
The experimental result obtained with a TFL. (High-speed images of the vapour bubble.)

5.1.2. Numerical simulation
We simulate the TFL experiment using the computational framework described in §§ 2 and 3. The same computational domain and mesh described in § 4.1.2 are adopted. The geometry of the embedded laser fibre is also the same. The divergence angle of the laser beam,  $\theta _{{div}}$, is set to
 $9.78^\circ$. This is because the wavelength of TFL is different from that of the Ho:YAG laser. The absorption coefficient,
 $\mu _\alpha$, is set to
 $14\ \textrm {mm}^{-1}$ in liquid water (Traxer & Keller Reference Traxer and Keller2020), which is about
 $6$ times the value for Ho:YAG laser. This is also due to the fact that TFL has a different wavelength. The absorption coefficient in water vapour is set to
 $0.001\ \textrm {mm}^{-1}$, the same as in the previous case.
The waist radius of the Gaussian beam is set to  $0.05\ \textrm {mm}$ (figure 15a). This value is also determined through calibration, considering that TFL typically exhibits greater collimation, which results in a smaller beam waist compared with the Ho:YAG laser (Fried Reference Fried2018). The temporal profile of the laser power is specified to be a trapezoidal function that approximates the experimental measurement (figure 15b). The resulting pulse energy is the same as that in the experiment, i.e.
 $0.11\ \textrm {J}$. More specifically, the power grows rapidly from
 $0$ to
 $0.62\ \textrm {kW}$ within
 $0.1\ \mathrm {\mu }$s. This peak power is maintained for a period of
 $140\ \mathrm {\mu }$s. Then, it vanishes gradually within
 $80\ \mathrm {\mu }$s. The parameters of the Noble–Abel stiffened gas EOS are set by the values in Group
 $1$ in table 1.
Vapour bubble generated by a TFL: simulation set-up. (a) Spatial profile of laser irradiance on the source plane. (b) Temporal profile of laser power.

The simulation predicts the formation of an elongated bubble, similar to that observed in the experiment. Figure 16(a) presents a side-by-side comparison between the results obtained from the experiment and the simulation. In each subfigure, the left-hand side is a high-speed image obtained from the experiment. The right-hand side is the simulation result at the same time, showing the bubble surface and the laser irradiance field. It can be seen that the bubble obtained from the simulation also has a long, conical shape. In the simulation, vaporisation starts at  $1.2\ \mathrm {\mu }$s. This is consistent with the experimental data, which shows the bubble nucleates at a time between
 $0$ and
 $5\ \mathrm {\mu }$s. At
 $5\ \mathrm {\mu }$s, the shape of the bubble obtained from the simulation matches the experimental data reasonably well. As time progresses, the bubble from the simulation undertakes the same evolution trend, growing faster in the axial direction than in the radial direction. The main difference between the simulation result and the experimental data lies in the size of the bubble. The simulated bubble is smaller than its experimental counterpart in all the snapshots shown in figure 16(a).
Vapour bubble generated by a TFL: comparison of bubble dynamics obtained from numerical simulation and laboratory experiment. (a) Bubble nucleation and evolution. In each subfigure, the left-hand side shows the imaging result from the experiment and the right-hand side shows the bubble and laser irradiance field predicted by the simulation. (b) Evolution of bubble size and shape. Here  $l_b$ and
 $d_b$ denote the maximum length of the bubble along and perpendicular to the laser fibre direction, respectively.

To make a quantitative comparison, we measure the length and width of the bubble, denoted by  $l_b$ and
 $d_b$, respectively. Figure 16(b) shows the time histories of
 $l_b$,
 $d_b$, and the aspect ratio,
 $l_b/d_b$. It can be observed that the aspect ratio predicted by the simulation matches well the experimental result. For
 $l_b$ and
 $d_b$, the simulation is able to capture the same trend found in the experiment. But the magnitude is lower. It is notable that in both the simulation and the experiment, the aspect ratio starts at approximately
 $1$. Then, it increases steadily, reaching around
 $2$ after
 $70\ \mathrm {\mu }$s. This implies that the bubble elongates gradually. In comparison, in the previous case with the Ho:YAG laser, the
 $l_b$-to-
 $d_b$ aspect ratio is roughly constant in time (figure 8b).
5.2. Bubble elongation due to continuous vaporisation
To investigate the mechanism of bubble elongation, we examine the temperature, pressure and velocity fields obtained from the simulation.
Figure 17 presents the evolution of the temperature field near the fibre tip in the first  $5\ \mathrm {\mu }$s. The laser irradiance field is also shown at three time instants (
 $1.2$,
 $2.0$ and
 $2.4\ \mathrm {\mu }$s) to facilitate the discussion. Similar to the previous case (figure 9), water temperature increases due to the absorption of laser energy, especially in the region around the central axis of the laser beam. The time it takes to reach the vaporisation temperature is significantly shorter, only
 $0.4\ \mathrm {\mu }$s, compared with
 $7\ \mathrm {\mu }$s in the previous case. The faster temperature increase can be attributed to two factors. First, the smaller beam waist of the laser results in a more concentrated distribution of laser irradiance on the source plane. Although the laser power is lower in the current case (compare figures 8(d) and 16(b)), the more concentrated distribution leads to a higher laser irradiance along the central axis, that is,
 $110\ \textrm {kW}\ \textrm {mm}^{-2}$ (figure 16a) vs
 $80\ \textrm {kW}\ \textrm {mm}^{-2}$ in the previous case (figure 8a). Second, the absorption coefficient of TFL in water is significantly higher than that of the Ho:YAG laser used previously (14 vs
 $2.42\ \textrm {mm}^{-1}$). The time delay in bubble nucleation is also observed in this case. After
 $T_{{vap}}$ is reached, it takes another
 $0.8\ \mathrm {\mu }$s before vaporisation occurs at the fibre tip, at
 $1.2\ \mathrm {\mu }$s. Within this time period, the absorbed laser energy is converted into the intermolecular potential energy of liquid water.
Vapour bubble generated by a TFL: evolution of the temperature field in the first  $5\ \mathrm {\mu }$s. For the solutions between 3.0 and
 $5.0\ \mathrm {\mu }$s, a different colour scheme and range is applied to clearly show the temperature variation inside the bubble. The solution of laser irradiance is shown at
 $1.2$,
 $2.0$ and
 $2.4\ \mathrm {\mu }$s (colour range
 $0\unicode{x2013} 110\ \textrm {kW}\ \textrm {mm}^{-2}$) as a reference.

A major difference from the previous case is that with the TFL, vaporisation continues for a much longer period of time, that is, from 1.2 until  $53.5\ \mathrm {\mu }$s. In addition, it happens mainly along the central axis of the laser beam, which drives the bubble to grow in the same direction.
Initially, a small, rounded bubble emerges in front of the laser fibre. This is shown in figure 17, in the snapshot taken at  $1.2\ \mathrm {\mu }$s. Because the vapour phase does not absorb laser energy (
 $\mu _\alpha$ set to
 $0.001\ \textrm {mm}^{-1}$), the small bubble extends the laser beam along the axial direction. This effect can be seen in the inset images in figure 17. As a result, the liquid water next to the bubble's forward end, that is, the forward-most point along the axial direction, experiences a sudden increase in laser irradiance, which accelerates the accumulation of energy there to overcome the latent heat of vaporisation. From the simulation result, we observe the continuation of phase transition in this direction. For example, the snapshot taken at
 $2.0\ \mathrm {\mu }$s captures a bulge at the bubble's forward end, which is a newly vaporised region. At the same time, the high pressure inside the bubble also drives it to expand in both axial and radial directions. The combination of these two processes, that is, phase transition and advection, drives the bubble to grow into a long, conical shape.
Figure 18 presents the evolution of the pressure field up to  $70\ \mathrm {\mu }$s. At the beginning, the sudden increase of temperature due to the absorption of laser leads to a weak shock wave at the fibre tip. The snapshot taken at
 $1\ \mathrm {\mu }$s captures this phenomenon, where the maximum pressure is found to be less than
 $0.5\ \textrm {MPa}$. Next, the snapshot taken at
 $1.2\ \mathrm {\mu }$s captures the pressure field inside and around the initial bubble. The peak pressure inside the bubble is found to be
 $94\ \textrm {MPa}$ at this time. This high pressure drives the bubble to expand in all directions. It also generates a weak shock wave that propagates outwards, at approximately the speed of sound in liquid water. Because of the small size of the initial bubble, the pressure magnitude of this wave quickly decays to less than 1 MPa. Compared with the pressure field obtained from the Ho:YAG laser (figure 11), the main difference here is that as phase transition continues, acoustic waves keep emanating from the bubble's forward tip. This phenomenon is captured by all the snapshots taken between 2 and
 $50\ \mathrm {\mu }$s. In the current simulation, phase transition stops at
 $53.5\ \mathrm {\mu }$s. Afterwards, the pressure field becomes quiet. As shown in the snapshot at
 $70\ \mathrm {\mu }$s, the main feature is that the bubble's internal pressure is higher than the ambient value. Therefore, the bubble continues growing. By this time, it has already formed a long, conical shape.
Vapour bubble generated by a TFL: evolution of the pressure field.

Figure 19 shows the evolution of the velocity field. The inset image at  $1.2\ \mathrm {\mu }$s shows that when the initial bubble has just formed, the high internal pressure leads to high velocity in both axial and radial directions. This phenomenon is also found in the previous case (figure 12,
 $17.4\ \mathrm {\mu }$s). In the previous case, the bubble's velocity quickly starts to decrease. In the current case, however, the velocity inside the bubble remains high. This is again because of the continuation of phase transition, as it keeps adding energy to the existing bubble. In addition, multiple vortexes are observed inside the vapour bubble as shown in the snapshots at
 $70\ \mathrm {\mu }$s, which is related to the propagation of multiple acoustic waves emitted from the bubble's forward tip. Therefore, the evolution of the velocity field also suggests that phase transition plays a substantial role in the bubble's dynamics.
Vapour bubble generated by a TFL: evolution of the velocity field. The solution fields of velocity and vorticity magnitude inside the vapour bubble are shown for the time instants 15 and  $70\ \mathrm {\mu }$s, respectively.

5.3. Moses effect
Compared with liquid water, the absorption of laser by water vapour is negligible. Therefore, the formation of a vapour bubble along the path of the laser beam allows laser energy to be transmitted over a longer distance. This phenomenon, shown in figure 17, is sometimes referred to as the Moses effect, after the story of Moses parting the sea (van Leeuwen et al. Reference van Leeuwen, Jansen, Motamedi, Welch and Borst1993; Ventimiglia & Traxer Reference Ventimiglia and Traxer2019). To investigate this effect more closely, we introduce four sensor points along the central axis of the laser beam, at difference distances from the fibre tip. Their coordinates (in millimetres) are  $\boldsymbol {x}_1:(-0.3,0,0)$,
 $\boldsymbol {x}_2:(0.3,0,0)$,
 $\boldsymbol {x}_3:(1.1,0,0)$ and
 $\boldsymbol {x}_4:(2.7,0,0)$. The fibre tip is at
 $\boldsymbol {x}_0:(-0.5,0,0)$, as shown in figure 7(b). Figure 20 shows the time history of laser irradiance at the four sensor locations, as well as the fibre tip.
Vapour bubble generated by a TFL: Moses effect.

Before bubble nucleation ( $1.2\ \mathrm {\mu }$s), most of the laser energy is absorbed by a small volume of water next to the fibre tip. Although Sensor
 $1$ is only
 $0.2\ \textrm {mm}$ from the fibre tip, the laser irradiance at this point has already dropped to
 $37.6\,\%$ of the value at the fibre tip. The laser irradiance at the other sensor locations is negligible. This means without the vapour bubble, the laser cannot reach Sensors
 $2$,
 $3$ and
 $4$.
After bubble nucleation, the laser irradiance at all the sensor points starts to increase. At  $2.4\ \mathrm {\mu }$s, the bubble reaches
 $\boldsymbol {x}_1$. At this time, the laser irradiance at Sensor
 $1$ reaches the maximum value,
 $98\ \textrm {kW}\ \textrm {mm}^{-2}$. It is still lower than the laser irradiance at the fibre tip, but this is only because the laser beam has a
 $9.78^\circ$ divergence angle.
The time histories of laser irradiance at Sensors  $2$ and
 $3$ follow the same trend. As the vapour bubble's forward end gets close to the sensor, laser irradiance increases. The maximum value is reached when the bubble reaches the sensor. The maximum laser irradiance decreases along the axial direction, due to beam divergence. Sensor
 $4$ is placed at
 $3.2\ \textrm {mm}$ from the fibre tip. At
 $70\ \mathrm {\mu }$s, the bubble's forward tip is still more than
 $0.29$ mm from it. As the result, the laser irradiance at Sensor
 $4$ remains nearly zero.
In summary, the simulation result shows that the vapour bubble essentially creates a channel that allows laser to pass through. Compared to rounded bubbles, the long, conical shape obtained in the current case (both the experiment and the simulation) can be advantageous as it provides a longer channel.
6. Transition between pear-shaped and elongated bubbles
6.1. A race between advection and phase transition
Using different laser settings, we have obtained two vapour bubbles in different shapes, namely a rounded, pear-like shape shown in § 4 and a long, conical shape shown in § 5. Depending on the application, one or the other may be preferred. By examining the simulation result, we find that a major difference between the two cases is that in the first case, vaporisation only lasts for a short period of time, less than  $1\ \mathrm {\mu }$s. In the second case, vaporisation continues along the laser beam direction for over
 $50\ \mathrm {\mu }$s. It is also clear that in both cases, a newly vaporised region carries a high pressure (from the accumulated latent heat) that drives the existing bubble to expand by means of advection. Therefore, the simulation result suggests that when laser energy input is maintained in time (i.e. long-pulsed laser), the vapour bubble's shape is influenced by two factors:
(1) the speed of bubble growth by advection; and
(2) the speed of bubble growth by phase transition.
Furthermore, the simulation result indicates that the transition between pear-shaped and elongated bubbles may be related to a competition between these two speeds. At least one of the two speeds must have changed from one case to the other. In other words, at least one of them is controllable.
Unfortunately, the fluid dynamics is highly nonlinear and multi-dimensional. It is impossible to separate the two speeds from the governing equations. In order to define and examine the two speeds analytically, we resort to a simplified model problem.
As illustrated in figure 21(a), we consider an initial vapour bubble of spherical shape, with radius  $R_0$. We assume it has an internal pressure
 $p_{Go}$ that is higher than the ambient pressure
 $p_\infty$, which drives the bubble to expand. For this problem, the bubble dynamics can be modelled by the Rayleigh–Plesset equation (Brennen Reference Brennen2014). After dropping the viscosity and surface tension terms for simplicity, we get
Illustration of a simplified model problem for which the speeds of advection ( $v_{{adv}}$) and phase transition (
 $v_{{vap}}$) are defined.

 \begin{equation} R \frac{{\rm d}^2R}{{\rm d} t^2} + \frac{3}{2} \left(\frac{{\rm d} R}{{\rm d} t}\right)^2 = \frac{p_{Go}}{\rho_0} \left[\left(\frac{R_0}{R}\right)^{3\gamma} - \frac{p_{\infty}}{p_{Go}}\right], \end{equation}
where  $\rho _0$ denotes the density of the liquid phase and
 $\gamma$ denotes the specific heat ratio of the vapour phase. In this case, the bubble's dynamics is isotropic, and driven only by advection. Therefore, we define the speed of bubble growth by advection as
 \begin{equation} v_{{adv}}(t) = \frac{{\rm d} R(t)}{{\rm d} t}, \end{equation}
where  $R(t)$ is the solution of (6.1).
From (6.1), it is clear that  $v_{{adv}}$ depends on
 $p_{Go}$ and
 $R_0$. If the initial bubble is created through vaporisation,
 $p_{Go}$ is determined by the thermodynamics of water, including its latent heat of vaporisation (§ 2.4). Therefore, it may not always be adjustable. To see the effect of
 $R_0$, we first note that if we rewrite (6.1) with
 \begin{equation} \tau = \frac{t}{R_0}\quad\text{and}\quad\hat{R}(\tau)=\frac{R}{R_0}, \end{equation}
 $R_0$ can be eliminated from the equation. Specifically, we have
 \begin{equation} \hat{R} \frac{{\rm d}^2\hat{R}}{{\rm d}\tau^2} + \frac{3}{2} \left(\frac{{\rm d}\hat{R}}{{\rm d}\tau}\right)^2 = \frac{p_{Go}}{\rho_L} \left[\left(\frac{1}{\hat{R}}\right)^{3\gamma} - \frac{p_{\infty}}{p_{Go}}\right], \end{equation}
and the solution  $\hat {R}(\tau )$ is independent of
 $R_0$. In addition, substituting (6.3a,b) into (6.2) yields
 \begin{equation} v_{{adv}} = \frac{{\rm d} R(t)}{{\rm d} t} = \frac{{\rm d}\hat{R}(\tau)}{{\rm d}\tau}. \end{equation}
Therefore, changing the value of  $R_0$ leads to a linear scaling (i.e. stretching or compressing) of
 $v_{{adv}}$ in time, while the peak values remain the same. If the initial bubble is created by vaporisation,
 $R_0$ may be controlled by adjusting the spatial distribution of the heat source. For example, a more uniform distribution of the laser power on the source plane may lead to a larger
 $R_0$.
Next, we assume that at a time  $t>0$, a uniform, parallel laser beam is activated, and it creates a bulge on the bubble surface through vaporisation (figure 21b). We assume that over a short period of time, the vaporised region (i.e. the bulge) has a cylindrical shape, with a depth of
 $\Delta d_{{vap}}$. To model the continuation of vaporisation, we assume that at time
 $t$,
 $T = T_{{vap}}$ within this cylindrical region, and
 $\varLambda = l$ at
 $x=R(t)$. This assumption is justified by the results of the simulations shown in §§ 4 and 5.
The energy required to vaporise the forward end of the cylindrical region, i.e.  $x=R(t)+\Delta d_{{vap}}$, can be estimated by
 \begin{equation} \Delta E = \rho_0 [l - \varLambda(R(t)+\Delta d_{{vap}},t)], \end{equation}
where  $\rho _0$ denotes the density of the liquid phase, assumed to be a constant. The time to obtain this amount of energy from the laser beam can be estimated by
 \begin{equation} \Delta t_{{vap}} = \frac{\Delta E}{\mu_\alpha L (R(t)+\Delta d_{{vap}},t)} = \rho_0 \frac{l - \varLambda(R(t)+\Delta d_{{vap}},t)}{\mu_\alpha L (R(t)+\Delta d_{{vap}},t)}.\end{equation}
Now, we define the speed of bubble growth by phase transition as
 \begin{equation} v_{{vap}} = \lim_{\Delta d_{{vap}} \to 0^+} \frac{\Delta d_{{vap}}}{\Delta t_{{vap}}}. \end{equation}
Substituting (6.7) into (6.8), and noting that  $\varLambda (R(t),t)=l$, we get
 \begin{equation} v_{{vap}}(t) ={-}\frac{\mu_\alpha L(R,t)}{\rho_0 \left.\dfrac{\partial\varLambda}{\partial x}\right|_{x=R(t)}}. \end{equation}
The derivative  $\partial \varLambda /\partial x$ is negative, as the laser energy input decreases along the beam direction. Therefore,
 $v_{{vap}}$ is positive. It is notable that the latent heat of vaporisation,
 $l$, is not involved in (6.9). Intuitively, the latent heat represents an energy threshold for phase transition to occur. Once this threshold is reached, it may not influence the speed of bubble growth by phase transition. Equation (6.9) also indicates that
 $v_{{vap}}$ may be controlled by adjusting the laser's wavelength and power, which will lead to variations in
 $\mu _\alpha$ and
 $L$.
6.2. Testing hypothesis using simulation results
We hypothesise that a race between advection and phase transition determines the morphing of the vapour bubble. In the previous subsection, we have defined speeds  $v_{{adv}}$ and
 $v_{{vap}}$ for a simplified model problem. In real-world applications, these quantities would have to be estimated using available data. We hypothesise that at any time, if
 $v_{{adv}}$ is greater than
 $v_{{vap}}$, the bubble tends to grow spherically. If
 $v_{{adv}}$ is smaller than
 $v_{{vap}}$, the bubble tends to elongate along the laser beam direction.
This hypothesis can be tested using our simulation results. Figure 22 illustrates the method adopted here to estimate  $v_{{adv}}$ and
 $v_{{vap}}$. Although this figure only shows a solution snapshot obtained from the TFL simulation, the same estimation method is also applied to the other simulation with a Ho:YAG laser.
Illustration of the method to estimate  $v_{{adv}}$ and
 $v_{{vap}}$ using simulation results. The actual sizes of
 $\Delta d_{{adv}}$ and
 $\Delta d_{{vap}}$ used in the estimation are smaller than those shown in the figure. The temperature field is obtained from the simulation presented in § 5, at
 $t = 4.8\ \mathrm {\mu }$s.

Because vaporisation mainly continues along the laser beam direction, we estimate the advection speed,  $v_{{adv}}$, by measuring the speed of bubble expansion in the radial direction, outside the beam waist. Specifically, we define a small time interval,
 $\Delta t_{{adv}} = 0.2\ \mathrm {\mu }$s. The radial expansion of the bubble over this time interval,
 $\Delta d_{{adv}}$ (figure 22), is measured at
 $255$ time points for the Ho:YAG simulation and
 $320$ time points for the TFL simulation. At each time point,
 $v_{{adv}}$ is estimated by
 \begin{equation} \bar{v}_{{adv}} = \frac{\Delta d_{{adv}}}{\Delta t_{{adv}}}. \end{equation}
To estimate the phase transition speed,  $v_{{vap}}$, we look at the forward tip of the bubble, denoted by
 $x_{{max}}(t)$ in figure 22. We specify a small distance,
 $\Delta d_{{vap}} = 0.0015\ \textrm {mm}$, along the laser beam direction. Then, we extract the simulation result of
 $L$ and
 $\varLambda$ to evaluate (6.7), which gives us
 $\Delta t_{{vap}}$, that is, an estimate of the time needed to extend the bubble front by
 $\Delta d_{{vap}}$. Then, we estimate
 $v_{{vap}}$ by
 \begin{equation} \bar{v}_{{vap}} = \frac{\Delta d_{{vap}}}{\Delta t_{{vap}}}, \end{equation}
which is consistent with its definition in (6.8). Again, we calculate  $\bar {v}_{{vap}}$ at
 $255$ time points for the Ho:YAG simulation and
 $320$ time points for the TFL simulation.
Figure 23 shows the time histories of  $\bar {v}_{{adv}}$ and
 $\bar {v}_{{vap}}$ obtained from the two simulations. For the Ho:YAG simulation that generated a pear-shaped bubble,
 $\bar {v}_{{adv}}$ is found to be roughly two orders of magnitude higher than
 $\bar {v}_{{vap}}$ over the entire time period shown in the figure. This is consistent with the finding that in this case, bubble expansion is mainly driven by advection, whereas phase transition only lasts for less than
 $1\ \mathrm {\mu }$s. It also supports our hypothesis that if
 $v_{{adv}}$ is greater than
 $v_{{vap}}$, the bubble tends to grow spherically. For the TFL simulation that generated an elongated bubble,
 $\bar {v}_{{vap}}$ is found to be higher than
 $\bar {v}_{{adv}}$. Their difference is more than one order of magnitude in the early period of the simulation. But after
 $20\ \mathrm {\mu }$s, the difference starts to become smaller. This is consistent with the finding that in this case, phase transition continues for a long period of time, until
 $53.5\ \mathrm {\mu }$s. It also supports our hypothesis that if
 $v_{{adv}}$ is smaller than
 $v_{{vap}}$, the bubble tends to elongate along the laser beam direction.


In summary, the simulation results suggest that the transition between pear-shaped and elongated bubbles is determined by a race between advection and phase transition. These two speeds can be characterised by  $v_{{adv}}$ and
 $v_{{vap}}$, which are mathematically defined for a simplified model problem. Here
 $v_{{adv}}$ and
 $v_{{vap}}$ depend on the laser setting and the properties of the fluid medium. This conclusion can be used as a reference to explain the observations in the earlier experiments conducted by other researchers. For example, the study by Asshauer et al. (Reference Asshauer, Rink and Delacretaz1994) shows that applying a higher laser source irradiance (
 $1150$ vs
 $86\ \textrm {kW}\ \textrm {cm}^{-2}$) results in the generation of an elongated bubble instead of a pear-shaped one. This observation aligns with our conclusion, where the higher laser source irradiance leads to an increased vaporisation velocity. In addition, in real-world applications, it may be possible to obtain a preferred bubble shape by adjusting the relevant parameters based on this conclusion. For example, in our TFL experiment, the laser absorption coefficient and the source laser irradiance are both higher than their counterparts in the Ho:YAG experiment. These changes lead to a significant increase of
 $v_{{vap}}$ by about
 $2$ orders of magnitude. In comparison, the variation of
 $v_{{adv}}$ is much smaller. Therefore, the changes in laser setting make
 $v_{{vap}}$ higher than
 $v_{{adv}}$. As a result, an elongated bubble is obtained.
7. Concluding remarks
In this work, we have applied a laser–fluid computational model to study the physics behind vapour bubbles generated by long-pulsed lasers. The long pulse duration essentially means that three different physical processes, laser radiation, phase transition (i.e. vaporisation) and fluid dynamics, overlap both in time and in space. Their interaction adds complexity to the problem, but also makes it more interesting. Unlike short-pulsed lasers that usually produce spherical bubbles (assuming no influence from material boundaries), long-pulsed lasers can generate both rounded and elongated bubbles when operated in different settings.
In two separate laboratory experiments, we used a Ho:YAG laser and TFL to generate a rounded pear-shaped bubble and an elongated conical bubble. In each case, the laser power profile is also measured, and used as an input to the simulation. The computational model combines laser absorption, vaporisation and the dynamics and thermodynamics of a compressible two-phase fluid flow. The two simulations for a Ho:YAG laser and THL are performed with the same fluid parameters, such as the EOS parameters, the latent heat of vaporisation and thermal diffusivity. In both cases, the predicted bubble shape evolution matches the experimental data reasonably well. The simulation results show that the three physical processes mentioned previously interact in multiple ways, including the following.
(1) The activation of laser radiation may create a weak shock wave in the fluid flow.
(2) The absorption of laser increases the thermal energy and intermolecular potential energy of liquid water, eventually leading to its vaporisation.
(3) The nucleation of a vapour bubble creates a new material subdomain (i.e. vapour) in which laser can transmit almost losslessly.
(4) Because water has a high latent heat of vaporisation, the bubble initially has a high internal pressure, which drives it to expand rapidly.
(5) The expansion of the bubble allows laser energy to be delivered over a greater distance.
Comparing the results of the two simulations, we find that the difference in bubble shape can be attributed to the duration of phase transition. In the case of the pear-shaped bubble, vaporisation lasts for less than  $1\ \mathrm {\mu }$s. In the case of the elongated bubble, vaporisation continues along the beam direction for over
 $50\ \mathrm {\mu }$s. In both cases, the duration of the laser pulse is not a limiting factor. For example, the Ho:YAG laser that generated the pear-shaped bubble has a pulse duration of
 $70\ \mathrm {\mu }$s, much longer than the time of vaporisation.
The duration of phase transition can be explained as the result of a race between two bubble growth mechanisms, namely flow advection and the continuation of phase transition. The latter is a unique feature of long-pulse laser-induced cavitation. We hypothesise that at any time instant, if the speed of bubble growth by advection is higher than that by phase transition, the bubble tends to expand spherically. Otherwise, phase transition would occur (or continue), driving the bubble to elongate along the laser beam direction. We have formulated the two speeds using a simplified model problem, and estimated their values for the two experiments using the simulation results. The simulation results support the hypothesis. For example, the speed of bubble growth by phase transition is found to be two orders of magnitude higher in the case of the elongated bubble, whereas the speed of bubble growth by advection is about the same in the two cases. The formulae of bubble growth speeds also indicate possible ways to control the bubble shape, which can be a topic for future studies. For example, assuming the laser's power is fixed, increasing the laser absorption coefficient (e.g. by changing the laser's wavelength) and reducing the laser beam width may facilitate bubble elongation.
The computational model presented in this work is implemented in the M2C code, which is open-source under the GPLv3 license (Wang et al. Reference Wang, Ma, Zhao, Islam and Narkhede2021). For example, the models of laser radiation (§ 2.3) and phase transition (§ 2.4) are implemented mostly in LaserAbsorptionSolver.h/cpp and PhaseTransition.h, respectively. Finally, it is noteworthy that while the simulations revealed some interesting flow features inside the initial vapour bubble (see e.g. the last row of figure 9), these results have not been validated against laboratory experiments. Accurately measuring flow states inside a small cavitation bubble is challenging, and thus, this work is left for future research.
Funding
The authors gratefully acknowledge the support of the National Science Foundation (NSF) under award CBET-1751487, the support of the Office of Naval Research (ONR) under award N00014-19-1-2102, and the support of the National Institutes of Health (NIH) under awards 2R01-DK052985-26 and 1P20-DK135107-02. Gaoming Xiang also acknowledges the support from the Qilu Young Scholar program (62460082363371) of Shandong University.
Declaration of interests
The authors report no conflict of interest.


 Open access

