I. INTRODUCTION
Direct methanol fuel cells (DMFCs) convert the chemical energy of alcohol into electricity with high efficiency, and no pollution or noise. The only by-products of fuel cell operation are H2O and CO2. DMFCs are ideal for portable power applications.Reference Ren, Wilson and Gottesfeld1–Reference Heinzel and Barragan3 In the civilian arena, they can be used to power laptops, smartphones, navigation devices, and tablet computers. They can also replace generators based on noisy, polluting, and inefficient internal combustion engines for backup power applications. DMFCs have higher energy density than Li ion batteries and can offer long run times for electronic devices, which make them ideal for supplying power at remote locations far from the electricity grid. They are of interest to the modern military for providing lightweight portable power to soldiers and efficient auxiliary power for military vehicles. Methanol is easier to store and transport compared to hydrogen, is less combustible than gasoline, and can be produced from renewable resources, such as biomass. The adoption of DMFC technology can enable efficient use of natural resources, reduce dependence on imported oil, and be part of a sustainable energy economy.
At the core of the DMFC is a polymer electrolyte membrane (PEM) that is designed to separate the reactants (methanol and air), prevent electron conduction, and offer pathways for transport of hydrated protons. The main issues limiting the widespread adoption of DMFC technology are methanol crossover from anode to cathode,Reference Kamrudin, Achmad and Daud2 slow kinetics of electrode reactions, low power, high cost, and poor membrane durability under repeated voltage and temperature cycles. Nafion®, a perfluoroalkyl sulfonic acid membrane developed by Dupont Inc. (Wilmington, DE), has been the PEM of choice for fuel cell applications.Reference Mauritz and Moore4 However, Nafion has the disadvantages of high cost and significant methanol crossover. Several membranes have been proposedReference Neburchilov, Martin, Wang and Zhang5–Reference Hogarth, Diniz da Costa and Lu13 as alternatives to Nafion, but there is no available membrane that meets all the stringent demands associated with the fuel cell operating environment.
Aromatic membranes based on polymers with stiff phenyl rings in the backbone connected by various groups to impart flexibility are promising candidates to replace Nafion in DMFC applications.Reference Hickner, Ghassemi, Kim, Einsla and McGrath14, Reference Kopitzke, Linkous, Anderson and Nelson15 Polymers from the poly(ether ether ketone) (PEEK) family have attracted attention because they offer low methanol crossover, good thermal and chemical stability, and low cost.Reference Kreuer7–Reference Devanathan9 However, PEEK-based membranes can swell excessively at high hydration levels, and the proton conductivity of sulfonated poly(ether ether ketone) (SPEEK) is lower than that of Nafion under similar conditions. KreuerReference Kreuer7 has proposed that the poorer conductivity of SPEEK relative to Nafion is related to stronger binding of the excess proton to the sulfonate (SO3−) group in SPEEK. KreuerReference Kreuer8 has attributed the differences in transport properties of Nafion and SPEEK to differences in microstructure and acidity based on the results of small angle x-ray scattering (SAXS) experiments. Yang and ManthiramReference Yang and Manthiram16 have also used SAXS data to compare SPEEK and Nafion under DMFC operating conditions. SPEEK was found to have narrower pathways for water and methanol transport compared to Nafion. With increasing hydration of SPEEK, the cluster size increased and the connectivity improved.
Several strategies have been proposed for improving the performance of aromatic polymer membranes in fuel cells. Increasing the degree of sulfonation (DS), blending SPEEK with other polymers and incorporation of inorganic oxides are possible steps to control swelling and increase the fuel cell operating temperature above 80 °C.Reference Hickner, Ghassemi, Kim, Einsla and McGrath14 Such elevated temperature operation can enhance electrode kinetics and reduce the possibility of poisoning of the electrocatalysts. Hickner et al.Reference Hickner, Ghassemi, Kim, Einsla and McGrath14 have pointed out that the weaker acid groups in SPEEK relative to Nafion result in lower proton conductivity, and increasing the density of sulfonic groups to improve the conductivity of SPEEK leads to excessive swelling. Yang and ManthiramReference Yang and Manthiram17 evaluated SPEEK membranes with different DSs. A DS value of 0.5 was optimal for DMFC performance. Muthulakshmi et al.Reference Muthulakshmi, Choudhary and Varma18 have observed significant degradation of mechanical properties for DS values above 0.7.
Fu et al.Reference Fu, Manthiram and Guiver19 have synthesized and evaluated acid–base blend membranes based on SPEEK and polysulfone bearing benzimidazole groups. The membranes showed superior fuel cell performance at 90 and 100 °C relative to Nafion and SPEEK. The improved conductivity is related to facilitation of proton transfer between acid groups by the base. Knauth et al.Reference Knauth, Sgreccia, Donnadio, Casciola and Di Vona20 have synthesized sulfonated and silylated PEEK and SPEEK with TiO2 fillers. They found a percolation threshold around a hydration level of λ = 5 and inferred that hydrated protons are strongly bound to SO3− groups. λ represents the number of H2O molecules per SO3− group.
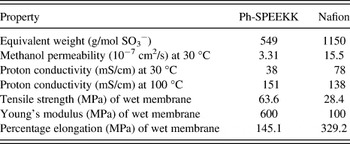
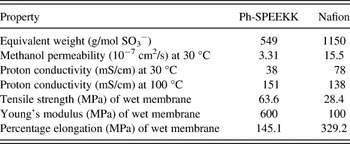
Liu et al.Reference Liu, Robertson, Kim, Guiver, Hu and Jiang21 have synthesized phenylated sulfonated poly(ether ether ketone ketone) (Ph-SPEEKK) membranes by postsulfonation of pendant phenyl groups added to aromatic poly(ether ketone)s. The resulting membrane with a DS of ∼1 showed excellent mechanical properties, thermal and oxidative stability, dimensional stability in hot water, lower methanol crossover than in Nafion, and higher proton conductivity than that of Nafion at 100 °C. Their findings are summarized in Table I. The hydrogen fuel cell performance with Ph-SPEEKK membrane at 80 °C was comparable to that with Nafion membrane.Reference Liu, Kim, Hu, Robertson, Pivovar and Guiver22 The fundamental reasons for the reduced methanol crossover with comparable conductivity of Ph-SPEEKK relative to Nafion need to be understood to facilitate the rational design of novel DMFC membranes.
Comparison of the properties of Ph-SPEEKK and Nafion membranes from the work of Liu et al.Reference Liu, Robertson, Kim, Guiver, Hu and Jiang21
Given the short length and timescales of the process of interest, molecular dynamics (MD) simulations are well suited to the study of the structure and transport properties of PEMs. Such studies have focused mainly on Nafion membranes.Reference Elliott, Hanna, Elliott and Cooley23–Reference Feng and Voth38 A few MD studies have examined SPEEK-based membranes.Reference Brunello, Lee, Jang and Qi39–Reference Lins, Devanathan and Dupuis44 Brunello et al.Reference Brunello, Lee, Jang and Qi39, Reference Brunello, Mateker, Lee, Choi and Jang40 have simulated the effect of temperature in the range from 298 to 353 K on the structure and water transport in SPEEK with DS of 0.4 for λ values of 4.9, 6.7, and 11.1. The membrane density was between 1.07 and 1.21 g/cm3. With increasing hydration, the sulfur atoms were observed to move farther apart and the average sulfur–hydronium coordination number (CN) decreased. The water diffusion coefficient was smaller than that in Nafion under similar conditions. Komarov et al.Reference Komarov, Veselov, Chu, Khalatur and Khokhlov41 simulated SPEEK chains with DS of 0.5 for λ values of 10 and 20 corresponding to densities of 1.30 and 1.19 g/cm3, respectively. They observed irregular-shaped narrow networks of water channels. The MD simulations were complemented with coarse-grained dynamic density functional theory, which revealed water network percolation at a λ value of ∼9. Mahajan and GanesanReference Mahajan and Ganesan42, Reference Mahajan and Ganesan43 have used MD simulations to study SPEEK membranes with DS of 0.4 for varying water and methanol content and density ranging from 0.86 to 1.13 g/cm3. In SPEEK, the S–S separation was larger and the backbone more hydrophobic relative to the case of Nafion. H3O+ was found to bind more strongly to SO3− in SPEEK compared to Nafion.
Recently, we performed MD simulationsReference Lins, Devanathan and Dupuis44 of hydrated Ph-SPEEKK membrane at 300 K for λ values of 3.5, 6, 11, 25, and 40. The density varied from 0.6 to 1.3 g/cm3. The results revealed a jump in H2O and H3O+ diffusion coefficients between λ values of 16 and 25. The exact structural change giving rise to the increased diffusion was not identified. A single set of simulations performed at 350 K for λ =11 showed significantly enhanced diffusion compared to that at 300 K. However, the transport properties were inferior to those of Nafion. Thus, Ph-SPEEKK appears to be better suited to DMFCs rather than hydrogen fuel cells.
These previous findings demonstrate a need to understand the differences in pore network between Nafion and Ph-SPEEKK and to evaluate the structure and transport properties of Ph-SPEEKK solvated with water and methanol. In the present work, we have performed MD simulations of Ph-SPEEKK membrane with water and methanol at 360 K for six different hydration levels. We compare these results with the results of our previous simulations of hydrated Nafion at 360 K. The results help to identify the percolation threshold in Ph-SPEEKK, to establish differences between the pore network in Ph-SPEEKK and Nafion, and to reveal an interesting change in structure and transport properties with increasing hydration.
II. MATERIALS AND METHODS
A. Materials
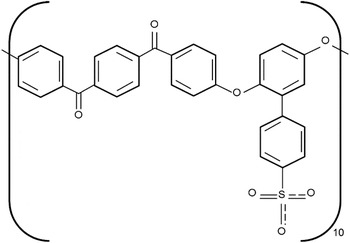
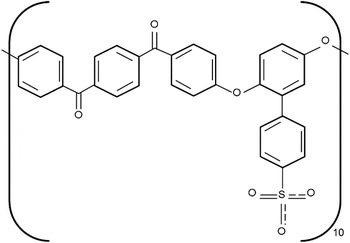
We performed MD simulations of Ph-SPEEKK membrane at 360 K using all-atom force fields. The chemical structure of Ph-SPEEKK examined in this study is shown in Fig. 1. We have presented the atomic point charges in our previous work.Reference Lins, Devanathan and Dupuis44 The polymer model consisted of 18 chains of fully sulfonated (DS = 1) 10-mer of Ph-SPEEKK with 180 H3O+ counter ions. We terminated the ends of each chain with CH3 groups. λ values of 8, 12, 16, 20, 24, and 28 were simulated. At these high hydration levels, our assumption that all the sulfonate groups are ionized is reasonable. The methanol concentration was fixed at 1.33 M for all λ values. The membrane density ranged from 1.17 g/cm3 at the lowest hydration level to 1.1 g/cm3 at the highest hydration level. This is in excellent agreement with the experimental value of the density of SPEEK membrane of 1.2 g/cm3.Reference Komarov, Veselov, Chu, Khalatur and Khokhlov41, Reference Astill45 The Nafion system simulated as a reference system at 360 K had eight chains. λ values of 3, 5, 7, 9, and 11 were simulated. Our previous results show that the water network percolates in Nafion at λ ∼ 6 and no significant change in morphology occurs at hydration levels higher than λ ∼ 11.
Illustration of the structure of the Ph-SPEEKK monomer.
B. Computational methods
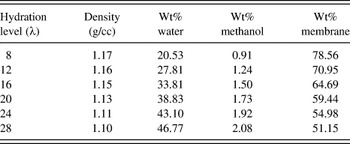
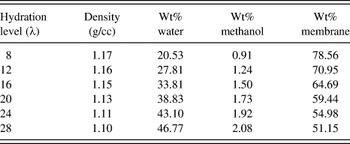
We used the DREIDING force fieldReference Jang, Molinero, Cagin and Goddard26, Reference Mayo, Olafson and Goddard46, Reference Jang, Blanco, Goddard, Caldwell and Ross47 for both Ph-SPEEKK and Nafion membranes, the force field of Jang et al.Reference Jang, Molinero, Cagin and Goddard26 for H3O+, the F3C force fieldReference Levitt, Hirshberg, Sharon, Laidig and Daggett48 for H2O, and the OPLS-AA force field for methanol.Reference Jorgensen, Maxwell and Tirado-Rives49 These force fields were also used in previous work by Brunello et al.,Reference Brunello, Lee, Jang and Qi39, Reference Brunello, Mateker, Lee, Choi and Jang40 Komarov et al.,Reference Komarov, Veselov, Chu, Khalatur and Khokhlov41 and Mahajan et al.Reference Mahajan and Ganesan42, Reference Mahajan and Ganesan43 We performed MD simulations with the DL_POLY3 codeReference Todorov, Smith, Trachenko and Dove50 and used the smooth particle mesh Ewald methodReference Essmann, Perera, Berkowitz, Darden, Lee and Pedersen51 to calculate electrostatic interactions. The cutoff distance was 10 Å and the Ewald sum precision was 10−6. We did not impose a specific geometry on the system. For each hydration well, we equilibrated the system by energy minimization and simulated annealing as described in our previous work.Reference Devanathan, Venkatnathan and Dupuis29, Reference Devanathan, Venkatnathan and Dupuis30, Reference Devanathan, Venkatnathan, Rousseau, Dupuis, Frigato, Gu and Helms37 We minimized the energy of our Ph-SPEEKK models separately at each hydration level using the steepest descent algorithm.Reference Payne, Teter, Allan, Arias and Joannopoulos52 We annealed the structure obtained from the minimization procedure in four steps as follows: (i) NVT (constant number of atoms N, volume V, and temperature T) ensemble MD simulationReference Berendsen, Postma, van Gunsteren, DiNola and Haak53 for 50 ps at 300 K; (ii) raising the system temperature from 300 to 600 K over a duration of 50 ps; (iii) NVT MD simulationReference Berendsen, Postma, van Gunsteren, DiNola and Haak53 for 100 ps at 600 K; and (iv) lowering the system temperature from 600 to 300 K in 50 ps. We repeated this four-step process five times and used the final structure as the starting configuration for equilibration with the NPT ensemble (constant number of atoms N, pressure P, and temperature T)Reference Berendsen, Postma, van Gunsteren, DiNola and Haak53 for 250 ps at 360 K to attain the final density. The density of the equilibrated system is shown in Table II. We considered the system to be equilibrated based on the good agreement between simulated membrane density and known experimental values as mentioned previously.Reference Komarov, Veselov, Chu, Khalatur and Khokhlov41, Reference Astill45 Starting with the equilibrated system, we performed constant NVT ensembleReference Berendsen, Postma, van Gunsteren, DiNola and Haak53 simulations at 360 K with thermostat relaxation time of 0.1 ps and simulation time step of 0.8 fs. The production run lasted 2 ns for each hydration level. We used the Visual Molecular DynamicsReference Humphrey, Dalke and Schulten54 program to visualize the structure of the membrane.
Density of hydrated Ph-SPEEKK membrane with 1.33 M methanol.
We calculated radial distribution functions and CNs and determined the size distribution of “water clusters” made of H2O molecules and H3O+ ions. We consider two molecules/ions to be part of the same cluster if the oxygen atoms are separated by less than 3.5 Å. This criterion is consistent with cluster analysis in the literature. From the calculation of the occurrence probability (nS) of clusters of size S, we determined the mean cluster size of all clusters excluding the largest in the system as
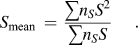
This summation is over all clusters except for the largest. We calculated the percolation threshold λp by fitting S mean to the following equationReference Rintoul and Torquato55:

Here, A is a constant and ν is a characteristic exponent.
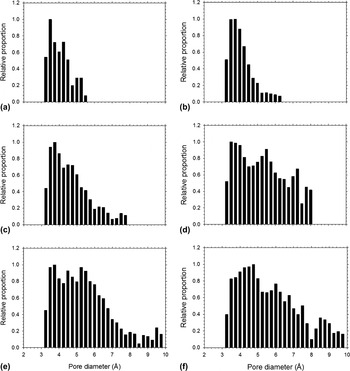
We used the pore size distribution (PSD) code of Bhattacharya and GubbinsReference Bhattacharya and Gubbins56 to calculate the PSD in Ph-SPEEKK and Nafion from a configuration at the end of the simulation, with the assumption that the pore size does not change appreciably during the nanosecond timescale of the MD simulation. For this purpose, we removed H2O and H3O+ from our hydrated systems and divided the model into a finite grid. At each grid point, we computed the diameter of the largest sphere containing the grid point that could fit in a pore. We used a minimum probe diameter of 3 Å and bin size of 0.25 Å. From this data, we obtained the histograms of pore diameters for Ph-SPEEKK and Nafion for different hydration levels at 360 K. The computational efficiency of the pore size calculation was enhanced by the use of the SOLVOPT algorithm of Kappel and Kuntsevich.Reference Kappel and Kuntsevich57
To relate the membrane pore structure to transport properties, we calculated the diffusion coefficient, D, for H2O and methanol molecules, and H3O+ ions as a function of λ as follows:
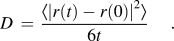
Here, 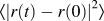 is the mean square displacement (MSD) of the oxygen and t represents time. We evaluated the MSD at 0.2 ps intervals and determined D over a 1-ns time interval from 0.1 to 1.1 ns.
III. RESULTS AND DISCUSSION
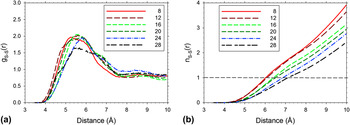
The S–S radial distribution functions (RDF) in Ph-SPEEKK is plotted in Fig. 2(a) as a function of λ. The first peak in this distribution shifts to higher separations with increasing λ from about 5.5 Å at λ = 8 to ∼5.7–5.8 Å at λ = 24–28. Mahajan and GanesanReference Mahajan and Ganesan42 have reported the occurrence of the first S–S peak consistently at a separation of 5.5 Å for λ in the range from about 2 to 25 in SPEEK. The differences in the trend in S–S separation with increasing λ between Ph-SPEEKK and SPEEK may be due to the fact that the SO3− group is at the end of a pendant in the former, while it is bonded to the backbone in the latter. Our previous workReference Devanathan, Venkatnathan and Dupuis29 has shown that the first peak in the S–S RDF shifts from a separation of 5.3–6.7 Å as λ increases from 3 to 20 in Nafion. The present work and the findings of Mahajan and GanesanReference Mahajan and Ganesan42 show that the position of the first peak in the S–S distribution varies much less with hydration in PEEK-based membranes (5.5–5.8 Å) than in Nafion (5.3–6.7 Å). This may be attributable to the greater rigidity of the backbone in SPEEK-based membranes.
(a) Radial distribution function of S–S pairs in Ph-SPEEKK for hydration levels (λ) shown in the legend; (b) corresponding CNs. The dashed horizontal line represents CN = 1.
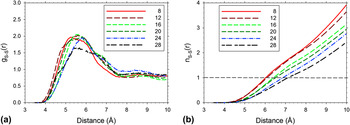
In general, the changes in the various RDFs with increasing hydration are subtle and not easily discerned. Therefore, we have examined the CNs as a function of interatomic separation rij. The CN for the ij interaction is defined as the average number of neighbors of species j within a sphere of radius rij centered on an atom of species i. The S–S CN in Ph-SPEEKK is shown in Fig. 2(b) as a function of r SS. The dashed horizontal line represents CN = 1. The radius of the sphere corresponding to CN = 1 increases from about 6 to 7 Å as λ increases from 8 to 28. In Nafion at 300 K,Reference Devanathan, Venkatnathan and Dupuis29 this radius increases from ∼5.5 to 7.9 Å as λ increases from 3 to 20. Our current work shows this radius in Nafion at 360 K to increase from 5.5 to 6.9 Å as λ increases from 3 to 11. Our recent workReference Devanathan and Dupuis58 shows that this radius in short side chain (SSC) perfluorosulfonic acid membrane, which differs from Nafion in the length of the side chain, increases from 5.3 to 6.7 Å as λ increases from 3 to 9 at 360 K. While the SO3− groups move apart in Ph-SPEEKK, Nafion, and SSC membrane with increasing λ, we find that the S–S separation is typically larger in SSC membrane than in Ph-SPEEKK and is largest in Nafion at the same λ. Previous experimental analysisReference Kreuer7, Reference Kreuer8 and simulationReference Mahajan and Ganesan42 have shown that the S–S separation in Nafion is smaller than that in SPEEK. The shorter S–S separation in Ph-SPEEKK relative to that in perfluorosulfonic acid membranes (Nafion and SSC membrane) observed in our work is a new finding that may explain the superior proton conductivity of Ph-SPEEKK relative to that of SPEEK and Nafion (see the 100 °C data in Table I). The attachment of SO3− groups to a pendant phenyl group (see Fig. 1) may be the reason behind the shorter S–S separation in Ph-SPEEKK relative to that of SPEEK.
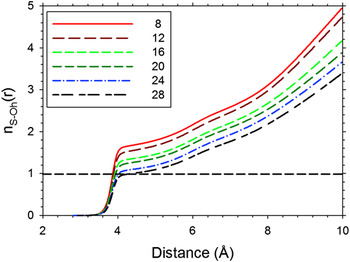
Figure 3 shows the CN of S and hydronium oxygen (Oh) in Ph-SPEEKK. The S–Oh CN decreases steadily with increasing λ, which indicates that the binding of H3O+ to SO3− is stronger at lower hydration levels as observed previously in simulations of SPEEKReference Brunello, Lee, Jang and Qi39, Reference Mahajan and Ganesan43 and Nafion.Reference Devanathan, Venkatnathan and Dupuis29 The S–Oh RDF (not shown here) showed only minor changes in the first peak. By defining the first solvation shell at a distance of 4.3 Å based on the RDF and in a manner consistent with our calculation for Nafion, we have determined the S–Oh CNs within this shell to be 1.66, 1.53, 1.34, 1.24, 1.08, and 1.00, respectively, for λ = 8, 12, 16, 20, 24, and 28. The corresponding S–Oh CNs in Nafion at 360 K are 2.07, 1.54, 1.36, 1.11, and 0.95, respectively, for λ = 3, 5, 7, 9, and 11. The much larger CNs in Ph-SPEEKK at comparable λ reflect the weaker acidity of the sulfonic acid in the aromatic hydrocarbon membrane compared to that in the perfluoroalkyl sulfonic acid membrane. Since the H3O+ remains strongly bound to SO3− (CN ≥ 1) at all hydration levels examined in Ph-SPEEKK, the decrease in CN with increasing λ is mainly due to the SO3− groups moving further apart from each other.
The sulfur–hydronium oxygen CN as a function of distance for hydration level (λ) indicated by the legend.
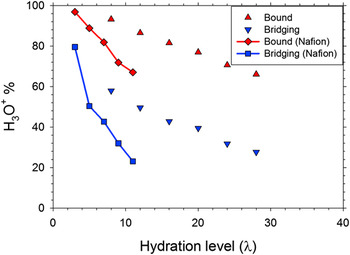
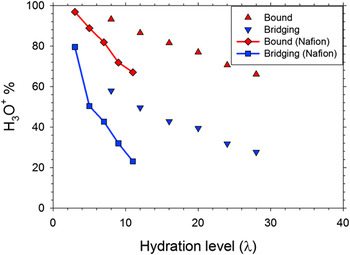
The fact that the S–Oh CN is greater than unity for most of the hydration levels examined indicates sharing of H3O+ ions by multiple sulfonate groups. The percent of H3O+ bound to at least one SO3− groups and that of H3O+ that are in bridging configurations (bound to more than one SO3−) in Ph-SPEEKK at 360 K are shown in Fig. 4. The corresponding data for Nafion at 360 K are shown in the same plot with lines through the data points. The H3O+ binding is comparable for Ph-SPEEKK at λ = 28 and Nafion at λ = 11. A much higher hydration level is needed to liberate H3O+ from SO3− in Ph-SPEEKK, which is again a reflection of the stronger basicity of the SO3− anion and therefore weaker acidity of the conjugate sulfonic acid group in Ph-SPEEKK relative to that in Nafion. At the highest λ studied (28), only a third of the H3O+ ions in Ph-SPEEKK are free to take part in proton transport.
Percentage of hydronium ions that are bound to at least one SO3− group (triangle up) and multiple SO3− groups (triangle down) in Ph-SPEEKK. The corresponding values in Nafion are shown by diamonds and squares, respectively. Lines have been drawn through the Nafion data to distinguish them from the Ph-SPEEKK data and to guide the eye.
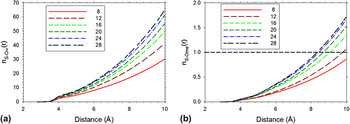
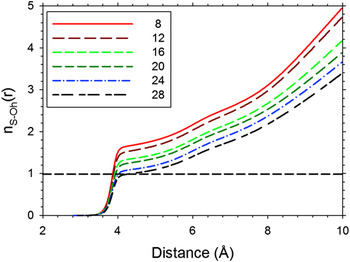
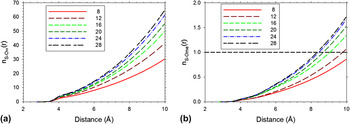
In addition to H3O+ coordination, we have also examined H2O oxygen (Ow) and CH3OH oxygen (Ome) coordination near S atoms. The number of H2O and CH3OH molecules in the vicinity of SO3− is shown in Figs. 5(a) and 5(b), respectively. The CN of both molecules increase with increasing λ. The CN within the first solvation shell (within a distance of 4.3 Å from the S atom) is not significantly changed by changes in the hydration level. Much of the increase in CN occurs outside the first solvation shell. For instance, the H2O CN within the first solvation shell of the SO3− group increases from ∼3.1 to about 5.1 when λ increases from 8 to 28, but the corresponding CN for a sphere of radius 10 Å increases from ∼30 to 65. Since we use a constant methanol concentration of 1.33 M throughout our simulation, the number of methanol molecules in the simulation cell increases when λ increases. When the numbers of H2O and CH3OH molecules per SO3− group increase, the additional molecules stay away from the SO3− groups and are free to diffuse through the membrane. The dashed horizontal line in Fig. 5(b) represents CN = 1. It is interesting to note that the radius of a sphere around S that contains one methanol molecule is greater than 8 Å at all hydration levels. It is evident that methanol avoids the sulfonate group in Ph-SPEEKK. Mahajan and GanesanReference Mahajan and Ganesan42 have argued that water and methanol may compete to occupy the first solvation shell of the sulfonate anion in the aromatic membrane SPEEK. Our Ph-SPEEKK results show that this is unlikely. The methanol CN in the first solvation shell of SO3− ranges from 0.05 at λ = 8 to 0.08 at λ = 28 according to Fig. 5(b). Given that the corresponding CNs for water are 3.1 and 5.1, the methanol concentration in the first solvation shell of SO3− is more dilute than that in the bulk. Methanol is likely to have a negligible effect on the water–sulfonate interaction for the methanol concentrations typically used in DMFCs (0.5–2 M).
(a) Sulfur–water oxygen CN and (b) sulfur–methanol oxygen CN as a function of distance for hydration level (λ) indicated by the legend.
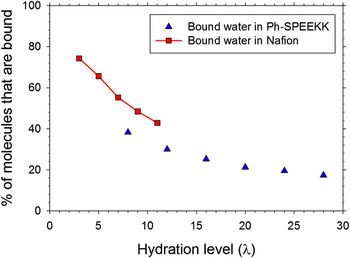
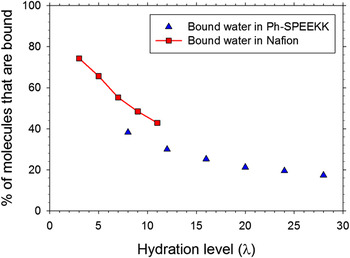
The binding of H2O to SO3− can be quantified by determining the percent of H2O molecules that correspond to Ow–S separation of less than 4.3 Å. These data are shown in Fig. 6 for Ph-SPEEKK and Nafion at 360 K. With increasing hydration, the proportion of bound H2O decreases in both membranes, and more H2O molecules are available to facilitate proton transport. However, it appears that at comparable λ values of ∼10, there are fewer bound water molecules in the aromatic membrane. The stronger binding of H3O+ to SO3− in Ph-SPEEKK relative to Nafion reduces the possibility of H2O molecules approaching SO3− in Ph-SPEEKK membrane compared to the case of Nafion. Solvent-separated ion pairs observed in Nafion are less likely to form in Ph-SPEEKK membrane.
Percent of bound water molecules in Ph-SPEEKK (triangles) and Nafion (squares) at 360 K. A line has been drawn through the Nafion data to guide the eye.
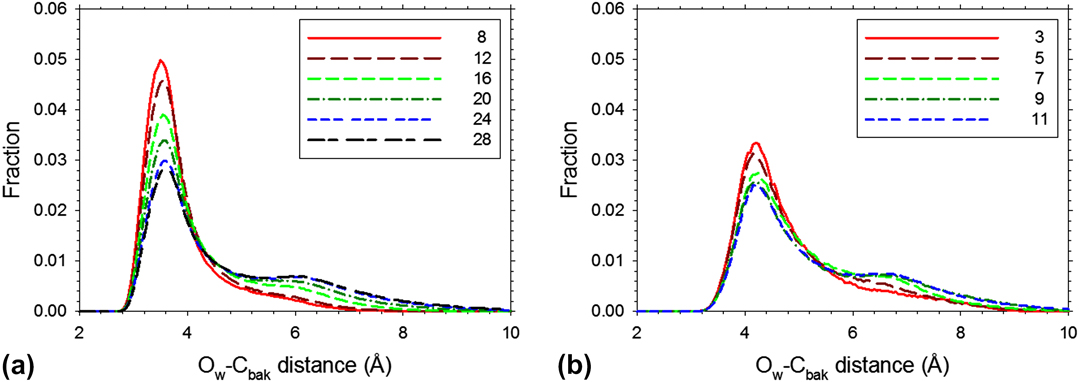
In light of the finding that water and methanol do not bind strongly to the sulfonate groups in Ph-SPEEKK, it is of interest to examine their interaction with the aromatic backbone. We have calculated the distribution of the distance between water oxygen (Ow) and the nearest backbone carbon atom (Cbak) by averaging over the water molecules from configurations stored at 1 ps intervals in the MD trajectory. This result is plotted in Fig. 7(a) for Ph-SPEEKK and Fig. 7(b) for Nafion. The most probable nearest Ow–Cbak distance is 3.5 Å in Ph-SPEEKK and 4.2 Å in Nafion at 360 K. As λ increases, the height of this first peak decreases and a second peak forms at ∼6.1 Å in Ph-SPEEKK and ∼6.8 Å in Nafion. These results show that water molecules move away from the backbone and the sulfonate groups and move into the bulk as the hydration level increases. The H2O molecules are located much closer to the backbone carbon atoms in Ph-SPEEKK than in Nafion, which shows that the backbone is less hydrophobic in Ph-SPEEKK. The findings discussed above are consistent with Kreuer’s experimental interpretationReference Kreuer7, Reference Kreuer8 that aromatic membranes have less acidic sulfonate groups and less hydrophobic backbones compared to those in Nafion.
The distribution of the distance between water oxygen and its nearest carbon backbone atom in (a) Ph-SPEEKK and (b) Nafion at 360 K.
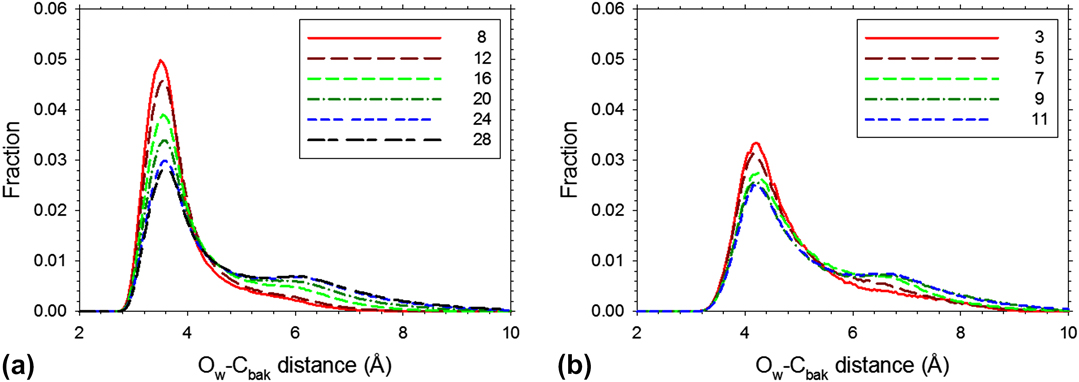
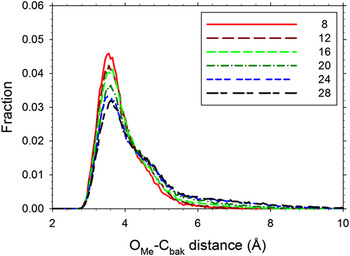
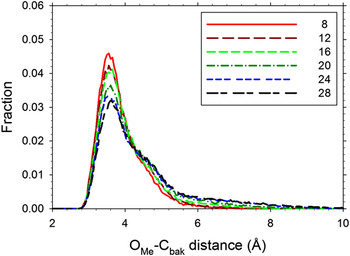
Figure 8 shows the distribution of distances between the methanol oxygen (Ome) and the nearest backbone carbon atom in Ph-SPEEKK at 360 K. As in the case of water oxygen, the most probable nearest neighbor distance with the backbone carbon for methanol oxygen is about 3.5 Å. The distance of closest approach (left extreme of the distribution) is about 2.8 Å. With increasing hydration, the peak at 3.5 Å decreases in height and broadens, but unlike the case of water, a second peak does not form. The picture that emerges from this study is of methanol staying close to the backbone and away from both the SO3− groups and the free water region (center of the water cluster) in Ph-SPEEKK.
The distribution of the distance between methanol oxygen and its nearest carbon backbone atom in Ph-SPEEKK at 360 K.
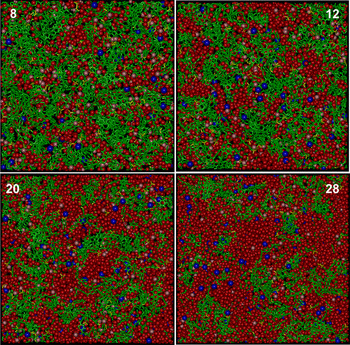
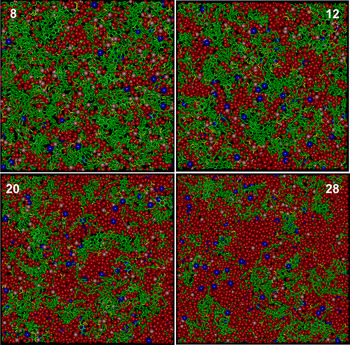
We have used molecular visualization to confirm the results discussed above, and the projection of atomic positions in Ph-SPEEKK is presented in Fig. 9 for λ = 8, 12, 20, and 28. The membrane is represented by bonds, methanol by large blue beads, and water by red spheres. At λ = 8, the water channels appear to be narrow and tortuous as suggested by KreuerReference Kreuer7, Reference Kreuer8 based on analysis of SAXS experiments. As λ increases, the water channels increase in width, but they remain highly branched. At very high λ (28), the water channels become wide and well connected. The conventional picture of narrow tortuous water channels in SPEEK-based membranes is not correct at high λ values. The methanol molecules and hydronium ions stay away from the center of the water channels at all hydration levels studied. The hydronium ions are found mainly in the vicinity of sulfonate groups.
The morphology of hydrated Ph-SPEEKK with methanol for hydration levels (λ) of 8, 12, 20, and 28. The membrane is shown in green, sulfonate groups in yellow, methanol in blue, water in red, and hydronium ions in pink.
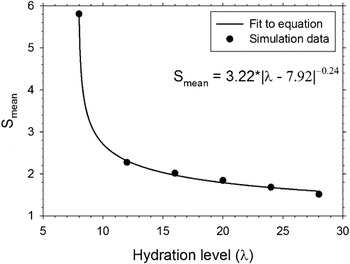
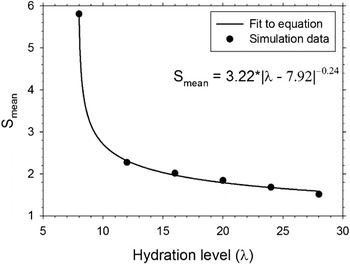
We have examined the change in water clustering with increasing λ using percolation analysis. The mean size of all clusters except the largest cluster, S mean, is shown as a function of hydration level in Fig. 10 and fitted to Eq. (2). From this fit, we obtained a value of 7.92 of λ for the percolation threshold in Ph-SPEEKK, which is higher than the value between 5 and 6 that we previously calculated in Nafion.Reference Devanathan, Venkatnathan, Rousseau, Dupuis, Frigato, Gu and Helms37 Thus, λ = 8 in Fig. 9 is close to the percolation threshold, while the other λ values are all above the threshold. This finding is in good agreement with the dynamic density functional theory study of SPEEK by Komarov et al.Reference Komarov, Veselov, Chu, Khalatur and Khokhlov41 that the percolation threshold lies at λ ∼ 9. Our results are also consistent with the cluster size analysis in SPEEK by Mahajan and Ganesan.Reference Mahajan and Ganesan42
The average cluster size, calculated by excluding the largest cluster, as a function of hydration level in Ph-SPEEKK membrane.
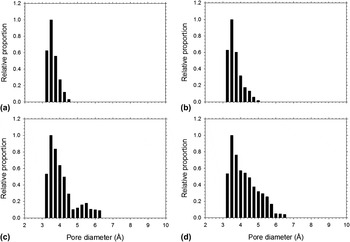
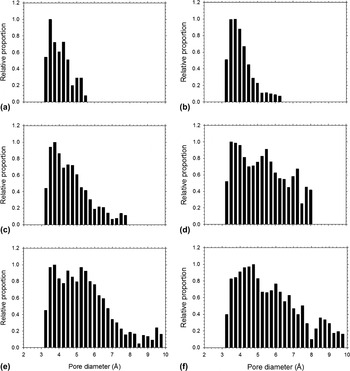
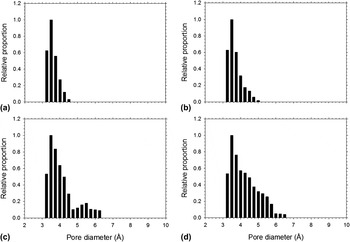
Further insights into the differences between the morphology of hydrated Ph-SPEEKK and Nafion can be obtained from the PSD shown in Fig. 11 for Ph-SPEEKK and Fig. 12 for Nafion. At the percolation threshold (λ =8), the PSD in Ph-SPEEKK is quite narrow and centered around 3.5 Å. The distribution develops a tail at larger diameters up to about 7.7 Å as λ increases from 8 to 16. The PSD in Nafion is very narrow at λ =3. At λ = 7, the PSD in Nafion is comparable to the PSD at λ = 12 in Ph-SPEEKK. This finding is consistent with the experimental inference of Yang and ManthiramReference Yang and Manthiram16 that the transport pathways in SPEEK-based membranes are narrower than those in Nafion. At the same time, the present simulations go beyond current understanding by showing that the pore morphology in Nafion and Ph-SPEEKK is not static as in the simple models inferred based on experiments but evolves significantly with changes in hydration level. The PSD in Ph-SPEEKK can become comparable to that in Nafion, but it takes a higher hydration level in Ph-SPEEKK to achieve this parity. When the hydration level is increased beyond 16 in Ph-SPEEKK, the peak in the PSD shifts to a higher diameter of about 5 Å and a second peak appears around 9 Å at the highest hydration levels studied (24 and 28). This is supported by the visualization of atomic projections in Fig. 9. At the highest λ values, not only does the typical pore become wider, but also there is the development of a small number of very wide pores. This is likely to be the source of the excessive swelling that is known to occur in SPEEK-based membranes. The bimodal distribution seen at λ = 24 and λ = 28 corresponds to wide pores connected to each other by narrower connectors. Such a well-developed water network should lead to transport properties comparable to or even superior to those of Nafion membrane. This result explains the significant jump in H2O and H3O+ transport properties that we observed previouslyReference Lins, Devanathan and Dupuis44 in Ph-SPEEKK at 300 K when λ increased from 16 to 25.
The distribution of pore diameters in Ph-SPEEKK for hydration level (λ) of (a) 8, (b) 12, (c) 16, (d) 20, (e) 24, and (f) 28.
The distribution of pore diameters in Nafion for hydration level (λ) of (a) 3, (b) 5, (c) 7, and (d) 9.
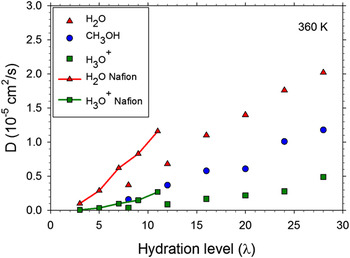
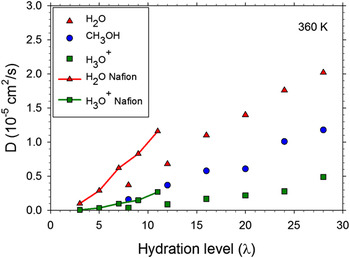
The diffusion coefficients of water, methanol, and hydronium in Ph-SPEEKK at 360 K are plotted as a function of hydration level in Fig. 13. The data for H2O and H3O+ in Nafion at 360 K are also plotted in the same figure. The diffusion coefficients of H2O, CH3OH, and H3O+ all increase with increasing λ, with the value for H2O being the highest and that for H3O+ being the lowest at a given λ. The H2O and H3O+ diffusion coefficients in Ph-SPEEKK are smaller than the respective values in Nafion at comparable hydration levels. The diffusion coefficient of H2O in Ph-SPEEKK at λ = 28 is nearly twice than in well-hydrated Nafion (λ = 11). This arises from the well-developed pore network in Ph-SPEEKK at λ = 28 and the fact that the H2O molecules are mostly free from binding by the SO3− groups. In contrast, the H3O+ diffusion coefficient in Ph-SPEEKK at λ = 24 is comparable to that in Nafion at λ = 11. Similarly, this value for Ph-SPEEK at λ =12 is comparable to that in Nafion at λ = 7. The diffusion coefficient of H3O+ does not show the dramatic increase seen in the H2O diffusion coefficient relative to the values in Nafion because of the very strong binding of the H3O+ to the SO3− at all hydration levels. This is especially clear, when one sees the trends in the diffusion of CH3OH. Between λ = 20 and λ = 24, there is a substantial increase in methanol diffusion coefficient, which can be related to the formation of wide pores with diameter of about 9 Å as seen in Fig. 11. The diffusion coefficients of water, methanol, and hydronium at λ = 20 are 1.40 × 10⁻⁵, 0.61 × 10⁻⁵, and 0.22 × 10⁻⁵ cm2/s, respectively. The corresponding values at λ = 24 are 1.76 × 10⁻⁵, 1.01 × 10⁻⁵, and 0.28 × 10⁻⁵ cm2/s. The enhancement of methanol transport occurs without a correspondingly large increase in hydronium transport in this range of λ values. Since CH3OH is not bound to SO3−, it can diffuse rapidly through the wider pores leading to enhanced methanol crossover. Knauth et al.Reference Knauth, Sgreccia, Donnadio, Casciola and Di Vona20 and Mecheri et al.Reference Mecheri, D’Epifanio, Traversa and Licoccia59 have shown that composite membranes containing hydrated oxides in a SPEEK matrix can reduce methanol crossover while maintaining reasonable proton conductivity. Such a strategy can be adopted in Ph-SPEEKK to inhibit methanol transport through the wide pores that develop at the high hydration levels needed for good proton conductivity.
The diffusion coefficients of water (triangle up), methanol (circle), and hydronium (square) in Ph-SPEEKK as a function of hydration level at 360 K. The corresponding data for water and hydronium in Nafion are shown with lines drawn through the data points.
IV. CONCLUSIONS
We have used molecular modeling to shed light on pore structure, water percolation, and ion and molecule transport in Ph-SPEEKK membranes and compared them to corresponding properties in hydrated Nafion. The pendant sulfonic acid groups are less acidic and the backbone is less hydrophobic in Ph-SPEEKK compared to the corresponding properties in Nafion. The backbone is also more rigid in Ph-SPEEKK than in Nafion as evidenced by the changes in the separation of sulfonate groups with increasing hydration. There is stronger binding of hydronium ions to sulfonate groups in Ph-SPEEKK relative to Nafion, which inhibits proton conductivity at low hydration levels in the former. Methanol is transported mainly along the polymer backbone in Ph-SPEEKK.
The present work has provided insights into the molecular-level differences in the morphology of aromatic backbone and perfluoro alkyl sulfonic acid membranes. In contrast to previous static descriptions of the membrane morphology, we find that the pore size in Ph-SPEEKK is not always narrow relative to the pore size in Nafion and can evolve dynamically with increasing hydration level. We have related the substantial improvement in ion and molecular transport and the occurrence of excessive swelling for λ > 16 in Ph-SPEEKK to dynamic changes in the pore network. At these high hydration levels, the water network is no longer made of narrow and irregular segments but instead consists of wide well-connected channels. The excellent proton conductivity of Ph-SPEEKK observed at 100 °C in the experiments of Liu et al.Reference Liu, Robertson, Kim, Guiver, Hu and Jiang21 can thus be related to the rapid diffusion of water through wide pores. Such rapid transport can help shuttle protons between SO3− groups in the membrane. The present results also show that SO3− groups are clustered closer in Ph-SPEEKK than in Nafion or SPEEK, which can explain the enhanced proton conductivity of Ph-SPEEKK relative to that of SPEEK. This study provides an explanation for methanol crossover becoming a problem in SPEEKK-based membranes at extremely high hydration levels. While elevated temperature and high hydration levels can enhance ion transport in Ph-SPEEKK, this benefit comes with undesirable enhancement of methanol crossover. Novel membrane design strategies are needed to mitigate methanol crossover while retaining good proton conductivity.
ACKNOWLEDGMENTS
This work was supported by the US Department of Energy, Office of Basic Energy Sciences, Chemical Sciences, Geosciences and Biosciences Division, under Contract DE-AC05-76RL01830. It was performed in part using the Molecular Science Computing Facility in the EMSL, a national scientific user facility sponsored by DOE’s Office of Biological and Environmental Research located at Pacific Northwest National Laboratory (PNNL). PNNL is operated by Battelle for DOE. This work benefited from resources of the National Energy Research Scientific Computing Center, which is supported by the Office of Science of DOE under Contract No. DE-AC02-05CH1123.