Introduction
Competition for radiation, nutrients, and water is the most studied crop–weed interaction in agricultural ecosystems (Tilman Reference Tilman1982). However, there are important noncompetitive crop–weed interactions that result in changes in the microenvironment due to crop presence. These changes include variations in temperature (Jha and Norsworthy Reference Jha and Norsworthy2009; Norsworthy Reference Norsworthy2004), solar radiation (Kasperbauer Reference Kasperbauer1987; Norsworthy Reference Norsworthy2004), and moisture (Baldocchi et al. Reference Baldocchi, Verma and Rosenberg1983).
In addition, the crop canopy can change light quality (Kasperbauer Reference Kasperbauer1987), affecting morphology and physiology of neighboring weed plants, which show responses such as “shade-avoidance.” These are characterized by accelerated stem growth, retarded leaf development, and strengthened apical dominance and are mediated by phytochromes in response to shifts in the radiation red–far red ratio (R-FR) and blue radiation (Ballaré Reference Ballaré1999).
The crop canopy can modulate the environment where the maternal weed plant grows during seed production and maturation, affecting seed size, composition, dormancy, and germination. These effects are known as maternal effects (Roach and Wulf Reference Roach and Wulf1987) and have been studied in many species and under many different environmental conditions such as radiation, radiation quality, day length, soil moisture, and mineral nutrients (Fenner Reference Fenner1991; Gutterman Reference Gutterman and Fenner2000; Roach and Wulf Reference Roach and Wulf1987). Seeds maturing on the same plant may experience different environmental conditions according to their position relative to the crop canopy. Crop canopy presence modifies soil thermal amplitude (Baldocchi et al. Reference Baldocchi, Verma and Rosenberg1983; Norsworthy Reference Norsworthy2004; Young et al. Reference Young, Sheeja, Narváez, Srivastava, Shuerger, Wright and Marois2012), mean temperature (Norsworthy Reference Norsworthy2004), vapor pressure (Baldocchi et al. Reference Baldocchi, Verma and Rosenberg1983), and R-FR ratio (Kasperbauer Reference Kasperbauer1987; Norsworthy Reference Norsworthy2004); these modifications may vary according to crop structures related to plant density, row spacing, and in the case of soybean [Glycine max (L.) Merr.], genotypes (maturity group) (Norsworthy Reference Norsworthy2004). Therefore, seeds maturing in shaded positions could receive less radiation, lower R-FR ratio, and lower temperatures than those maturing above the canopy on the same plant. Differences in the environment experienced by seeds on the maternal plant during seed development and maturation may affect seed dormancy and, therefore, condition the timing of emergence in the next season. In a previous study, drought stress experienced by the maternal plant in wild oat (Avena fatua L.) reduced seed dormancy level, resulting in earlier seedling emergence the subsequent season (Gallagher et al. Reference Gallagher, Granger, Snyder, Pittmann and Fuerts2013). This anticipated emergence reduced seedbank persistence compared with seeds from non-stressed plants (Gallagher et al. Reference Gallagher, Granger, Snyder, Pittmann and Fuerts2013).
Large crabgrass [Digitaria sanguinalis (L.) Scop.] is a summer annual weed distributed throughout tropical and temperate regions around the world (Holm et al. Reference Holm, Plunkett, Pancho and Herberger1991). In Argentina, since the adoption of no-till systems 20 yr ago, the number of fields where this weed is found has increased, with it being present in more than 80% of fields (de la Fuente et al. Reference de la Fuente, Suárez and Ghersa2006). The persistence of this weed over time is due to its high seed production (Norris Reference Norris2007) and its extended period of emergence in the field, which allows some seedling cohorts to escape control (Gallart et al. Reference Gallart, Mas and Verdú2010). Despite D. sanguinalis being a problematic weed in different crops, research about crop–weed interactions is limited to a few crops. Also, those studies mainly focus on the competitive effect of the weed on the crop production and yield losses but not on the noncompetitive effects of crops on the biology of the weed.
Although there is research examining the maternal effects on seed dormancy, most are based on artificial canopies, considering the variation in single environmental factors. There are just a few field studies with natural crop canopies and their effect on seed dormancy level (Nurse and DiTommaso Reference Kirby and Faris2005), and no studies have evaluated the impact of soybean crop structure on D. sanguinalis performance. The objectives of this work were to study (1) how soybean crop structure modifies the environment under the canopy and D. sanguinalis plant structure, biomass, and seed production and dormancy; and (2) the relative importance of these environmental changes (temperature, humidity, R-FR ratio, and radiation) on the weed’s characteristics.
Materials and Methods
Field Experiments
Three field experiments were conducted during the 2008 to 2009, 2009 to 2010, and 2010 to 2011 seasons (years 1, 2, and 3, respectively) at the Facultad de Agronomía, Universidad de Buenos Aires, Argentina (34.60°S, 58.38°W), in a completely randomized block design with five replicates.
The soil was a Vertic Argiudoll with 4.1 % organic matter, pH of 5.9, 2.06 g N kg−1 (total by Kjeldahl), 78.4 mg P kg−1, and 2.6 cmolc K kg−1 (0- to 20-cm layer) measured before the first experiment was established. The research area was moldboard plowed and disked once, and spike-tooth harrowed in mid-spring. Before sowing, soybean seeds were inoculated with Bradyrhizobium japonicum (Nitragin Optimize®, 3ml kg−1 seed, 753 10th Street, Pilar, Buenos Aires, Argentina). Glyphosate-resistant (Roundup Ready®) soybean cultivars (‘Don Mario 3100®’, MG3; ‘Don Mario 4670®’, MG4) (DonMario Semillas, Chacabuco, Buenos Aires, Argentina) were sown on November 3, 2008, November 27, 2009, and November 17, 2010. In year 1, soybean was sown by hand at 0.15 and 0.45 m (narrow and wide interrow spacings); in years 2 and 3, soybean was sown by sowing machine at 0.175 and 0.52 m (narrow and wide interrow spacings). At stage V1 (Fehr and Caviness Reference Fehr and Caviness1977), plants were thinned to 40 plants m−2 density. Immediately after soybean was thinned, 90 D. sanguinalis seeds per plot were sown in the middle of the interrows to increase the effects on weed performance between the interrow treatments and to avoid the border effects. Weed seedlings (2- or 3-leaf) were thinned to have 9 plants per plot (1.8 m by 2 m), homogenously distributed in half the plot. Water stress was prevented by means of irrigation, maintaining soil water content near field capacity throughout the experiment. According to soil analysis, no fertilization was needed to cover the nutritional needs of the crop. Plots were maintained weed-free by hand weeding throughout the growing season, except for the species of interest. Fungicides (Sphere Max®, trifloxystrobin [37.5 g ai L−1] + cyproconazole [16 g ai L−1], dose 0.15 L ha−1, Bayer Argentina, 3652 R. Gutierrez, Munro, Buenos Aires, Argentina), and insecticides (Xiper®, cypermethrin, 25% ai L−1, dose 0.1 L ha−1, UPL Argentina S.A., 3333 Scalabrini Ortiz, Buenos Aires, Argentina) were applied as needed to maintain crop and weed health.
Data Collection
Incident radiation (RADinc) was measured using a line quantum sensor (BAR-RAD 100, Cavadevices, Buenos Aires, Argentina) placed at the center of the plot above the canopy (1.5-m height) and beneath the canopy at two random locations, obliquely to the soybean rows (45° to the rows and crossing the rows), looking northward, to calculate percentage of intercepted radiation according to the following equation:
 $\rm{intRAD=\frac{((a-b))\over(a\times100)}}$
where intRAD represents the percentage of intercepted radiation, a is the quantity of photosynthetic photon flux density (PPFD) above the soybean canopy, and b is the PPFD at the soil surface beneath the soybean canopy. The R-FR ratio was measured with a sensor (SKR 110 660/730 sensor, Skye Instruments, Llandrindod Wells, Wales, UK) on clear days, starting at noon (12 AM), looking northward, by placing the sensor 5 cm above the soil surface in the center of the interrow space and taking three values (which were later averaged): upward, to the right, and to the left. All radiation and R-FR ratio measurements were taken on cloudless days within 1.5 h of solar noon, approximately every 15 d but with some variance due to meteorological conditions. Air temperature and humidity were measured, every hour at 15 cm above the soil surface using sensors and data loggers (Schwyz, DAT 10®,Buenos Aires, Argentina) in years 2 and 3.
At the weed flowering stage (anthers exposed for at least 50% of the plants), four D. sanguinalis plants from each plot were randomly selected to measure plant height from the bottom of the plant to the bottom of the highest panicle. At the end of the experiment, the same plants were harvested to determine aboveground biomass and total number of tillers per plant. Aboveground biomass was determined drying samples at 70 C until a constant weight was reached. Approximately every 10 d, mature seeds were collected by shaking the panicles into paper bags, weighing the seeds in the laboratory, and estimating the number of seeds per plant according to the 1,000-seed weight; 250 seeds from each treatment were put immediately into the germination chambers to test seed dormancy level.
Germination Tests
Seeds were placed in 9-cm-diameter petri dishes with two paper filters (Double Rings, Analen, Buenos Aires, Argentina), arranged in five replicates per treatment and 50 seeds per replicate. Distilled water (4 ml) was added to each dish at the beginning of the tests, and then dishes were sealed with Parafilm® to avoid evaporation. Seeds collected in the experiments were placed in germination chambers 20/30 C (16/8 h), reproducing the optimal germination conditions for this species (Oreja et al. Reference Oreja, de la Fuente and Batlla2017). Germination (radicle emergence) was recorded at regular intervals until no further seeds germinated, and water was added as required when germination was checked. In all the tests, the incubation period did not exceed 30 d. At the end of each incubation period, viability in nongerminated seeds was tested with a 1% tetrazolium (2.3.5-triphenyl-2H-tetrazolium chloride) (ISTA 1999). As seed production from plants that had been growing in soybean crop treatments were very scarce or null in some treatments, it was not possible to adequately evaluate the seed dormancy level for all the factors, as was established in the “Data Collection” section above. Therefore, seeds from plants growing with the soybean crop, independent of row spacing and soybean maturity group, were pooled and evaluated as a single group as seeds from weed plants growing with the crop. This group was compared with seeds from plants growing without the crop.
Data Analysis
Weed characteristics (biomass, tillers per plant, seeds per plant, and plant height) were analyzed as percentage of variation according to D. sanguinalis plant performance growing without crop presence and were subjected to ANOVA for a 2-yr (2008 to 2009 and 2010 to 2011), two interrow spacing (narrow and wide), and two soybean maturity group (MG3 and MG4) factorial treatment arrangement. Interrow spacing and soybean maturity group were considered fixed effects, and years and blocks were considered random effects. Significant differences (P < 0.05) between years were observed for temperature variables and humidity; these environmental variables were therefore analyzed separately for each year. A Tukey’s multiple comparison test was performed after the ANOVA to determine significant differences at the 5% level (P < 0.05) using a generalized linear model procedure in InfoStat software (InfoStat, 2010 version, InfoStat Group, FCA, National University of Córdoba, Córdoba, Argentina). When factorial analysis showed significant interactions between main effects (year, crop–weed interaction, interrow spacing, and soybean maturity group), factors were analyzed separately. The assumptions of the ANOVA (random, homogenous, and normal distribution of residuals) were tested using Shapiro-Wilk and Levene’s tests and by visually observing the residuals. If the assumptions of variance were not met, cumulative germination percentages were square-root-arcsine transformed (Bartlett Reference Bartlett1947), and the other variables were transformed by square root. Adjusted means were back-transformed for graphical presentation in figures.
Data for seed germination were subjected to ANOVA for a 3-yr (2008 to 2009, 2009 to 2010 and 2010 to 2011) by two crop–weed interaction (with and without crop) factorial arrangement. Year and crop–weed interaction were considered as fixed effects and replicates as a random effect.
Principal component analysis (PCA) (Krzanowski Reference Krzanowski2000) was done using PC-ORD Multivariate Analysis of Ecological Data v. 5.0. (McCune and Mefford Reference McCune and Mefford1999). Environmental data measured under different crop canopies for the three years (1, 2, and 3) were used as explanatory variables of the PCA, and weed characteristics were used to identify weed responses to environmental variations related to treatments. Biplots (Krzanowski Reference Krzanowski2000) were used to display associations between treatment combinations and environment and weed characteristics.
Results and Discussion
Environment under the Soybean Canopy
The soybean crop canopy modified the environmental factors measured in this work: daily average, daily maximum, daily minimum, and daily alternating temperatures; daily humidity; radiation; and R-FR ratio.
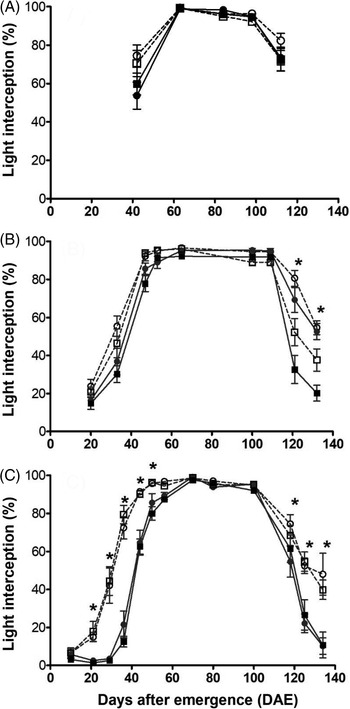
Intercepted radiation increased after emergence, as was described by Stoller and Myers (Reference Stoller and Myers1989). By 65 d after emergence (DAE), all treatments with soybean crop reached 95% intercepted radiation, but treatments with narrow row spacing reached this value 15 d earlier (Figure 1), when the crop was at stage R3-R4. Similar results were previously observed at row spacings of 0.19 and 0.96 m, with 95% intercepted radiation being reached at 40 and 70 DAE, respectively (Norsworthy Reference Norsworthy2004). MG3 soybean at wide row spacing intercepted less radiation than MG4 in narrow rows at 120 DAE (P < 0.05) (Figure 1B). Then, at 125 DAE, narrow row spacing intercepted less radiation than wide row spacing (Figure 1C). Similar results were described by Crotser and Witt (Reference Crotser and Witt2000), who found that MG4 intercepted more radiation than MG3 due to the longer cycle and delayed senescence. Narrow row spacing (Knezevic et al. Reference Knezevic, Evans and Mainz2003) and later MG (Nordby et al. Reference Nordby, Alderks and Nafziger2007) increase soybean competitive ability with weeds by intercepting higher radiation during the cycle. Increasing the competitive ability of crops through higher interception of radiation is effective in reducing biomass and fecundity of weeds (Borger et al. Reference Borger, Hashem and Powles2016).
Percentage of radiation intercepted by the crop (A–C) during experiments for soybean maturity group (MG3, squares; MG4, circles) and row spacing (wide spacing, closed symbols; narrow spacing, open symbols) treatments of Digitaria sanguinalis for years 1 (A), 2 (B), and 3 (C). An asterisk (*) indicates significant differences among treatments on the same date.

Daily average, maximum, and alternating temperatures were lower under the canopy in both years (2 and 3), and daily minimum temperatures were higher (year 3) under the canopy (Table 1). These results agree with those of Norsworthy (Reference Norsworthy2004), Baldocchi et al. (Reference Baldocchi, Verma and Rosenberg1983), and Young et al. (Reference Young, Sheeja, Narváez, Srivastava, Shuerger, Wright and Marois2012), who reported reductions of maximum temperatures and, therefore, of alternating temperatures, but not of minimum temperatures. Without the crop, significantly lower (P < 0.05) daily average humidity was observed compared with the MG3 with narrow row spacing treatment (year 2) and the rest of the treatments (year 3) (Table 1). Daily humidity was higher under the crop canopy than without the crop, mainly compared with narrow row spacing treatments. This result agrees with that of Baldocchi et al. (Reference Baldocchi, Verma and Rosenberg1983), who found humidity at 0.5 m beneath the canopy was higher than at 0.5 m above the canopy, but disagrees with that of Young et al. (Reference Young, Sheeja, Narváez, Srivastava, Shuerger, Wright and Marois2012), who observed no differences beneath or above the soybean crop canopy at 0.76-m row spacing. According to Sauer et al. (Reference Sauer, Singer, Prueger, DeSutter and Hatfield2007), radiation intercepted by a soybean crop reduces evaporation from the canopy microclimate.
Average maximum, minimum, average, and alternating temperatures and average humidity measured for different treatments at 15 cm above the soil surface in years 2 (2009–2010) and 3 (2010–2011). Treatments were soybean crop presence at two maturity groups (MG), MG3 and MG4, with either narrow (0.175 m) or wide (0.52 m) interrow spacing, and a treatment without soybean crop presence. a

a Standard deviations of daily values are shown in parentheses. Rows in the same column, for each year, with the same letter are not significantly different according to Tukey’s test (P < 0.05).
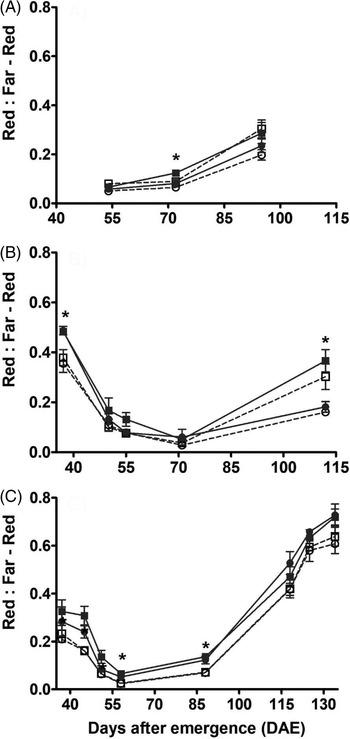
The R-FR ratio under the canopy decreased with soybean crop development. The differences in R-FR ratios among treatments were observed at the first stages of the crop cycle before the intercepted radiation reached 95%, with higher R-FR ratios in wide row spacing treatments than in narrow row spacing treatments. In all three years, the R-FR ratio was reduced under the crop canopy (Figure 2). At 72 DAE (in year 1) and 58 to 88 DAE (in year 3), the R-FR ratio was higher (P < 0.05) at wide row spacing than at narrow row spacing for MG3 (Figure 2A and C). In year 2, MG4 showed a lower (P < 0.05) R-FR ratio than MG3 at narrow row spacing (Figure 2B). These results agree with those of Norsworthy (Reference Norsworthy2004), who found higher R-FR ratios in 0.96-m row spacing than in 0.19-m row spacing. Canopies associated with high radiation interception have lower R-FR ratios compared with sparse canopies (Board Reference Board2000), as was observed for narrow row spacing and later MG. The lower R-FR ratio can result in reduced tillering in grasses in favor of stem elongation (Casal et al. Reference Casal, Deregibus and Sánchez1985) and panicles being located above the canopy.
Red–far red (R-FR) ratio under the crop canopy (A–C) during experiments for maturity group (MG3, squares; MG4, circles) and row spacing (wide spacing, closed symbols; narrow spacing, open symbols) treatments of Digitaria sanguinalis for years 1 (A), 2 (B), and 3 (C). An asterisk (*) indicates significant differences among treatments on the same date.

Effect of Soybean Crop on Digitaria sanguinalis
The crop effects on environmental conditions modified weed growth and reproduction. Plants growing under the crop canopy produced less aboveground biomass and fewer tillers and seeds per plant (P < 0.05). The height of D. sanguinalis plants was similar among treatments (around 90 cm). Reduction in aboveground biomass was significantly (P < 0.05) higher in year 3 (2010 to 2011) than in year 1 (2008 to 2009) (Table 2). The lack of differences in weed biomass with increasing row spacing conflict with results for different crops such as wheat (Triticum aestivum L.) (De Vita et al. Reference De Vita, Colecchia, Pecorella and Saia2017) and maize (Zea mays L.) (Murphy et al. Reference Murphy, Yakubu, Weise and Swanton1996); this could be due to the differences among experiments in the row spacing treatments or the position of the weeds within the interrow. Weeds within or near the row would probably compete with the crop earlier than weeds in the middle of the interrow (Mohler Reference Mohler, Liebman, Mohler and Staver2004), and effects on weed characteristics could be more pronounced than in the present work.
Digitaria sanguinalis height, tillers per plant, aboveground biomass and seeds per plant percentage reduction compared with plants growing without crop for different treatments. Treatments were 2 soybean maturity groups 3 and 4 (MG3 and MG4), 2 interrow spacing (wide and narrow) and without crop. Numbers in parenthesis are standard deviation of each value. For each year, rows with the same letter in the column are not significantly different according to Tukey’s (p < 0.05).

A smaller (P < 0.05) reduction in seeds per plant was observed in MG3 than in MG4, probably related to the shorter cycle of MG3, which reduced the amount of radiation intercepted by the crop and allowed the weed plants to intercept enough radiation to produce some seeds at the end of the cycle. The soybean crop reduced the solar radiation reaching weed plants in agreement with Knezevic et al. (Reference Knezevic, Evans and Mainz2003), who suggested that solar radiation reduction was the most important cause of decreased weed biomass. Considering soil resources were well provided through irrigation and adequate soil fertility, the reduction of aboveground biomass caused by light competition led to a significant reduction in the number of seeds (Weiner Reference Weiner2004); this effect was more important in soybean crop structures with higher light radiation in time and space, such as narrow row spacing and later MG. Also, higher radiation intercepted by crop caused reduction of maximum and alternating temperatures and higher humidity values below the canopy (Sauer et al. Reference Sauer, Singer, Prueger, DeSutter and Hatfield2007).
The reduction of the number of tillers per plant of D. sanguinalis growing under the crop canopy was related to the reduction in intercepted radiation and the R-FR under the canopy. As documented for other grasses such as rice (Oryza sativa L.) (Sasaki et al. Reference Sasaki, Toriyama, Shibata and Sugimoto2004), barley (Hordeum vulgare L.) (Kirby and Faris Reference Kirby and Faris1972), and ryegrass [Lolium perenne L. ssp. multiflorum (Lam.) Husnot] (Casal et al. Reference Casal, Deregibus and Sánchez1985), tiller outgrowth depends on resource availability but also on radiation quality reflected in the R-FR ratio (Casal et al. Reference Casal, Deregibus and Sánchez1985; Evers et al. Reference Evers, Vos, Andrieu and Striuk2006). For example, tillering ceases when the R-FR ratio is lower than 0.25 to 0.3 for wheat (Evers et al. Reference Evers, Vos, Andrieu and Striuk2006) and 0.84 for ryegrass (Casal et al. Reference Casal, Deregibus and Sánchez1985), which are higher R-FR values than those recorded in this work under the canopy. As stated for weed biomass, the lack of differences between interrow treatments could be related to the fact that weed plants were placed in the middle of the interrow.
Effect of Soybean Crop on Digitaria sanguinalis: Seed Dormancy
In general, seeds collected in year 1 showed a lower (P < 0.05) dormancy level (around 80% germination) compared with the other two years (around 4% and 13% germination in years 2 and 3, respectively). During year 1, seeds from plants growing without the crop collected on February 2 and 13, showed a higher (P < 0.05) dormancy level than seeds collected after these dates. No differences were observed in this season among seeds from plants growing under the crop canopy or between seeds from plants growing without the crop or under the crop canopy. In year 2, only seeds collected from plants growing without the crop on March 10 showed a lower (P < 0.05) seed dormancy level. But seeds from plants growing under the crop canopy showed a high seed dormancy level (around 10% higher dormancy). In contrast, seeds from plants growing under the crop canopy showed a lower (P < 0.05) seed dormancy level than seeds from plants growing without the crop canopy in year 3. These differences were observed in seeds collected on March 23 and 30 but not before these dates.
Seed dormancy level is extremely variable among years, with germination ranging from 4% in year 2 to 70% in year 1. In the present work, year 1 was characterized by an important drought, despite the experiments having been irrigated. More cloudless clear days with higher radiation than the rest of the years were observed. These conditions were probably related to the low seed dormancy levels of seeds in this year independent of treatment. Seed dormancy level varies from one year to another in the same location (Fenner Reference Fenner1991) and is strongly associated with environmental factors experienced by the maternal plant during seed development (Sánchez et al. Reference Sánchez, Eyherabide and de Miguel1981). Solar radiation is one of the main factors influencing seed dormancy level. Solar radiation can increase or decrease seed dormancy level depending on species. For example seeds of velvetleaf (Abutilon theophrasti Medik.) (Bello et al. Reference Bello, Owen and Hatterman-Valenti1995; Nurse and Di Tommaso Reference Kirby and Faris2005), long spined thorn apple (Datura ferox Nees) (Sánchez et al. Reference Sánchez, Eyherabide and de Miguel1981), and A. fatua (Gallagher et al. Reference Gallagher, Granger, Snyder, Pittmann and Fuerts2013), maturing under reduced radiation, were less dormant than those receiving high radiation. In contrast, seeds of waterhemp [Amaranthus tuberculatus (Moq.) Sauer] (Steckel et al. Reference Steckel, Sprague, Hager, Simmons and Bollero2003) and eastern black nightshade (Solanum ptycanthum Dunal) (Stoller and Myers Reference Stoller and Myers1989) had greater germination rates when maternal plants grew under full radiation than in shaded environments. Only in year 3 was a lower seed dormancy level observed for seeds from plants growing with a crop but with panicles located above the canopy compared with seeds from plants growing without crop. This result agrees with those of Bello et al. (Reference Bello, Owen and Hatterman-Valenti1995) and Gallagher et al. (Reference Gallagher, Granger, Snyder, Pittmann and Fuerts2013), who found that A. theophrasti and A. fatua seeds from shaded plants had lower germination rates than seeds from plants growing in full sunlight.
A higher seed dormancy level was observed in the present work on seeds dispersed early rather than late in the season (year 1 without crop and year 3 with crop). In addition to solar radiation, temperature and photoperiod also modify seed dormancy level (Fenner Reference Fenner1991), and both diminish during the last part of the weed cycle. Fenner (Reference Fenner1991) found that reduced temperature during seed maturation caused a reduced seed dormancy level in 15 species and a higher seed dormancy level in three species. Seeds of redroot pigweed (Amaranthus retroflexus L.) (Chadoeuf-Hannel and Barralis Reference Kasperbauer1986) and prickly lettuce (Lactuca serriola L.) (Gutterman Reference Gutterman and Fenner2000) had a reduced dormancy level when dispersed late rather than early in the season. Seed dormancy of D. sanguinalis may have been similarly affected in the present study, as temperatures were lower at later seed collection dates.
Importance of the Environmental Variables on Weed Characteristics
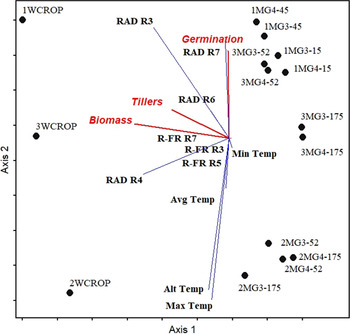
Principal component axis 1 explained 76% of the total variation within the data set and showed a contrast between treatments without crops and with crops. Within this latter group, narrow row spacing treatments clustered on the right, while wide row spacing treatments clustered on the left (Figure 3). The main environmental variables related to axis 1 were RAD at soybean stages R3 and R4 and R-FR at stages R3 and R5, and the main explanatory weed variables related to axis 1 were weed biomass and tillers per plant. RAD at R3 and R4, biomass, and tillers per plant were higher without the crop than with the crop. Axis 2 explained 15% of the total variation within the data set and presented a contrast between year 2 and years 1 and 3. The main environmental variables associated with axis 2 were maximum temperature, alternating temperatures, and incident radiation when soybean was at R7, and germination percentage was the main explanatory variable associated with axis 2. Germination from plants growing in year 1 and 3 was higher than in year 2 and was associated with higher values of maximum temperature, alternating temperatures, and incident radiation when soybean was at R7 (Figure 3). Year 2 showed lower solar radiation at the end of the season than the other two years.
Principal component analysis plot between environmental variables measured for treatments. Symbols ● represent the treatments. Codes: first number is year (1, 2008–2009; 2, 2009–2010; 3, 2010–2011); last number is row spacing; MG: soybean maturity group; bold letters are environmental variables (RAD, Radiation on weed; R-FR, red–far-red ratio; Avg. Tem, average temperature; Min Temp, minimum temperature; Max Temp, maximum temperature; Alt. Tem., alternating temperature; crop stages: R3, R4, R5, R6; and R7; red vectors represent explanatory variables (tillers per plant, biomass, and germination). Dashed lines indicate the different crop structure treatments: wide and narrow interrow spacing. Eigenvalue given for each axis represents the variance in the data matrix attributed to that axis.

Weed growth variables such as biomass, fecundity, and tillers per plant were highly related to the solar radiation experienced by the weed at soybean stages R3 and R4 in treatments without a soybean crop. Competition for solar radiation could explain these results. No association was observed with the R-FR ratio at different soybean stages; therefore, solar radiation interception by the crop seems to be more important than the reduction in R-FR ratio in the reduction of tillers per plant, but not for plant height, where the R-FR ratio seems to be important.
According to the PCA, a lower seed dormancy level was associated with a combined effect of high radiation at R7 and low alternating and maximum temperatures under the canopy. Namely, shaded plants with lower maximum and alternating temperatures and with seeds maturing in panicles located above the canopy and receiving direct solar radiation had lower seed dormancy levels than those maturing on plants without the crop. This effect was mainly observed in crop structures with narrow spacing, where the panicles of taller plants were exposed to direct radiation above canopy. The mechanism whereby seed dormancy is lower under these conditions is unknown but could be related to the effect of temperature on some processes involved in seed dormancy. For instance, germination may be restricted by the presence of inhibitors in the seed coat (Oreja et al. Reference Oreja, de la Fuente and Batlla2017), but further research is necessary to test this hypothesis. Besides the indirect effect on plant height and panicle location relative to the canopy, the R-FR ratio effect was not found to be a factor that modifies seed dormancy in this species, because there was no association in the PCA. The fact that this variable was measured near the soil could have masked the effect on plant structures located far from the soil surface.
The variability of D. sanguinalis seed dormancy levels among seasons and treatments is likely to be due to the huge number of variables involved in the process: for instance, the variation of climatic conditions in each particular season (temperature, radiation, and rainfall) and, in some years, the seed maturation timing related to weed development regulatory factors (photoperiod and temperature); the crop canopy closure related to crop growth rate and development (radiation and temperature on maternal plant); and the position of the panicle with respect to the canopy (radiation and temperature on seeds) (Fenner Reference Fenner1991; Gutterman Reference Gutterman and Fenner2000; Roach and Wulf Reference Roach and Wulf1987). However, this work highlighted the relative importance of a combination of crop management decisions, such as maturity group and interrow spacing, to reduce the incidence of D. sanguinalis in the short term and yield loss by affecting weed biomass and competition. Moreover, in the long term, these decisions could help to reduce the number of seeds that return to the seedbank and seedling emergence timing in the next season by affecting plant fecundity and seed dormancy level, respectively. On the other hand, this work highlighted the relative importance of several environmental factors acting at the same time on different morphological and physiological characteristics of this important weed. Probably the most relevant result is the effect of two factors to reduce seed dormancy level: the radiation at R7 (weed seed development from panicles above the crop canopy in the maternal plant) and alternating and maximum temperatures under the soybean crop canopy (affecting the maternal plant).
Although differences among crop structures were not always evident, these results are especially useful for producers who usually make similar crop management decisions to those evaluated in this work. For optimal sowing dates, combinations of crop structures that lead to early crop canopy closures (e.g., narrow interrow spacing) and covering the soil during a longer period of time (e.g., planting MG4 soybean) are useful for reducing the radiation reaching weed plants at the end of their life cycle. The consequences are weed plants with low biomass, number of tillers per plant, and seeds per plant. The combination of wide interrow spacing and MG3 would enhance the return of a greater number of seeds to the seedbank. It is worth noting that in the present work, weeds were placed in the center of the interrow and the field weeds were randomly distributed; thus the intensity of competition in the field could vary depending on distance from the crop row. On the other hand, despite the lower number of seeds obtained from treatments with narrow row distances, these conditions are likely to produce taller plants that locate panicles above the crop canopy, which are in turn exposed to environmental conditions that reduce seed dormancy level and favor early emergence in the next season.
This research highlights the relative importance of the environmental factors modified by a soybean crop on D. sanguinalis plant structure, growth, fecundity, and seed dormancy. It indicates that variations in radiation and R-FR ratio during reproductive stages determine biomass, fecundity, height, and tillers, while alternating temperatures and radiation during reproductive stages are related to seed dormancy. Therefore, crop management decisions focused on early crop canopy closure, such as reducing interrow spacing, would reduce the use of resources by weeds and weed populations in the long-term. On the other hand, crop management decisions focused on keeping the crop canopy green through the end of the season, such as planting soybean from higher maturity groups, would reduce the seed dormancy level. This lower seed dormancy level can cause early seedling emergence during the next season, which can be easily managed with broad-spectrum herbicides or, more likely, weed seedling death from late frosts.
Acknowledgments
This research was financially supported by the University of Buenos Aires (UBACyT 20020100100170) and by National Scientific and Technological Research Council of Argentina (CONICET) grants. No conflicts of interest have been declared.