





1. Introduction
1.1. Background and motivation
The Earth’s atmosphere is constantly being bombarded with objects from space. The vast majority of entering meteoritic bodies burn up harmlessly in the upper atmosphere; however, larger objects can penetrate to the lower atmosphere or even to the terrestrial surface, posing a threat to human life and property. This may relate directly to the impact of the original object or its fragments, generation of a tsunami for water impacts (Rumpf et al. Reference Rumpf, Lewis and Atkinson2017), or energy deposition to the atmosphere, which is then transferred to the Earth’s surface in the form of a shock wave (Chyba et al. Reference Chyba, Thomas and Zahnle1993). In extreme cases (bodies larger than a kilometre in size), the impactor may result in a mass extinction event (Alvarez et al. Reference Alvarez, Alvarez, Asaro and Michel1980); in such cases, the body will effectively transit through to the surface unaffected by the atmosphere, and the damage is caused primarily by the impact itself and its ejected material (Luther et al. Reference Luther, Artemieva and Wünnemann2019). Such large bodies enter extremely infrequently, however, and can be tracked using available technology; moreover, the 2005 George E. Brown Jr Near-Earth Object Survey Act directed the National Aeronautics and Space Administration (NASA) to catalogue 90 % of near-Earth objects with diameters larger than
 $140\ \textrm {m}$
. This has shifted the residual risk to humans to smaller (
 $\mathcal{O}(10{-}100\ \textrm {m})$
diameter) bodies (Bland & Artemieva Reference Bland and Artemieva2003; Brown et al. Reference Brown2013), which cannot be so easily tracked. For example, the Chelyabinsk entry of 2013 (Borovicka et al. Reference Borovicka2013; Popova et al. Reference Popova2013), an asteroid of some
 $20\,\textrm {m}$
in diameter, was completely unanticipated, and though it did not result in any fatalities, it injured hundreds of people and inflicted significant property damage. For these smaller bodies, the extremely high pressures that develop on the windward surfaces (typically of the order of
 $\rho _a V^2$
, where
 $\rho _a$
is the atmospheric density, and
 $V$
is the meteoroid speed relative to the atmosphere) will invariably cause them to fragment at some point during their atmospheric transit (Bland & Artemieva Reference Bland and Artemieva2003). The resulting lateral separation of fragments, primarily caused by aerodynamic interactions (Passey & Melosh Reference Passey and Melosh1980), can greatly increase the rate of atmospheric energy deposition and the resulting damage at the ground – e.g. the Tunguska airburst in 1908 levelled a forested area of
 $2200\,\textrm {km}^2$
(Chyba et al. Reference Chyba, Thomas and Zahnle1993), while leaving essentially no trace on the ground – or substantially expand the ground footprint of fragments that survive to the surface. Understanding the atmospheric disruption and subsequent separation process in such meteoroid fragmentation events is thus critical for determining the potential risks at the terrestrial surface.
As the entry and break-up parameters of a given meteoroid will generally be unknown a priori (and will often even be subject to significant uncertainty a posteriori), assessing associated risks will typically involve some type of Monte Carlo approach, whereby a large number of reduced-order simulations are performed covering the relevant parameter space (Bland & Artemieva Reference Bland and Artemieva2006; Register et al. Reference Register, Mathias and Wheeler2017; McMullan & Collins Reference McMullan and Collins2019). To ensure an acceptable degree of accuracy, however, the models employed should have some basis in more detailed investigations of the flow physics of the separating fragments. Two approaches have traditionally been taken in examining the fragment aerodynamic interactions following meteoroid disruption; these are appropriate for qualitatively different types of fragmentation events. In the first approach – referred to as the ‘discrete-fragment’ model – the fragments are treated as distinct bodies of finite size, with aerodynamic interactions occurring through the generated shock waves (figure 1
a). Such a treatment is most suitable for disruptions that result in well-defined children bodies of the parent meteoroid, e.g. the Sikhote–Alin event (Krinov Reference Krinov1974). This approach was pioneered by Passey & Melosh (Reference Passey and Melosh1980), who considered two spherical bodies separating exclusively in the lateral direction. The final lateral separation velocity of the smaller body,
 $V_T$
, was derived as
 \begin{align} V_T = V \sqrt {C \frac {\rho _a}{\rho _m} \frac {r_1}{r_2} }, \end{align}
where
 $\rho _m$
is the density of the meteoroid,
 $r_1$
and
 $r_2$
are the two fragment radii, and
 $C$
is a ‘constant’ that, through the examination of various terrestrial crater fields, was determined to lie between 0.03 and 2.25. Subsequent numerical simulations of the separation of two hemicylinders (Artem’eva & Shuvalov Reference Artem’eva and Shuvalov1996) and 13 or 27 equally sized cubical bodies (Artemieva & Shuvalov Reference Artemieva and Shuvalov2001) gave values of
 $C$
of 0.2 and
 $\sim1$
.
The two modelling approaches typically considered in the meteoroid fragmentation literature: (a) discrete-fragment model; (b) pancake model.

Although attempts have been made to apply such binary fragmentation models to predict disruption events involving larger fragment populations (Passey & Melosh Reference Passey and Melosh1980; Artemieva & Shuvalov Reference Artemieva and Shuvalov2001), there is little physical basis to justify this. Moreover, significant doubt was cast on the adequacy of these results to describe real falls by the analysis of the Morávka airburst (Borovicka & Kalenda Reference Borovicka and Kalenda2003): separation velocities up to an order of magnitude higher than those predicted by these existing models were derived from a video record. Indeed, more recent work has shown that the assumption of a purely lateral separation for unequal fragments is not physically justified. In particular, ‘shock surfing’, where the smaller body rides the bow shock of the larger body downstream, can result in much enhanced separation velocities (Laurence & Deiterding Reference Laurence and Deiterding2011; Laurence et al. Reference Laurence, Parziale and Deiterding2012). The high sensitivity of separation behaviour to radius ratio observed in these studies also suggests that models based on results for equally sized fragments are unlikely to be accurate, at least in the two-body case. Non-spherical geometries have the potential to extend the shock-surfing behaviour and produce even higher separation velocities (Li et al. Reference Li, Sui, Gong and Wu2015; Seltner et al. Reference Seltner, Willems and Gülhan2024). Aside from the simulations of Artemieva & Shuvalov (Reference Artemieva and Shuvalov2001) and Whalen et al. (Reference Whalen, Laurence and Deiterding2020, Reference Whalen, Deiterding and Laurence2026), however, studies involving more than two discrete bodies are relatively rare or involve unrealistic parent geometries (Park & Park Reference Park and Park2020).
The second approach, in which the fragmented body is treated as a strengthless agglomeration or ‘debris cloud’, is most suitable for catastrophic fragmentation events or the entry of ‘rubble-pile’ type asteroids (Walsh Reference Walsh2018). Such an approach is exemplified by semi-theoretical ‘pancake’ models (Chyba et al. Reference Chyba, Thomas and Zahnle1993; Hills & Goda Reference Hills and Goda1993), in which the experienced forces are assumed to flatten the strengthless mass in the lateral direction, increasing the exposed area and rate of atmospheric energy deposition, until a terminal radius is reached (figure 1
b). Application of these models is somewhat inconsistent, however, with some authors cautioning against the use of a terminal radius ratio larger than twice the initial value (Artemieva & Pierazzo Reference Artemieva and Pierazzo2009), and others finding a value 7 necessary to match light curves (Register et al. Reference Register, Mathias and Wheeler2017; McMullan & Collins Reference McMullan and Collins2019). Furthermore, some of the fundamental physical assumptions used in pancake models can be questionable: to derive their separation equation, for example, Hills & Goda (Reference Hills and Goda1993) equated the lateral kinetic energy achieved by the fragments with the work done by the drag (streamwise) force, despite the
 $90^\circ$
offset that results between the directions of force and displacement.
Although the two population extremes (
 $N=2$
and
 $N\rightarrow \infty$
for debris clouds) have received significant attention, knowledge of the intermediate regime – which is highly relevant to the fragmentation of smaller chondritic and iron bodies (Krinov Reference Krinov1974; Popova et al. Reference Popova2013) – has significant gaps, including the effects of fragment population and size distributions on the ultimate separation behaviour. Moreover, there is a dearth of reliable experimental data on which to base simplified fragmentation models. To address this deficiency, the present authors introduced a systematic experimental methodology for studying the separation of multi-body agglomerations, whereby close-packed clusters are released impulsively into the freestream of a hypersonic (Mach 6) wind tunnel, and are subsequently tracked using high-speed stereoscopic imaging (Whalen & Laurence Reference Whalen and Laurence2021). Preliminary experiments with up to 36 equal spheres revealed that the collective mean separation velocity grew notably as the cluster population increased. It was also found that the separation process could be divided into two phases: a ‘primary’ phase, during which the individual separation velocities increased almost linearly, and a ‘secondary’ phase, characterised by more pronounced subcluster interactions.
In the present work, we employ this experimental methodology to explore the multi-body separation problem in detail, with the objectives of building a physical understanding of the interacting flow physics, and developing a simple statistical model that can be used to predict the outcome of aerodynamic separation of a disrupted meteoroid. To address the effects of both fragment population and size distribution, we examine clusters of equally sized spheres with varying populations (up to
 $N=115$
), and unequal spheres of a fixed population (
 $N=52$
) with varying size distributions. The remainder of this work is structured as follows. First, we outline the model problem studied here and discuss its relevance to the meteoroid separation process of ultimate interest. In § 2, we describe the experimental methodology and analysis techniques employed, then summarise the cluster configurations studied. In § 3, we first discuss primarily qualitative aspects of the separation of various sphere clusters, and subsequently explore several important separation quantities for equal-sphere clusters (separation isotropy, range and duration of the primary phase). Mean and individual separation velocities are then characterised, which allows the development of a simple statistical separation model for both equal and unequal clusters. Finally, the origins of severely expelled fragments are examined, before conclusions are drawn in § 4.
1.2. Model problem
Before proceeding any further, we state the assumptions intrinsic to the model problem studied in this work, and examine how justified these are in the context of the meteoroid fragmentation process that we are seeking to understand. The key assumptions here are as follows.
-
(i) Both fragment and parent-body geometries are spherical.
-
(ii) Fragments are released instantaneously into the flow with zero initial velocity.
-
(iii) There is no mass loss due to regolith (dusty debris) generation or ablation during fragmentation.
-
(iv) The inflow properties during separation remain constant.
-
(v) The Mach 6, perfect-gas conditions utilised here are representative of meteoroid entry conditions.
The most significant simplification in this work is that of fragmentation into perfect spheres, which drastically reduces the permissible parameter space by removing the dependence on body rotations and additional geometrical parameters (such as aspect ratio). Although such an assumption is common in modelling meteor fragmentation (Laurence et al. Reference Laurence, Deiterding and Hornung2007; Marwege et al. Reference Marwege, Willems, Gülhan, Aftosmis and Stern2018; Register et al. Reference Register, Aftosmis, Stern, Brock, Seltner, Willems, Guelhan and Mathias2020), recovered meteorites (as proxies for airborne fragments) commonly exhibit irregular morphologies (Popova et al. Reference Popova2013) and would be expected to demonstrate aerodynamic behaviours distinct from spheres. Li et al. (Reference Li, Sui, Gong and Wu2015) and Seltner et al. (Reference Seltner, Willems and Gülhan2024) have examined the dynamics of sphere–cube pairs, and found that certain configurations can experience extended periods of shock surfing, and as a result, enhanced lateral velocities. Additionally, provided that a stable trim angle exists for a particular irregular fragment, it could feasibly develop an intrinsic lift, which would similarly be expected to enhance the final lateral velocity of the disrupted impactor. In experiments on a 2 : 1 aspect ratio, sharp-edged cylinder at Mach 7 by Seltner et al. (Reference Seltner, Willems, Gülhan, Stern, Brock and Aftosmis2021), for example, a stable lifting configuration (with a lift-to-drag ratio of approximately 0.1) was found for an inclination angle of
 $21^\circ$
, though further experiments by Duchene & Laurence (Reference Duchene and Laurence2025) showed that blunting of the edges leads to the disappearance of this stable point. In any case, the results for the purely spherical geometries of the present model problem may be considered a lower limit on the fragment dispersal attained during realistic disruption events. The shape of a progenitor body can also range from the highly peculiar (Fujiwara et al. Reference Fujiwara2006) to the quasi-spherical (Sugita et al. Reference Sugita2019), and the ultimate separation behaviour may be sensitive to the particular combination of morphology and entry attitude encountered. Nevertheless, spherical clusters may be expected to occupy an intermediate regime between the behaviours of the more oblate and prolate meteoroid geometries.
Regarding assumption (ii), an actual fragmentation event likely involves the failure of pre-existing fault lines above a critical stagnation pressure, followed by internal incubation of the energetic flow through the newly opened fissures, as discussed by Park & Brown (Reference Park and Brown2012). In the framework of these authors, the incubation time (i.e. the time between incipient structural failure and the onset of aerodynamic separation) may be several times longer than the characteristic separation time scale, which would tend to decrease a body’s rate of fragmentation over its flight. The rheological explosion experiments of Gorazdovskij (Reference Gorazdovskij1976), however, seem to suggest nearly instantaneous disruption into numerous fragments, and investigations of atmospheric energy deposition almost uniformly assume a sudden fragmentation event (Chyba et al. Reference Chyba, Thomas and Zahnle1993; Register et al. Reference Register, Mathias and Wheeler2017; Wheeler et al. Reference Wheeler, Register and Mathias.2017; McMullan & Collins Reference McMullan and Collins2019). As instantaneous disruption is the simplest case, we also adopt this assumption here. There are several possible sources of initial fragment velocities, including parent-body rotation and conversion of strain energy. Spinning of the parent body was considered e.g. by Passey & Melosh (Reference Passey and Melosh1980), who found that rotational rates of approximately
 $10\,\textrm {rps}$
(with an appropriate alignment of the spin axis and the velocity vector) would be required to produce observed cross-range dispersions. The rotational periods of meteoroids are typically minutes, however (see e.g. Scheirich et al. Reference Scheirich2010), which would result in negligible initial velocities at the point of fragmentation. Estimates of the kinetic energy released from the conversion of compressive strain energy at the point of disruption have previously been made by Laurence & Deiterding (Reference Laurence and Deiterding2011), where it was shown that the resulting separation velocities are likely to be somewhat smaller than those that can be achieved through aerodynamic effects.
While monolithic impactors likely do not retain regolith in the standard sense (owing to their low surface gravity), they do spawn an abundance of dusty particulate upon breaking up, evidenced by the dust cloud generally left in a disrupted meteor’s wake (Ceplecha et al. Reference Ceplecha, Borovička, Elford, ReVelle, Hawkes, Porubčan and Šimek1998; Borovicka & Kalenda Reference Borovicka and Kalenda2003; Gorkavyi et al. Reference Gorkavyi, Taidakova, Provornikova, Gorkavyi and Akhmetvaleev2013). Although the presence of this material seems inevitable, to the authors’ knowledge, no comprehensive exploration of the mass lost to dusty debris has been conducted to date, leaving the effects of this assumption presently unknown, and motivating our assumption (iii). We also ignore the effects of ablation during the separation process. In the two-body simulations of Artemieva & Shuvalov (Reference Artemieva and Shuvalov2001), ablation was shown to have a negligible influence on the separation dynamics. In a more general case, it can be argued that the typical mass loss during the time scale of the separation is sufficiently small so as to have a negligible aerodynamic effect. Consider, for example, a 4 m radius fragment produced by the fragmentation of a 20 m radius parent body at altitude
 $30\,\textrm {km}$
with velocity
 $20\,\textrm {km}\,\textrm {s}^{-1}$
. The rate of fragment mass loss can be approximated as (Öpik Reference Öpik2004)
 \begin{align} \frac {{\rm d}m}{{\rm d}t} = -\frac {1}{2} \rho _a V^3 \sigma _{ab} C_D A_s, \end{align}
where
 $\sigma _{ab}$
is the ablation coefficient,
 $A_s$
is the frontal area, and
 $C_D$
is the drag coefficient (
 $\approx1$
for a sphere). If we assume typical properties for a chondritic meteoroid (
 $\rho _m=3300\,\textrm {kg}\,\textrm {m}^{-3}$
and
 $\sigma _{ab}=5\times 10^{-9} \,\textrm {kg}\,\textrm {J}^{-1}$
), together with a separation time scale based on the accepted non-dimensionalisation with the appropriate density (which gives a duration of
 $\sim0.3$
s), we arrive at an ablative mass loss during separation of approximately 0.6 %. It should be kept in mind, however, that such ablation effects will be more severe for fragmentation at lower altitudes and/or for smaller fragments, and shock interactions (e.g. during shock surfing) could also result in enhanced heating rates and accelerated ablation (Edney Reference Edney1968).
For assumption (iv), because of the exponential density profile of Earth’s atmosphere, a meteoroid’s inflow conditions are continually changing along its trajectory. This is at odds with the standard non-dimensionalisations of cluster separation properties, however, which (as we will see shortly) assume constant fluid density and velocity. Consider again a 20 m radius meteoroid travelling at 20 km s−1 and fragmenting at altitude 30 km, with the most probable entry angle of
 $45^\circ$
. During the separation time scale (again 0.3 s), the swarm will have descended by
 $\sim 5\,\textrm {km}$
, and the density at this lower altitude will be 2.4 times higher than at the initial fragmentation height. We note, however, that given a suitable approximation to the time-varying nature of the repulsive force coefficients that fragments experience (which is touched upon in this work), it would be possible to define an effective (time-averaged) dynamic pressure that characterises the more realistic separation event and can be used in place of the assumed constant values in the conventional non-dimensionalisations.
Finally, concerning assumption (v), the freestream Mach number of the present experiments (
 $M=6$
), although hypersonic, is well below the values typical of meteoroid entry. We thus appeal to the Mach number independence principle (Anderson Reference Anderson2006), which states that, for inviscid, perfect-gas flows, the flowfield characteristics and quantities such as aerodynamic coefficients essentially freeze above a certain Mach number. For blunt-body flows of the type considered here, this ‘freezing’ value is
 $\sim5$
. Additionally, for such blunt configurations, we can expect the viscous force contributions to be negligible. A more precise statement of the Mach number independence principle (see e.g. Hayes & Probstein Reference Hayes and Probstein2004) requires the Mach number to increase in such a way that the velocity and density remain constant, and we note that the high-temperature effects that would be present at the hypervelocity conditions encountered during meteoroid entry (e.g. vibrational excitation, dissociation, ionisation) will be absent in the present, essentially cold-flow experiments. Nevertheless, such effects generally have only a limited influence on pressures in shock-dominated flows (Vincenti & Kruger Reference Vincenti and Kruger1965): for example, the pressure coefficient at the stagnation point (which will effectively scale the pressure distribution over the remainder of the body; Lees Reference Lees1955) will increase from 1.84 for
 $\gamma =1.4$
,
 $M\rightarrow \infty$
to the Newtonian limit of 2 as high-temperature effects become significant and
 $\gamma$
decreases towards 1. As the inter-sphere pressure will be the dominant mechanism in driving the cluster separation, this might be expected to produce a modest increase in separation velocities. This effect will be counterbalanced, however, by bow shocks adhering more closely to their generating bodies in high-temperature flows. As the lateral extent of the bow shock scales the interaction distance between fragments (Passey & Melosh Reference Passey and Melosh1980), shifting of the shocks closer to the bodies can be expected to decrease the terminal radius at which cloud fragments become independent of one another, and thus the overall separation velocity. Sousa et al. (Reference Sousa, Deiterding and Laurence2021), for example, considered the separation of a hypersonic sphere from a reflecting, inviscid wall (equivalent to the separation of two identical spheres), and found a modest decrease in the net repulsion for
 $\gamma =1.1$
compared to 1.4; a similar result can be expected here, though further simulations would help to quantify the degree of this effect.
2. Experimental methodology
The basic experimental methodology employed for these experiments has been described previously in Whalen & Laurence (Reference Whalen and Laurence2021); here, we summarise the most relevant points in the context of the present work.
2.1. Facility and test conditions
All experiments were performed in the University of Maryland HyperTERP wind tunnel (Butler & Laurence Reference Butler and Laurence2019). HyperTERP is a reflected-shock tunnel that produces a uniform Mach 6 flow by means of an axisymmetric converging–diverging nozzle with exit diameter
 $0.22\,\textrm {m}$
. Optical access is provided by
 $15.2\,\textrm {cm}$
diameter windows, mounted at
 $90^\circ$
intervals about the free-jet (
 $30\,\textrm {cm}$
internal diameter) test section. Freestream flow quantities were determined from the measured reservoir pressure and derived stagnation temperature (typically
 $1.35\,\textrm {MPa}$
and
 $866\,\textrm {K}$
) by assuming an isentropic expansion to Mach 6.05: representative properties for the freestream flow are
 $\rho _\infty =0.0263\,\textrm {kg}\,\textrm {m}^{-3}$
,
 $T_\infty =112\,\textrm {K}$
,
 $p_\infty = 847\,\textrm {Pa}$
,
 $u_\infty =1275\,\textrm {m}\,\textrm {s}^{-1}$
. A particular advantage of shock-driven facilities such as HyperTERP in the present context is the rapid flow establishment (
 $\sim 1\,\textrm {ms}$
), which is crucial for providing well-defined initial conditions in these experiments (where we treat each sphere cluster as being exposed to an instantaneously established high-speed flow). The nominally steady test time (
 $\sim 12\,\textrm {ms}$
) is sufficiently long to observe full cluster trajectories within the field of view. The stagnation pressure typically exhibits a 3.1 % standard deviation from its mean value during this test time, and we further estimate a
 $\sim5$
% systematic uncertainty associated with intrinsic calibration errors in the pressure sensors. The run-to-run variation in mean stagnation pressure over the entire campaign was 1.9 %, while that in the mean temperature (estimated from shock-speed measurements) was 1.7 %.
Cluster mounting/release mechanism in the experiments. (a) Schematic of the mechanism. (b) Separation sequence of suspension shells for (top) vertical and (bottom) horizontal camera views; images are shown at intervals of 0.4 ms.

2.2. Set-up of test articles
The sphere agglomerations were created using a three-dimensional-printed mounting mechanism. The spheres themselves were of either Delrin acetal plastic (
 $\rho = 1400 \pm 40\,\textrm {kg}\,\textrm {m}^{-3}$
) or higher-density PTFE (
 $\rho = 2320 \pm 45\,\textrm {kg}\,\textrm {m}^{-3}$
); the latter material was chosen for experiments in which the initial separation phase was of primary interest, as the higher density resulted in slower separation within the field of view. For the equal-sphere clusters, the sphere diameters ranged from
 $2.38\,\textrm {mm}$
to
 $6.35\,\textrm {mm}$
, depending on the population. For the unequal clusters, the range of sphere sizes was constrained by availability from the vendor, with the following radii (all in mm) employed: 0.79, 1.19, 1.59, 1.98, 2.38, 2.78, 3.18, 3.57, 3.97 and 4.76. The spheres exhibited less than 1 % deviation from sphericity, according to manufacturer specifications. The mounting mechanism, as shown in figure 2(a), consisted of two hemispherical shells (with internal diameter between 13.4 mm and 18.9 mm) to initially contain the spheres, with flaps mounted at the front and to the sides to promote rapid opening with minimal disturbance to the spheres upon flow arrival. The flaps were typically aligned at
 $45^\circ$
to prevent extended obscuration in either of the vertical or horizontal views. As shown in the visualisation sequence of figure 2(b), this arrangement resulted in the cluster becoming visible in the two views at the same time, within approximately
 $1\,\textrm {ms}$
of flow arrival; thereafter, the shells exhibited no influence on the spheres. The spheres were filled into the assembled shells through a hole in the top. For the unequal spheres, special care was taken to ensure that spheres of all sizes were distributed evenly and randomly throughout the initial cluster volume. The mounting mechanism was hung by floss from the roof of the test section in one of two positions: a downstream position that lay within the imaging field of view (for visualisation of the the initial separation phase), or an upstream position to promote full separation before the spheres had left the field of view.
2.3. Cluster parameters for unequal spheres
Surviving meteorite fragments from a given fall have been found typically to follow power-law distributions (Hartmann Reference Hartmann1969), and, while recovered fragments can be expected to obey a size distribution distinct from that immediately following disruption, one might still anticipate a power law to provide a reasonable description of airborne fragmentation. The functional form of the fragment size distribution employed in this work is a truncated power law with a variable exponent
 $\alpha$
, i.e.
 $p(r) \propto r^{-\alpha }$
. To allow a direct comparison with the equal-sphere experiments, we fixed the unequal cluster population to 52 bodies, which, as we will see, results in behaviour generally representative of populous agglomerations.
Mass fraction of the prescribed sphere sizes for
 $N = 52$
for various choices of the power-law exponent
 $\alpha$
.

Assessments of meteorite-fragment size distributions generally place
 $\alpha$
close to value 5 (Hartmann Reference Hartmann1969; Betzler & Borges Reference Betzler and Borges2020) (i.e.
 $\sim5.8$
for ordinary chondrites, and
 $\sim4.6$
for iron-type impactors). Considering the preferential ablation of larger bodies that descend deeper into the atmosphere, however, we might expect a smaller value at the point of disruption; indeed, preliminary atmospheric entry simulations have indicated that exponents varying between 1 and 5 effectively bracket the spectrum of recovered meteorites, with
 $\alpha \approx 3.5$
providing best agreement with chondritic fragments (Whalen Reference Whalen2021). Thus here we select exponents 1, 2, 3, 4 and 5 for the generation of unequal clusters, and for practical reasons, truncate the power-law distribution such that the minimum to maximum radius ratio,
 $r_{\textit{min}}/r_{\textit{max}}$
, is 0.25. In figure 3, we see that this range of
 $\alpha$
spans both ‘heavy’ and ‘light’ distributions, wherein the majority of the cluster mass is contained in the largest and smallest fragments, with
 $\alpha =3$
representing an equal mass fraction for all fragment sizes (note that
 $\alpha \rightarrow \pm \infty$
represents the equal-sphere case). To realise a cluster with a particular
 $\alpha$
for a given experiment, we first partitioned the appropriate cumulative density function into bins; evaluation and sorting of
 $N$
random realisations of the uniform distribution then gave the chosen sphere sizes (under the constraint that the packing efficiency had to fall within 10 % of 0.55 for the cluster to be considered valid). Note that neither porosity nor mass is necessarily conserved for clusters constructed from the same
 $\alpha$
, which may contribute further to variability in separation behaviour. One consequence of the limited cluster population was the low probability of selecting the largest spheres for
 $\alpha = 3, 4, 5$
, which could produce agglomerations without the largest bodies of the selection pool. Despite the minimum-to-maximum radius ratio not evaluating to 0.25 in such configurations, the prescribed
 $r_{\textit{min}}/r_{ {max}}$
was still upheld in a statistical sense.
2.4. Sphere visualisation and tracking
A perpendicular two-camera visualisation set-up enabled the reconstruction of three-dimensional sphere trajectories and (in some cases) the visualisation of important flow structures. The vertical view was created with a backlit arrangement using high-powered LEDs and several layers of diffuser sheeting to ensure uniform illumination; images were recorded by a Phantom v2512 camera with a
 $150\,\textrm {mm}$
macro lens. The horizontal view was typically a focused shadowgraph arrangement, with some experiments utilising either schlieren (for improved flow visualisation) or a second backlit arrangement (for improved tracking accuracy). The shadowgraph light source was a either a pulsed visualisation laser or a single LED. Images in this view were recorded with either a second Phantom v2512 or a v2640 high-speed camera, synchronised to the first; the typical frame rate and resolution were
 $35\,\textrm {kfps}$
and
 $768\times896$
pixels. Characteristic pixel/mm scale factors were 6.8 for shadowgraph/schlieren visualisation and either 6.6 (vertical) or 7.1 (horizontal) for the backlit arrangements.
To locate the sphere centres within an acquired image, an edge-tracking technique (Laurence & Karl Reference Laurence and Karl2010) was the primary tool employed, with a Hough-transform-based routine (Duda & Hart Reference Duda and Hart1972) to automate the initial selection of edge points. At early times, during which a large degree of sphere overlap was present, a synthetic-image fitting routine (Whalen & Laurence Reference Whalen and Laurence2021) was used for the less populous clusters; for highly populous clusters, effective tracking at early times was not possible due to excessive overlap, and only terminal sphere velocities were typically derived. Once a given sphere exited the field of view, its separation velocity was assumed to remain unchanged.
The three-dimensional sphere locations at each time step were then reconstructed using the in situ bundle adjustment procedure introduced in Whalen & Laurence (Reference Whalen and Laurence2021); a full description of the methodology can be found in this earlier work. Positional uncertainties were estimated based on the projection errors in this reconstruction for several representative cases. The typical mean uncertainty in the sphere position determination, e.g. for a
 $d_{\textit{sph}}=4.76\,\textrm {mm}$
sphere, was estimated as
 $0.0044d_{\textit{sph}}$
, or
 $0.022\,\textrm {mm}$
, with maximum uncertainty
 $\sim 0.01d_{\textit{sph}}$
. Sphere velocities were derived using three-point central differencing of the trajectories, with two subsequent passes of a moving-average filter (window widths 7 and 5 points). The resulting uncertainty in velocity was estimated, e.g. for the case referenced above as
 $0.092\,\textrm {m}\,\textrm {s}^{-1}$
(or in terms of the characteristic velocity to be defined shortly,
 $0.017 v_s$
).
2.5. Summary of configurations examined
A total of 37 equal-sphere experiments were performed, with cluster populations ranging from 4 to 115 spheres. Repetitions were performed for several of the populations in order to quantify the statistical scatter likely to arise from the randomised initial positions. Most of experiments were performed with an upstream mounting position (where the cluster was not initially visible) to allow better convergence of the terminal separation velocities, with a smaller number of clusters released from a downstream position (within the field of view) to visualise the initial separation. The specific equal-sphere configurations tested are summarised in table 1.
Summary of the cluster configurations explored in this work.

Table 1. Long description
The table presents the configurations of clusters explored in experiments with equal spheres. It includes the number of spheres, sphere diameter, cluster diameter, and the number of runs performed upstream and downstream. The table has 10 rows and 5 columns. Column headers are N, d_sph (mm), d_c (mm), No. of runs upstream, and No. of runs downstream. Row 1: N, 4; d_sph (mm), 5.0/6.35; d_c (mm), 11/13.9; No. of runs upstream, 0; No. of runs downstream, 5. Row 2: N, 8; d_sph (mm), 5.0/5.56; d_c (mm), 13/15.2; No. of runs upstream, 3; No. of runs downstream, 2. Row 3: N, 11; d_sph (mm), 4.76; d_c (mm), 13.9; No. of runs upstream, 0; No. of runs downstream, 2. Row 4: N, 14; d_sph (mm), 4.76; d_c (mm), 15.2; No. of runs upstream, 4; No. of runs downstream, 0. Row 5: N, 15; d_sph (mm), 5.0; d_c (mm), 15.3; No. of runs upstream, 0; No. of runs downstream, 4. Row 6: N, 27; d_sph (mm), 4.0; d_c (mm), 15.2; No. of runs upstream, 4; No. of runs downstream, 1. Row 7: N, 36; d_sph (mm), 3.18; d_c (mm), 13.9; No. of runs upstream, 0; No. of runs downstream, 1. Row 8: N, 52; d_sph (mm), 3.18; d_c (mm), 15.2; No. of runs upstream, 4; No. of runs downstream, 1. Row 9: N, 99; d_sph (mm), 2.38; d_c (mm), 13.9; No. of runs upstream, 1; No. of runs downstream, 0. Row 10: N, 115; d_sph (mm), 2.38; d_c (mm), 13.9; No. of runs upstream, 4; No. of runs downstream, 1.
For the unequal-sphere clusters, fragment radii were sampled from a truncated power series, i.e.
 $p(r) \propto r^{-\alpha }$
, with
 $r_{\textit{min}}/r_{ {max}}=0.25$
. Five values of the exponent
 $\alpha$
were chosen (
 $1, 2, 3, 4, 5$
), with the intermediate values expected to best represent the fragmentation events of interest. For each exponent, five experiments (one downstream and four upstream) were conducted.
3. Results and discussion
3.1. Definitions
Before proceeding to examine the results, we define several important quantities. The characteristic time scale and velocity are
 \begin{align} \tau _s = \sqrt {\frac {\rho _{\textit{sph}}}{\rho _\infty }}\,\frac {r_c}{u_\infty }\quad\mathrm{and}\quad v_s = \sqrt {\frac {\rho _{\textit{sph}}}{\rho _\infty }}\,u_\infty , \end{align}
where
 $\rho _{\textit{sph}}$
is the sphere density, and
 $r_c$
is the initial radius of the cluster. Incorporation of the density ratio into these parameters (and equating the meteoroid density
 $\rho _m$
from earlier with
 $\rho _{\textit{sph}}$
, and similarly
 $\rho _a$
with
 $\rho _\infty$
, and
 $V$
with
 $u_\infty$
) allows the obtained results to be extended to conditions representative of actual meteoroid entry. The separation velocity of an individual sphere,
 $V_{T,i}$
, is referenced to the non-stationary cluster centre of mass (subscript
 $com$
), and is defined as the magnitude of the component in the
 $y{-}z$
plane according to
 \begin{align} \boldsymbol{x}_{rel,i} = (\boldsymbol{x}_i - \boldsymbol{x}_{com}) - (\boldsymbol{x}_i - \boldsymbol{x}_{com})_{\hat {x}}, \\[-28pt] \nonumber \end{align}
 \begin{align} V_{T,i} = (\boldsymbol{v}_i - \boldsymbol{v}_{com})\boldsymbol{\cdot }\frac {\boldsymbol{x}_{rel,i}}{\|\boldsymbol{x}_{rel,i}\|}, \\[0pt] \nonumber \end{align}
where the
 $\hat {x}$
subscript indicates the component in the streamwise direction. The collective lateral separation velocity of equal-sphere clusters is defined as
 \begin{align} \overline {V_T} = \frac {1}{n} \sum _{i=1}^n V_{T,i}. \end{align}
For unequal-sphere clusters, the collective separation velocity is mass-weighted according to
 \begin{align} \overline {V_T} = \frac {1}{m_c} \sum _{i=1}^n m_i V_{T,i}, \end{align}
where
 $m_c$
and
 $m_i$
are the cluster and individual fragment masses. The relevant non-dimensional quantities characterising the cluster separation are then
 \begin{align} t'=t/\tau _s,\quad V'_{T,i} = V_{T,i}/v_s,\quad \overline {V'_T} = \overline {V_T}/v_s. \end{align}
3.2. General separation characteristics
3.2.1. Equal-sphere clusters
We first examine qualitative aspects of cluster separation, starting with more numerous equal-sphere clusters. In figure 4, a schlieren sequence of a 115-sphere cluster released from the downstream suspension position is shown. Immediately following shell separation (first frame), the cluster is already slightly compressed in the streamwise direction, and the bow shock is well established; in the near-stagnation region, however, a pattern of intricate, smaller-scale shocks generated by the forward spheres is visible, rather than a single, all-encompassing bow shock. The cluster continues to contract in the streamwise direction and expand laterally, consistent with the ‘pancake’ model typically assumed for debris clouds. By the second frame, the agglomeration has assumed a triangular shape with a flattened base (corresponding to a highly inclined cone in three dimensions) as the outer spheres are accelerated downstream and further outwards relative to the cluster core. In the third and fourth frames, individual sphere bow shocks become clearly distinguishable, signalling the end of the ‘primary’ separation phase. Several isolated spheres have been accelerated rapidly downstream by shock surfing at this stage; a small core subcluster persists at the head of the cloud but is broken up through collisions by the last frame in the sequence.
Schlieren image sequence showing the separation of a 115-sphere cluster in increments of
 $0.84\tau _s$
(1.09 ms).

Image sequences showing the separation of (a) a 52-sphere cluster and (b) a 27-sphere cluster in increments of
 $0.81\tau _s$
(1.14 ms) and
 $0.87\tau _s$
(1.23 ms), respectively.

Figure 5. Long description
Panel A: Image sequence showing the separation of a 52-sphere cluster in increments of 1.14 milliseconds. The images depict the fragmentation process of the cluster over time. Panel B: Image sequence showing the separation of a 27-sphere cluster in increments of 1.23 milliseconds. The images depict the fragmentation process of the cluster over time.
A shadowgraph sequence of a 52-sphere cluster is shown in figure 5(a). A similar flattening of the cluster arising from simultaneous streamwise compression and lateral expansion is observed, transitioning from an ellipsoidal to a roughly triangular shape, though the latter is more highly inclined to the freestream than in the 115-sphere experiment, and without the noticeably flattened base. Nevertheless, collisions once more appear to play a significant role in dispersing the core of upstream fragments at later times, and the qualitative trends are generally consistent with the 115-sphere case. For the 27-sphere cluster visualised in figure 5(b), however, the behaviour begins to differ somewhat from the larger-population agglomerations just discussed. Although a general streamwise compression and lateral expansion are present early on, the cluster assumes neither the expected initial ellipsoidal appearance nor a subsequent triangular profile, instead maintaining a blunt face to the flow through to the fifth frame. Collisions are visible in the shadowgraph recording, which aid in the eventual dispersal of the dense core, but the discrepancy in the overall qualitative characteristics suggests that as
 $N$
is increased, a transition in primary behaviour to a debris-cloud-like model may arise somewhere between 27 and 52 equal bodies.
(a) Streamwise-projected three-dimensional reconstruction of the sphere trajectories from a separating 8-sphere cluster, in increments of
 $0.96\tau _s$
(
 $1.45\,\textrm {ms}$
) beginning from
 $t' = 0.55$
. (b) Individual lateral velocities versus non-dimensional time together with (solid black)
 $\overline {V'_T}$
and (dashed black)
 $V'_{T,com}$
. (c) Lateral force coefficients versus non-dimensional time with (solid black)
 $\overline {C_T}$
. Sphere numbering by colour: 1, blue; 2, red/orange; 3, yellow; 4, purple; 5, light green; 6, cyan; 7, crimson; 8, dark green.

For small populations, all sphere positions could be tracked from early in the experiment, enabling the full three-dimensional trajectories to be reconstructed. In figure 6(a), we present a reconstructed visualisation sequence (looking from upstream) for an 8-sphere cluster. In this configuration, four upstream spheres (
 $1, 3, 4, 5$
) form a plane oriented almost normal to the freestream, producing high internal pressures that drive rapid lateral expansion. Time-resolved separation velocities are shown in figure 6(b), together with the collective and centre-of-mass velocities. We note the almost-linear initial rise characteristic of the primary separation phase (Whalen & Laurence Reference Whalen and Laurence2021): during this time,
 $\overline {V'_T}$
reaches 94 % of its terminal value (0.49). A relatively high minimum lateral velocity 0.27 at the end of primary separation indicates an absence of entrained spheres, and there is no evidence of collisions (which would manifest themselves as rapid changes in sphere velocities) during the subsequent secondary phase. The limited shock surfing that does occur (seen in the rapid increases in the lateral velocities of spheres 2 and 8 starting at
 $t'\approx 3$
) results in only a modest increase in the collective separation velocity, despite its pronounced influence on the centre of mass.
The reconstruction errors in this experiment were small enough to allow estimation of the lateral force coefficients; these were computed by applying a finite difference to the velocity data in a similar manner to that described in § 2.4. In figure 6(c), we present the transverse force coefficients centred about the system’s primary axis (rather than the centre of mass, which amplifies the measurement error). The mean coefficient at the start of tracking,
 $\overline {C_T}=0.33$
, seems to originate from a constant state, with deviation 0.11 about this value over the individual sphere coefficients. Interestingly, the body initially subjected to the greatest lateral force (sphere 2) is not the most expelled in the cluster; rather, those spheres whose lateral force coefficients decay more gradually ultimately reach higher separation velocities. The mean force coefficient curve loosely resembles a half-Gaussian or error function, an observation that will be employed shortly to characterise the primary separation phase, and which could also prove useful in defining a fragment separation model under an unsteady inflow (see assumption (v) in the description of our model problem earlier).
(a) Streamwise-projected three-dimensional reconstruction of the sphere trajectories from a second separating 8-sphere cluster in which collisions are significant, in increments of
 $1.24\tau _s$
(
 $1.87\,\textrm {ms}$
) beginning from
 $t' = 0.54$
; a computed shock surface generated by the leading sphere is shown in grey in the fourth frame (at
 $t' = 4.26$
). (b) Individual lateral velocities versus non-dimensional time from this experiment together with (solid black)
 $\overline {V'_T}$
and (dashed black)
 $V'_{T,com}$
. Sphere numbering by colour: 1, blue; 2, red/orange; 3, yellow; 4, purple; 5, light green; 6, cyan; 7, crimson; 8, dark green.

Figure 7. Long description
Panel A: This panel contains six scatter plots showing the streamwise-projected three-dimensional reconstruction of sphere trajectories from a separating 8-sphere cluster. Each plot represents different increments of non-dimensional time, starting from 0. The spheres are color-coded: blue, red, yellow, purple, light green, cyan, crimson, and dark green. In the fourth frame, a computed shock surface generated by the leading sphere is shown in grey. Panel B: This panel features a line graph displaying individual lateral velocities versus non-dimensional time from the experiment. The graph includes multiple colored lines representing different spheres, with colors corresponding to the spheres in Panel A: blue for sphere 1, red for sphere 2, yellow for sphere 3, purple for sphere 4, light green for sphere 5, cyan for sphere 6, crimson for sphere 7, and dark green for sphere 8. The solid black line represents the collective value, and the dashed black line represents the centre-of-mass offset.
To demonstrate that the behaviour observed for this cluster is not necessarily typical of smaller populations, however, in figure 7 we present similar results from another 8-sphere experiment. In this initial configuration, there is one sphere (sphere 1) located further upstream than the others, and this sphere largely dictates the subsequent cluster dynamics. The resulting trajectories are characterised by entrainment (spheres 2 and 3), extended shock surfing (spheres 6 and 7) and collisions (spheres 1, 2 and 3). To help to elucidate the dominant role of sphere 1, in the fourth frame (
 $t'=4.26$
) we have superimposed the reconstructed bow-shock profile produced by this sphere (extracted from a numerical simulation of a single sphere at Mach 6, as in Whalen et al. Reference Whalen, Laurence and Deiterding2020). Here, we clearly see the intersection of the shock with sphere 6, leading to the extended shock surfing of this body observed later in the experiment in the corresponding velocity profile (figure 7
b). Spheres 4 and 7, on the other hand, lie inside the shock at this time, leading to weak attraction (decreasing
 $V'_T$
) towards the cluster centre of mass. These various interaction phenomena affect both the centre-of-mass and collective lateral velocities; in particular, the terminal
 $\overline {V'_T}$
of 0.61 significantly exceeds the other 8-sphere case, despite being limited to
 $\sim 0.37$
following the primary phase.
The distinct separation characteristics observed in the two 8-sphere runs contrast with the relative consistency seen between the 115- and 52-sphere experiments, indicating that for lower cluster populations, the exact initial configuration can have an outsized influence on the subsequent separation dynamics. This conclusion also extends down to the 4-sphere clusters examined by Whalen & Laurence (Reference Whalen and Laurence2021), where it was found that the sphere positions relative to the most upstream sphere had a dominant influence on the separation dynamics as a whole (much like the second 8-sphere experiment just discussed). Moreover, for smaller populations, sphere interactions following the primary phase can have a substantial effect on the bulk separation characteristics. Efforts to model such clusters should thus account for these effects, whereas for larger-population clusters they are likely to have a more limited influence.
3.2.2. Unequal-sphere clusters
Now moving to the unequal bodies, sequences corresponding to ‘heavy’ (small
 $\alpha$
) and ‘light’ (large
 $\alpha$
) clusters are presented in figure 8. Figure 8(a) demonstrates the high variation in body sizes resulting from the
 $\alpha =2$
exponent. This cluster was composed such that just 4 of the 52 bodies constituted 50 % of the mass, leaving a large number of minor fragments that provided smaller contributions to the overall kinematics. In the first frame, the main bow shock is generated by only a few larger spheres, in contrast to the complex shock structures imaged in the larger-population, equal-cluster cases. This leads to an accelerated onset of shock ingestion, but also a higher degree of aerodynamic shielding of smaller bodies downstream. In the second frame, lateral expansion of the cluster is evident, but the axial compression characteristic of equal-sized clusters is generally absent. Thereafter, however, we see dramatic streamwise growth of the cluster as many of the smaller bodies (specifically, those of the two smallest radii) are swept downstream, some also accumulating significant lateral velocity. Nevertheless, significant subclusters begin to develop upstream, rendering the cluster comparatively blunt in overall shape. Of particular note is a subcluster emerging at the bottom of the fourth frame, which appears to persist essentially intact until exiting the field of view (unlike the central cluster, which disperses through collisions by the last frame shown here). Overall, severe ejection of the smallest bodies and retention within subclusters both appear to be features characteristic of such small-
 $\alpha$
configurations.
Shadowgraph images showing the separation sequences of (a)
 $\alpha =2$
and (b)
 $\alpha =5$
clusters in increments of
 $0.90\tau _s$
(1.20 ms).

The
 $\alpha = 5$
cluster visualised in figure 8(b) is composed of one large body accompanied by an abundance of secondary spheres. Approximately 60 % of the total mass is contained in the two smallest sphere radii, suggesting that dynamics similar to equal-sphere separation may be likely. Indeed, the cluster appears to obey the standard lateral-expansion/axial-compression development commonly witnessed in the equal-cluster experiments, despite the presence of a small body upstream (earlier frames reveal that this body was thrust forwards immediately following shell separation). In the fourth frame, a subcluster travelling in the near wake of the primary (largest) body has formed, with the constituent bodies undergoing frequent collisions with one another. Overall, however, the degree of subclustering is significantly reduced in comparison to the
 $\alpha =2$
case, again consistent with a tendency towards equal-sphere behaviour.
Late-time behaviour of an
 $\alpha =3$
,
 $N=52$
unequal cluster. (a) Selected frames from the shadowgraph sequence. (b) Streamwise-projected trajectory reconstruction, shown in increments of
 $0.64\tau _s$
(1.06 ms). (c) Corresponding lateral velocity histories, with coloured lines representing individual sphere trajectories. In (c), the solid black line gives the collective lateral velocity, and the dashed black line shows the centre-of-mass velocity offset. Common numbered labels in (b) and (c) indicate features of special interest discussed in the main text.

We now examine the reconstructed trajectories and velocities at later times of an
 $\alpha =3$
cluster released from the upstream position in figure 9 (a movie of this experiment is also included in the supplementary material, available at https://doi.org/10.1017/jfm.2026.11846). Note that part of the tether from the release mechanism is visible in the second and third shadowgraph images (figure 9
a), but is absent in the other view, indicating that it did not interfere with the sphere trajectories. Bodies in figures 9(b,c) (showing the streamwise-projected view and time-resolved separation velocities) are coloured according to the time at which they left the field of view, which generally corresponds to sphere radius; in figure 9(b), transparency indicates that the relevant sphere is outside the field of view, in which case the indicated position is either the first or last determined location where that body was visible. The reconstruction of the sphere motions appears rather chaotic, so we highlight several important features with numbered labels. The body labelled 1 (
 $r/r_{ {max}} = 0.25$
) demonstrates delayed yet especially severe repulsion, reaching
 $V_T'= 2.25$
before exiting the test section, still accelerating. This sphere appears to have been surfing the shock of a body that was itself shock surfing, yielding a shock-surfing cascade of sorts. Label 2 represents a massive subcluster containing spheres of five different sizes and constituting 30 % of the mass of the initial agglomeration. One of the secondary spheres in this subcluster (labelled 3) is a shielded fragment in nearly continual contact with the leading, primary sphere. Meanwhile, two additional bodies (labelled 4) are accelerated rapidly downstream while resisting lateral ejection, apparently having been terminally swept into the far-wake region of the upstream subcluster. Finally, label 5 indicates a region devoid of highly expelled spheres, the large subcluster seemingly having captured any smaller bodies that might otherwise have been severely ejected. Despite the high mass retained within this subcluster,
 $V'_{T,com}$
is shifted in the north-west direction (away from this group) by
 $0.17 v_s$
over the plotted duration. Overall, the collective lateral velocity of this cluster in figure 9(c) remains fairly constant over the time shown, indicating that the primary phase continues to serve as the dominant mode driving the overall separation behaviour.
3.3. Isotropy and range/duration of primary phase for equal-sphere clusters
Our primary analysis here concerns the magnitude of the sphere lateral velocity, whereas, more accurately, this quantity is composed of the oriented expulsion of a body in the
 $y$
- and
 $z$
-directions. In figures 6(a) and 7(a), we note significant deviations from isotropy in the sphere trajectories in the
 $y$
–
 $z$
plane for the two 8-sphere clusters. As we move to more populous clusters, however, we might expect such anisotropy to become less pronounced, and for the most populous clusters, one would not expect to see strongly preferential directional tendencies. Nevertheless, the effects of subclustering and slight non-sphericity of the initial agglomeration could conceivably introduce some degree of anisotropy to the arrangement of dispersed fragments.
To examine any directional correlations in the separation of equal-sphere clusters, we thus discretise the terminal lateral velocity measurements of selected experiments into 10 azimuthal bins, and calculate the deviation of each grouping from the overall cluster mean, with a low variance corresponding to effectively isotropic lateral expansion. Figure 10 shows the terminal velocities of all spheres from one 52-sphere test and one 115-sphere test in
 $(z,y)$
coordinates. Some subclusters and sizeable voids appear to disrupt the overall homogeneity of the separation distributions, but the general impression is one of equal dispersion in all directions. To make this more concrete, we supplement these velocities with the cluster’s collective lateral velocity (dashed black) and the mean lateral velocity of each azimuthal bin (solid black with triangles), whose magnitude is denoted by the symbol’s radial distance from the
 $(z,y)$
origin. Both provided examples demonstrate some small deviations from isotropy on larger angular scales. In the 52-sphere case, the large-scale velocity deficit located west of the primary axis seems to be associated with clustering at points further interior, potentially drawing bodies from adjacent bins, and giving the cluster a slight north–south ejection bias. The 115-sphere shot, on the other hand, exhibits a velocity deficit south of the cluster core, which stems from a dearth of high-ejection events in that general direction. The anisotropy of separation, as measured using the deviation from the mean, decreases from 0.211 to 0.139 between the 52-sphere and 115-sphere shots, indicating an approach to isotropic expansion with increasing population, as expected. Additionally, it should be noted that the lack of a directional bias also serves as indirect validation that the shell-based release mechanism is having a negligible effect on the subsequent sphere trajectories.
Azimuthal variance in terminal lateral velocity of (a) a 52-sphere test and (b) a 115-sphere test. The collective lateral velocity of each cluster is shown in the dashed black line, and the binned lateral velocity in solid black with triangular symbols.

(a) Cluster flattening ratio, i.e. ratio of height to width of the bounding box shown in the inset image, versus non-dimensional time for a 36-sphere test; the estimated transition point from the primary to the secondary separation stage is indicated by the dashed vertical line. (b) Decoupling normalised radius ratio and (c) primary separation duration in the equal-sphere experiments and corresponding numerical computations (E = experiment, C = computation).

For the more populous clusters, the primary separation phase appears to serve as the principal means of fragment dispersion. The cluster span at the end of the primary phase effectively marks the radius at which the spheres aerodynamically decouple from one another, and is analogous to the terminal radius in the pancake model. We thus now seek to characterise this quantity for the equal-sphere experiments. For the smaller-population clusters, the end of the primary phase could be determined directly from the sphere trajectories. Specifically, we fit an error function to the mean lateral force coefficient derived from second-order differentiation of the trajectories, as shown for example in figure 6(c). The primary phase is then estimated to end when this fitted curve decreases by 95 % of its initial versus final value. For larger populations, this procedure was not possible, so the bounding-box approach of Whalen & Laurence (Reference Whalen and Laurence2021), depicted in figure 11(a), was instead employed (considering only experiments with the downstream release position). A bounding rectangle is drawn around the cluster (excluding any outliers arising from shock surfing), and the flattening ratio is calculated as the ratio of the height to the length of this box. Given the approximate isotropy of sphere separation outlined above, it is reasonable to assume that the side-projected view yields information characteristic of the cluster as a whole. The end of the primary separation phase is assumed to correspond to the point at which the maximum of this flattening ratio is reached.
The normalised cluster radius at the end of the primary phase,
 $r_p/r_{c,0}$
, where
 $r_{c,0}$
is the initial cluster radius, is shown in figure 11(b). For reference, we also include results from a previous computational survey at Mach 20, consisting of 34 simulations of a regular 13-sphere cluster with different initial orientations (Whalen et al. Reference Whalen, Laurence and Deiterding2020, Reference Whalen, Deiterding and Laurence2026); here, the end of the primary phase was again determined from the lateral force coefficients. We see only a weak dependence of
 $r_p/r_{c,0}$
on
 $N$
, with all values lying within 20 % of the mean 1.95 (and within the 68 % uncertainty bound of the 13-sphere simulations). This mean
 $r_p/r_{c,0}$
is consistent with the terminal radius ratio in debris-cloud models recommended in Artemieva & Pierazzo (Reference Artemieva and Pierazzo2009).
In figure 11(c), we show corresponding results for the primary separation time scale
 $t'_p$
. This parameter is important insofar as it quantifies, for example, the importance of changing atmospheric conditions (with altitude) for a given set of entry properties. In contrast to
 $r_p$
,
 $t'_p$
follows a well-defined, monotonically decreasing trend, indicating a halving of the separation time scale between the smallest and largest populations. This steep decline is likely due, at least in part, to the diminished sphere sizes relative to their parent clusters (and thus a decrease in ballistic coefficient) at higher populations. However, normalising the non-dimensional time scale by the radius of the individual spheres rather than of the clusters in an attempt to correct for this effect would result in an even steeper decline than is observed. This suggests that the reduced separation time may stem from the enhanced efficiency of more populous clusters in exposing high-pressure flow to initially shielded spheres, as the forward spheres are able to spread more quickly laterally.
(a) Equal-sphere collective lateral velocity versus population with fitted power law (3.7) and the prediction from Park & Park (Reference Park and Park2020) indicated. (b) Centre-of-mass lateral offset velocity versus cluster population for equal spheres.

Figure 12. Long description
The image contains two scatter plots. Panel A: A scatter plot shows the relationship between the collective lateral velocity and the population of equal spheres. The x-axis represents the population (N) ranging from 0 to 150, and the y-axis represents the collective lateral velocity (V’T) ranging from 0 to 1.5. The plot includes data points from equal-sphere experiments, a power-law fit with a beta value of 0.407, and a correlation from Park (2020). Panel B: Another scatter plot illustrates the relationship between the center-of-mass lateral offset velocity and the cluster population for equal spheres. The x-axis represents the population (N) ranging from 0 to 120, and the y-axis represents the center-of-mass lateral offset velocity (V’_T,com) ranging from 0 to 0.30. This plot also includes data points from equal-sphere experiments, a power-law fit with a beta value of -0.436, and mean values.
3.4. Mean lateral velocities
The terminal collective lateral velocity is the primary metric for quantifying the cluster expansion in this work. In figure 12(a), we present derived values from all equal-sphere experiments for which suitably accurate data could be obtained. As expected, the collective lateral velocity increases with cluster population, at first rising steeply from 0.22 for two spheres to
 $\sim0.5$
for eight spheres, but thereafter growing more gradually, only surpassing a value of 1.0 near a population of 99 spheres. The variance in the lateral velocity, meanwhile, seems to diminish modestly with increasing cluster size. As the data closely resemble a power-law distribution, we fit an equation of the form
 \begin{align} \overline {V'_T}(N) = \overline {V'_T}_{,N=2} + A(N-2)^\beta , \end{align}
where
 $N\geqslant 2$
,
 $\beta$
is the power-law index,
 $A$
is the corresponding coefficient, and
 $\overline {V'_T}_{,N=2}=0.22$
ensures consistency with two-sphere behaviour (Laurence et al. Reference Laurence, Parziale and Deiterding2012). The plotted curve of best fit has values
 $A=0.123$
and
 $\beta =0.407$
; this curve follows the overall data trend remarkably well overall, but cannot capture the considerable range of fragment dispersion that can occur at a given population (which the current sample size is too small to accurately characterise in any case). The theoretical prediction of Park & Park (Reference Park and Park2020), where
 $\overline {V'_T} \propto N^{1/2}$
, is also shown in figure 12(a), and clearly overestimates
 $\overline {V'_T}$
for larger populations. In § 3.2.1, we noted a change in the qualitative separation behaviour for populations between
 $N=27$
and
 $N=52$
, together with an increased sensitivity to the exact initial configuration for smaller populations. In figure 12(a), the large degree of scatter for
 $N\lesssim 15$
likely reflects this sensitivity, though there is no obvious change in the data trend for
 $N\gt 27$
. Considering the experimental variation, however, it is difficult to conclude definitively whether the observed change in qualitative cluster behaviour for larger populations manifests itself in any way in the collective separation velocity.
Although the fitted power-law trend models the data well over the range of populations considered, clearly it cannot continue indefinitely, as this would lead to an infinite mean velocity in the limit of
 $N\rightarrow \infty$
, i.e. as the disruption approaches that of a debris cloud. Therefore,
 $\overline {V_T'}$
must diverge from the power law for some value of
 $N$
larger than the maximum considered here (115), likely leading to asymptotic behaviour in the large-
 $N$
limit (the value
 $\overline {V'_T}=1.87$
associated with the debris-cloud model of Hills & Goda (Reference Hills and Goda1993) may serve as an approximate upper bound). We postulate that this breakdown might occur when the individual sphere diameter becomes comparable to the shock stand-off distance, as then the cluster would tend to be encompassed by a single bow shock, rather than the individual impinging shocks noted for the
 $N=115$
cluster above. Based on the sphere shock stand-off correlation of Ambrosio & Wortman (Reference Ambrosio and Wortman1962) and a packing factor of 0.7, this would occur for a population of approximately 1500 at Mach 6, with slightly smaller values at higher Mach numbers.
Non-zero centre-of-mass velocities (
 $V'_{T,com}$
), while not contributing to the fragment spread, will add further uncertainty to the possible fall locations of meteoroid fragments. Such velocity offsets generally result from subcluster interactions, and tend to decrease with increasing cluster population, as seen in figure 12(b). The smaller populations exhibit high variance in
 $V'_{T,com}$
, ranging from 0.09 to 0.23 for the eight-sphere clusters, while increased consistency and lower overall offsets are observed at higher populations. We do note, however, that for
 $N = 115$
, one anomalously high offset occurs, possibly due to shell asymmetry during the release process. We again model the data with a power law, performing a least squares fit with a function of the form
 \begin{align} V'_{T,com} = AN^\beta . \end{align}
Here, the parameters
 $\beta =-0.436$
and
 $A=10.66$
give the best-fit power law, which is presented atop the experimental data in figure 12(b). This curve provides a reasonably accurate representation of the trends across a range of cluster sizes, and is consistent with expectations of an asymptotic approach to zero in the high-population limit.
Terminal mass-weighted collective lateral velocities for unequal-sphere clusters compared with results for 52 bodies from the equal-cluster survey, with mean values for each power-law exponent indicated in black.

In examining the qualitative behaviour of unequal clusters above, we noted both augmented expulsion of smaller bodies and increased subcluster mass retention compared to equal-sphere clusters; these two phenomena can be expected to produce opposing effects on the collective lateral velocity. To gauge which effect is dominant, in figure 13, we compare the terminal (mass-weighted) collective lateral velocities of the unequal survey, separated according to the power-law exponent, with the equal-sphere results. The standard deviation of the equal-sphere
 $\overline {V_T'}$
is indicated by the error bar. Clearly, unequal clusters typically disperse their fragments less effectively than equal clusters, since in only two of the relevant experiments does the collective velocity exceed the mean value of the equal-sphere configuration (0.81), and the majority lie below the lower standard deviation for equal spheres. The scatter in
 $\overline {V_T'}$
for a particular power-law index is generally far greater than that of the equal clusters, which likely reflects a stronger dependence on the random positions of the initial arrangement (similar to the smaller equal-sphere populations). Overall, we thus conclude that mass-retention effects from subclustering are dominating enhanced ejection of the smallest spheres for these unequal clusters. There are, however, also some variations based on the value of
 $\alpha$
. Beginning from values modestly below the equal-sphere mean for
 $\alpha = 1$
and
 $5$
(0.72 and 0.73, respectively),
 $\overline {V_T'}$
reaches a minimum 0.65 at
 $\alpha = 3$
. This approximately equates to a 19 % decrease in the terminal lateral momentum compared to equal-sphere clusters, enough to considerably influence the extent of the ground-damage ellipse. That values at
 $\alpha = 5$
begin to approach the equal-cluster mean is consistent with the reversion to equal-sphere compositions in the high-
 $\alpha$
limit.
3.5. Lateral velocity distributions
From a modelling standpoint, the expected velocity of a given sphere when separating from a cluster of a specified population is also a key quantity. To evaluate the lateral velocity distributions of spheres originating from various equal clusters, we pool all terminal velocities by cluster population, effectively stacking frequency distributions of the individual experiments (5, 4, 1 and 3 experiments for
 $N = 27$
, 52, 99 and 115). For the limited number of spheres with a negative terminal velocity, we take the absolute value (as such bodies will attain positive separation velocities following a closest approach to the cluster centre of mass). The resulting probability density functions (PDFs) are presented in figure 14 (PDFs for the individual 52- and 115-sphere experiments are provided in Appendix A). To characterise these PDFs, we introduce the Rayleigh distribution, defined as
 \begin{align} f_r(V'_T;\sigma _r) = \frac {V'_T}{\sigma _r^2}\exp \left (-\frac {V_T'^2}{2\sigma _r^2}\right ), \end{align}
where
 $\sigma _r$
is the scale parameter. In figure 14 we provide the best-fit Rayleigh curve for each stacked dataset, along with the scale parameter and the confidence with which the null hypothesis can be rejected, as computed using Pearson’s
 $\chi ^2$
goodness-of-fit test. The Rayleigh fits conform to the combined data quite well, although the confidence level varies between cluster populations, with higher confidence levels for the more converged statistics of the
 $N=52$
and 115 cases. The 99-sphere test demonstrates that the Rayleigh distribution remains consistent with isolated experiments, but with the reduced confidence of a smaller sample size.
The PDFs of lateral velocity for several equal-sphere cluster populations, with best-fit Rayleigh distributions superposed.

To extend this description to unequal clusters, we first note that smaller bodies tend to be ejected more severely than larger bodies, so a single Rayleigh distribution is unlikely to provide an accurate representation. Therefore, we try decomposing clusters from experiments with the same power-law index into groups of common sphere size, and examine the lateral velocity distributions of each of these subsets. Figure 15(a) depicts the measured lateral velocity distributions for three selected sphere sizes over all
 $\alpha = 3$
experiments, in each case with the Rayleigh curve of best fit shown. Although the population of the largest size is insufficient for satisfactory convergence, each radius group approximately conforms to a distinct Rayleigh distribution. There will thus be a unique dependence of the radius-group-specific mean lateral velocity,
 $\overline {V_{T,r}'}$
, on
 $r/r_{\textit{max}}$
; this is shown in figure 15(b), and is seen to follow an approximate decaying exponential trend. Fitting an equation of the form
 \begin{align} \overline {V_{T,r}'} = a\,{\rm e}^{-b r/r_{ {max}}} \end{align}
yields the values
 $a = 1.89$
,
 $b = 2.01$
and the solid curve shown in figure 15(b), which is seen to model the data well.
Rayleigh-based fit to separation velocities for
 $\alpha = 3$
experiments. (a) Examples of decomposed velocity distributions, with best-fit Rayleigh distributions shown in dashed lines. (b) Exponential fits to the mean lateral velocity with sphere radius ratio.

Applying a similar decomposition to the other power-law indices gives the radius-dependent distributions (shown in each case for the three smallest
 $r_2/r_1$
values) in figure 16(a) and mean lateral velocities in figure 16(b). Although some deviations from the decaying exponential trends are seen in the latter graph, overall these distributions and curves appear to provide an adequate description of the radius-specific behaviour. We thus conclude that a Rayleigh-based methodology can be reasonably extended to such unequal power-law clusters. The fitted exponential parameters for all values of
 $\alpha$
are provided in table 2.
As we have just noted, an empirical Rayleigh fit appears to provide a reasonable approximation to the lateral velocity distribution in the aerodynamic separation of an initially spherical cluster. It is worth asking at this point whether some physical justification can be provided for this observation, and how reasonable it would be to extend such a statistical description to populations smaller than those that we have considered so far (i.e.
 $N\geqslant 27$
). A Rayleigh distribution arises when considering the magnitude of a variable with two uncorrelated components, each of which is normally distributed with zero mean and equal variances. As
 $V'_T$
is calculated from
 $V'_y$
and
 $V'_z$
in a frame referenced to the centre-of-mass velocity, the zero-mean assumption will automatically be satisfied; equal variance also follows from the lack of preferred direction seen in figure 10 (and can be expected to hold in general for azimuthally symmetrical initial configurations). Correlations between the
 $V'_y$
and
 $V'_z$
distributions might be expected to arise from interactions between individual bodies, e.g. in the formation of subclusters. Such interactions have been seen to play a relatively minor role for larger equal-sphere populations, though their importance will be amplified for unequal and smaller-population equal-sphere clusters. One factor that may mitigate this effect for unequal clusters is that subclustering often occurs between bodies of disparate sizes, and the Rayleigh fits in such cases are performed only within groups of equal sphere sizes.
Exponential parameters for unequal-sphere lateral velocity fit.

Table 2. Long description
A table with three columns and five rows. The columns are labeled alpha, a, and b. The rows are labeled with numbers 1 through 5. The values in the table are as follows: Row 1: alpha, 1, a, 2.14, b, 1.49. Row 2: alpha, 2, a, 2.41, b, 2.07. Row 3: alpha, 3, a, 1.89, b, 2.01. Row 4: alpha, 4, a, 2.00, b, 2.60. Row 5: alpha, 5, a, 1.93, b, 2.63.
Rayleigh-based fits for separation velocities in unequal-sphere experiments. (a) Decomposed Rayleigh fits (dashed lines) for clusters of
 $\alpha =1$
, 2, 4 and 5, with data taken from the three bins of smallest
 $r_2/r_1$
in each case. (b) Mean lateral velocity within each bin for all
 $\alpha$
values, and the associated exponential fits.

(a) Initial front view of an equal-sphere cluster. (b) Stacked
 $V'_y$
and
 $V'_z$
PDFs for the
 $N = 115$
equal-sphere experiments.

Although there is no a priori reason to think that the velocity components should follow exact Gaussian distributions, we can advance some arguments as to why a Gaussian-like form is at least plausible. From the lack of preferred direction in the
 $y$
–
 $z$
plane, and assuming that interactions between individual spheres are relatively unimportant, the separation velocity of a given fragment should be primarily radial relative to its initial position in the cluster. This was shown to be a good assumption in the 13-sphere simulations of Whalen et al. (Reference Whalen, Deiterding and Laurence2026); similarly, in the front view of the 115-sphere experiment movie included in the supplementary material, the lateral velocities are seen to be largely radial (though this is less the case for the 27-sphere experiment also included). Now take the initial front view of a populous equal-sphere cluster shown in figure 17(a). If we consider layers of fragments in the
 $x$
–
 $z$
plane, then primarily radial fragment velocities would imply that the mean
 $V'_y$
component will increase with increasing vertical distance
 $|y|$
from the cluster centre (as a greater fraction of the total velocity vector for an average fragment within the layer will be projected in the
 $y$
-direction), but the number of spheres within the layer will simultaneously decrease. We would thus expect a monotonically decreasing trend in the
 $V'_y$
PDF with increasing
 $|V'_y|$
(and furthermore, considering the shape of the cluster near its central plane, zero slope in the PDF at
 $y=0$
). A distribution with the general characteristics of a Gaussian is thus entirely reasonable, and of course the same arguments apply to the
 $V'_z$
component. A more concrete justification is provided in figure 17(b), where we have plotted the stacked
 $V'_y$
and
 $V'_z$
PDFs over the three
 $N=115$
experiments. We see that the fitted Gaussian curves provide excellent approximations to the distributions (which, unsurprisingly, are very similar to one another). We thus conclude that a Rayleigh form is appropriate for describing the lateral separation velocity distribution in such populous equal-sphere clusters.
For equal-sphere clusters with smaller populations, however, the arguments that we have just advanced are less tenable; in particular, interactions between sphere pairs or localised groups could lead to correlations between velocity components and unequal variances in the relevant distributions, resulting in deviations from a Rayleigh form in the derived separation velocity. Indeed, in figure 18, we present the stacked lateral velocity distribution from the computational 13-sphere survey of Whalen et al. (Reference Whalen, Deiterding and Laurence2026); here, we see strong deviations from a Rayleigh-like shape, with a somewhat bimodal distribution and a more prominent weighting towards lower
 $V'_T$
values (though note that some of this behaviour might be exacerbated by the regular nature of the face-centred-cubic sphere arrangements considered in this study). The latter trend is already somewhat apparent in the
 $N=27$
distribution of figure 14, and for such populations, a generalisation of the Rayleigh form, such as a two-parameter Weibull distribution, might provide a better fit (though the present dataset is not sufficient to constrain suitable choices of parameters). Considering the non-standard shape of the
 $N=13$
distribution in figure 18, however, a different approach is likely required to characterise the velocity distributions for such small populations. In Whalen et al. (Reference Whalen, Deiterding and Laurence2026), for example, it was found that the final separation velocity of a given fragment correlated very well with its initial polar angle for both 4- and 13-sphere regular clusters.
The PDF for the lateral separation velocity derived from the computational 13-sphere survey of Whalen et al. (Reference Whalen, Deiterding and Laurence2026).

3.6. Separation modelling
We have seen that the individual fragment lateral velocities are well approximated for both equal and unequal populous sphere clusters by Rayleigh distributions, in the latter case with the scale parameter (the single parameter describing the distribution) being radius-ratio-dependent. In both cases, this leads immediately to the possibility of constructing a simple statistical model to predict fragment dispersion velocities from an agglomeration of a given population (and, for unequal bodies, size distribution). For an equal-sphere cluster of population
 $N$
, the magnitudes of the separation velocities can be obtained by a random sampling from the distribution defined by (3.9). The scale parameter
 $\sigma _r$
is linked to the mean separation velocity by
 \begin{align} \overline {V'_{T}} = \sigma _r \sqrt {\frac {\pi }{2}}, \end{align}
where
 $\overline {V'_T}$
can be derived from (3.7). With the velocity magnitudes thus defined, an assumption must be made regarding the distribution of azimuthal angles. As shown in § 3.3, an isotropic assumption is reasonable, especially for larger populations, meaning that this angle can be randomly sampled from the interval
 $[0,2\pi ]$
. The magnitude of the centre-of-mass offset velocity can similarly be estimated from (3.8), with a random selection of the azimuthal direction being appropriate.
For the more realistic case involving the separation of an unequal fragment cloud, if we begin by assuming a population of 52 spherical bodies with a radius distribution sampled randomly from a truncated power-law distribution, then we can apply a similar methodology. Now, however, we would use the size-dependent mean lateral velocity given by (3.10) in place of the equal-sphere mean (represented by (3.7)). Note that our experimental clusters were truncated at
 $r_{\textit{min}}/r_{\textit{max}}=0.25$
, a constraint that was imposed for practical reasons but which we have no reason to expect to hold in an actual fragmentation event. To include smaller radius ratios, we can simply extrapolate our exponential curves; this may become inaccurate for extremely small fragments, but such bodies can be expected to have a negligible influence on the overall cluster dynamics in any case. For populations other than
 $N=52$
, if we are to apply the results from our present experiments, then we must assume that the effects of population and unequal sizes can be treated independently. Although this assumption cannot be validated via the present dataset, it is probably reasonable over at least a certain range of populations, especially considering that the unequal-sphere mean velocities differed only modestly from the equal-sphere value. The size-dependent mean lateral velocity can then be scaled according to
 \begin{align} \overline {V_{T,r}'}\big {|}_N = \overline {V_{T,r}'}\big {|}_{N=52} \times \frac {\overline {V'_T}\big {|}_N}{\overline {V'_T}\big {|}_{N=52}}, \end{align}
where
 $\overline {V_{T,r}'} {|}_{N=52}$
is the corresponding value from (3.10), and both
 $\overline {V'_T} {|}_N$
and
 $\overline {V'_T} {|}_{N=52}=0.82$
are evaluated via (3.7). Given the significant degree of subclustering present for unequal clusters, the assumption of azimuthal isotropy may become somewhat more tenuous here. Such subclustering could potentially be accounted for in a statistical sense by first assigning random azimuthal angles to the larger fragments and subsequently increasing the bias towards these selected angles when assigning values to smaller fragments that have similar lateral velocity magnitudes. Later-time interactions could then be accommodated using a theoretical sphere-interaction model (Laurence et al. Reference Laurence, Deiterding and Hornung2007; Laurence & Deiterding Reference Laurence and Deiterding2011). Subclustering effects are likely to have only a small influence on the bulk separation statistics beyond that already captured in (3.10), however, and an assumption of isotropy in the azimuthal angle is a reasonable first-order approximation. Similarly, the centre-of-mass offset could again be estimated using (3.8).
Sample lateral velocities generated from the proposed statistical separation model: (a) equal spheres with population
 $N=80$
, and (b) unequal spheres with
 $\alpha = 3$
and
 $N=200$
. The dashed circle in each case represents the mean lateral separation velocity of the cluster.

We demonstrate this modelling approach in figure 19. Here, examples of the
 $y{-}z$
velocity distribution for an
 $N=80$
equal-sphere cluster and an
 $N=200$
,
 $\alpha =3$
unequal cluster generated using these steps are shown. In the latter case,
 $r_{ {min}}/r_{ {max}}$
has been set to 0.1 (with marker sizes scaled according to fragment radius), and in both cases the mean lateral velocity magnitude is indicated by the dashed circle. To model the probabilistic outcome of a meteoroid fragmentation event with uncertain entry and break-up parameters, such outputs could be directly incorporated within a Monte Carlo methodology to seed the lateral velocities of fragments at the moment of atmospheric disruption prior to simulating the remainder of their flight to the ground; this would enable the investigation of energy deposition and ground damage characteristics over the relevant parameter space. While such a statistical approach is commonly employed in the literature, the measurements provided here would, for the first time, provide a experimentally validated physical basis for the incorporated fragment-separation model.
3.7. Highly expelled spheres
Finally, noting from figure 14 that individual separation velocities can far exceed the mean value, we address the origin(s) of highly expelled bodies; these may, for example, produce far outlying fragments in strewn fields (Laurence & Deiterding Reference Laurence and Deiterding2011) or anomalously high velocities in observations (Borovicka & Kalenda Reference Borovicka and Kalenda2003). In figure 20(a), we show the lateral velocity time series of the ten spheres that exhibit the highest scaled separation velocities, i.e. the sphere’s maximum
 $V'_T$
divided by the terminal collective
 $\overline {V'_T}$
for its cluster, over the equal-sphere survey (representing more than 1000 spheres in total). Each curve is coloured by the trajectory type: blue for lifting pairs (Whalen et al. Reference Whalen, Deiterding and Laurence2026), red for shock surfing, or yellow for collisions. Shock surfing constitutes the most prevalent type of interaction (four expulsion events), while collisions and lifting pairs each occur twice in this set (the latter contributing four spheres in total). For reference, of the eight episodes considered, one occurred in each of a 14-, 15- and 32-sphere cluster, two in the 99-sphere cluster, and three in 115-sphere clusters. The colliding sphere at
 $t' = 5.25$
, taken from a 14-sphere experiment, is the only ejection that unambiguously occurs during the secondary separation phase.
Time-resolved lateral velocities of the most ejected spheres in the survey. (a) Equal-sphere experiments with trajectory type classified by the means of expulsion: blue for lifting pairs, red for shock surfing, and yellow for collisions. (b) Lateral velocities of the most ejected spheres in the unequal-cluster survey, coloured by power-law exponent.

The dominance of shock surfing as a source for extreme lateral expulsion events is reinforced by figure 20(b), which shows corresponding results for the unequal clusters, coloured according to
 $\alpha$
value. All but two of the events recorded here were ascertained to result from shock surfing, with no evidence of either collisions or lifting spheres in any of the trajectories. The remaining two events seem to have originated from acute repulsion earlier in the experiment (before the relevant sphere was visible). These severely ejected bodies overwhelmingly occur in ‘heavy’ clusters, i.e.
 $\alpha=1,2$
, but this apparent bias may simply be an artefact of practical considerations in cluster construction.
The maximum normalised velocities for unequal spheres shown in figure 20(b), approaching
 $V'_T=3.5$
, are significantly higher than any estimates of the separation coefficient in related literature, and also substantially exceed the maximum separation velocities observed for equal-sphere clusters in figure 20(a) (
 $V_{T,{max}}'\approx 2.7$
). Although these measurements still cannot account for the severe repulsion observed in the Morávka fall (
 $V_T'\sim 10$
), note that we have truncated our minimum to maximum radius ratio at
 $1/4$
in these experiments, and smaller bodies would be expected to achieve even higher separation velocities. Moreover, the present results can be considered analogous to solitary fragmentation events, so successive disruption – potentially augmented by non-spherical fragment geometries (Li et al. Reference Li, Sui, Gong and Wu2015; Seltner et al. Reference Seltner, Willems and Gülhan2024) – could quite conceivably produce separation velocities consistent with the observations of the Morávka airburst.
4. Conclusions
In this work, we have conducted experiments to investigate the separation of spherical fragments from an initially spherical parent agglomeration in hypersonic flow, representing an idealised version of a meteoroid fragmentation event. Both equal-sphere clusters with populations of up to 115 bodies and unequal (power-law) clusters of a fixed population (
 $N=52$
) were examined. In a given experiment, spheres of the chosen population or size distribution were arranged randomly within a custom suspension mechanism, and hung inside the test section of a Mach 6 shock tunnel. Upon flow arrival, the mechanism was rapidly opened by aerodynamic forces and swept away, releasing the cluster into the flow in an approximately impulsive manner; spheres were thereafter free to respond to the experienced forces. The separating clusters were visualised with a high-speed, orthogonal stereoscopic imaging system, which, together with high-precision optical tracking algorithms applied to the recorded images, allowed the sphere trajectories to be accurately recovered, and their velocities to be subsequently derived.
For the larger equal-sphere populations, the primary (initial) separation phase was marked by streamwise compression and lateral expansion of the cluster into an elliptical form, consistent with the pancake model for highly disrupted bodies, followed by a further deformation that produced a roughly conical profile, then bulk dispersal that marked the transition to the secondary phase. For less populous clusters, the initial pancake-like deformation was less prominent, and the behaviour during the primary phase was far more sensitive to the exact arrangement of fragments. Collisions often played a significant role in dispersing the cluster core, and for smaller populations, could have a significant effect on the collective separation velocity during the secondary phase. The lateral expansion factor during the primary phase was found to be approximately 2, and varied little with population, confirming a common assumption in the pancake model. The primary separation time scale meanwhile decreased significantly with increasing population.
The collective separation velocity versus population over the equal-sphere survey was fitted with a power law, and exponent 0.4 was found to match the data very well – this is a somewhat weaker dependence than the square root proposed by earlier authors based on smaller populations (up to 6 bodies). For unequal-sphere clusters, a qualitative examination of several experiments revealed the extensive formation of drafting subclusters about larger bodies within the sphere swarm; this behaviour was most prominent for lower to intermediate values of the power-law exponent
 $\alpha$
that governed the fragment size distributions. These subclusters tended to retain significant mass close to the cluster centre, an effect that was compensated for to some extent by the violent repulsion of some of the smaller fragments. Calculation of the mass-weighted collective separation velocities suggested that subclustering was the dominant of these two effects, however, with overall reduced values compared to the equal-sphere case. A minimum in the collective velocity was seen for
 $\alpha =3$
, with corresponding values for
 $\alpha =1$
and 5 almost reverting to the equal-sphere result (which would correspond to
 $\alpha =\pm \infty$
).
The individual fragment separation velocities for more populous equal-sphere clusters were found to be generally well modelled by a Rayleigh distribution. Since this is a single-parameter distribution, the mean collective velocity from the power-law fit is then sufficient to fully characterise (in a statistical sense) the separation of equal spherical fragments from a spherical parent body. This Rayleigh model was then extended to accommodate unequal sphere sizes: each sphere-size population for a given
 $\alpha$
was found to approximately follow its own Rayleigh distribution, with the mean value obeying an approximate exponential decay with increasing radius. Appropriate exponential coefficients were determined for each of the power-law exponents, which allowed the construction of a simple statistical model to simulate the separation of unequal spherical fragments from an initially spherical parent body. This model can be directly applied to meteoroid fragmentation problems, and has a much more rigorous grounding in experimental data than prior models.
Finally, the origins of the most-expelled fragments in the two surveys were examined, with shock surfing identified as the most important mechanism. Lifting pairs and collisions also produced some notable outlying separation events for equal spheres, but these mechanisms are likely to be less relevant in more realistic fragmentation scenarios. The maximum normalised separation velocities observed were of the order of 2.7 for equal spheres, and 3.5 for unequal spheres, which is significantly higher than has been seen in prior studies examining more limited populations, and much closer to values derived from observations of the 2000 Morávka airburst.
Clearly, the specification here of a spherical parent body and exclusively spherical fragments represents a significant idealisation compared to an actual meteoroid fragmentation event, though one that was necessary to make the separation problem tractable. Nevertheless, the present study has provided significant insight into the interacting flow physics of fragments in high-speed agglomerations, much of which can be expected to hold in more realistic cases. Moreover, it would be relatively straightforward to generalise the experimental methodology developed here to accommodate less regular geometries for both the progenitor body and fragments; this is planned for future work.
Supplementary movies
Supplementary movies are available at https://doi.org/10.1017/jfm.2026.11846.
Funding
T.J.W. was supported by a NASA Space Technology Research Fellowship throughout this work.
Declaration of interests
The authors report no conflict of interest.
Appendix A
In figure 21, we present the lateral velocity distributions from the individual
 $N=52$
and
 $N=115$
equal-sphere experiments. As might be expected given the random initial sphere positions in the cluster, there is some degree of variation between the distributions for each
 $N$
, but the general form is broadly consistent across the various realisations.
Normalised separation velocity distributions from individual experiments with (a) 52 equal spheres and (b) 115 equal spheres.

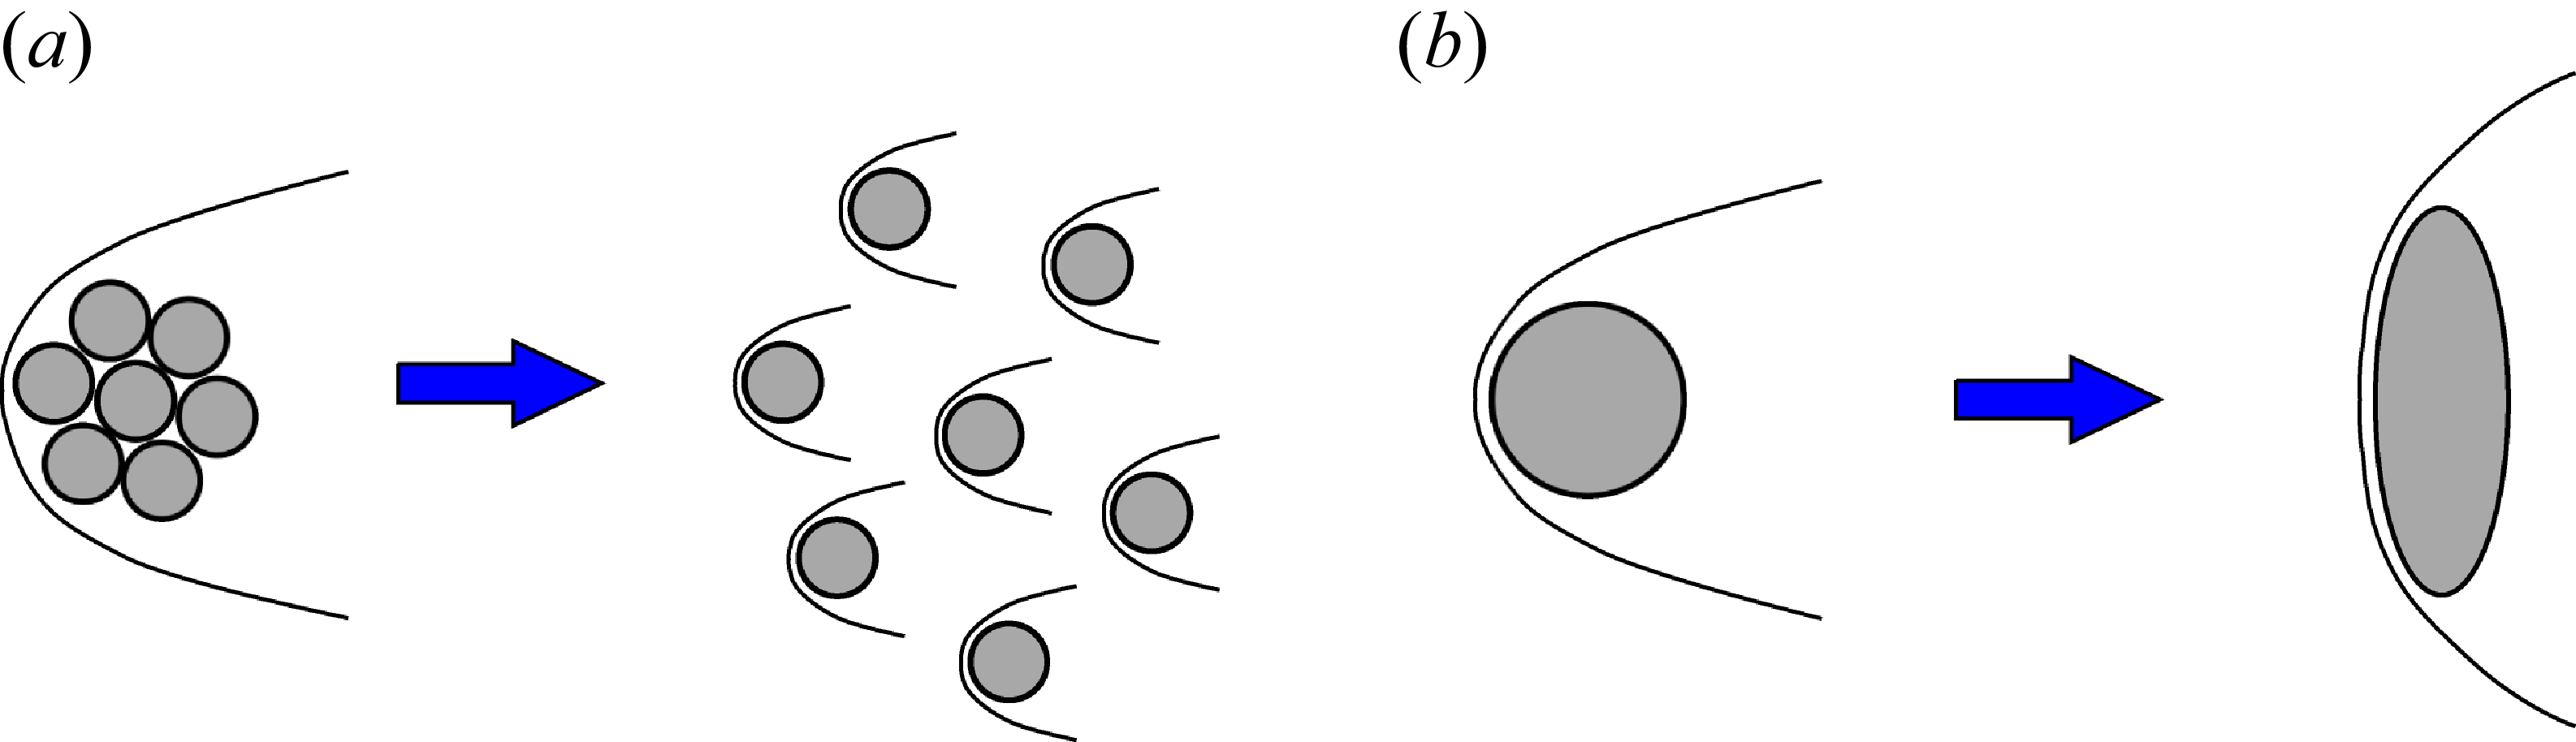

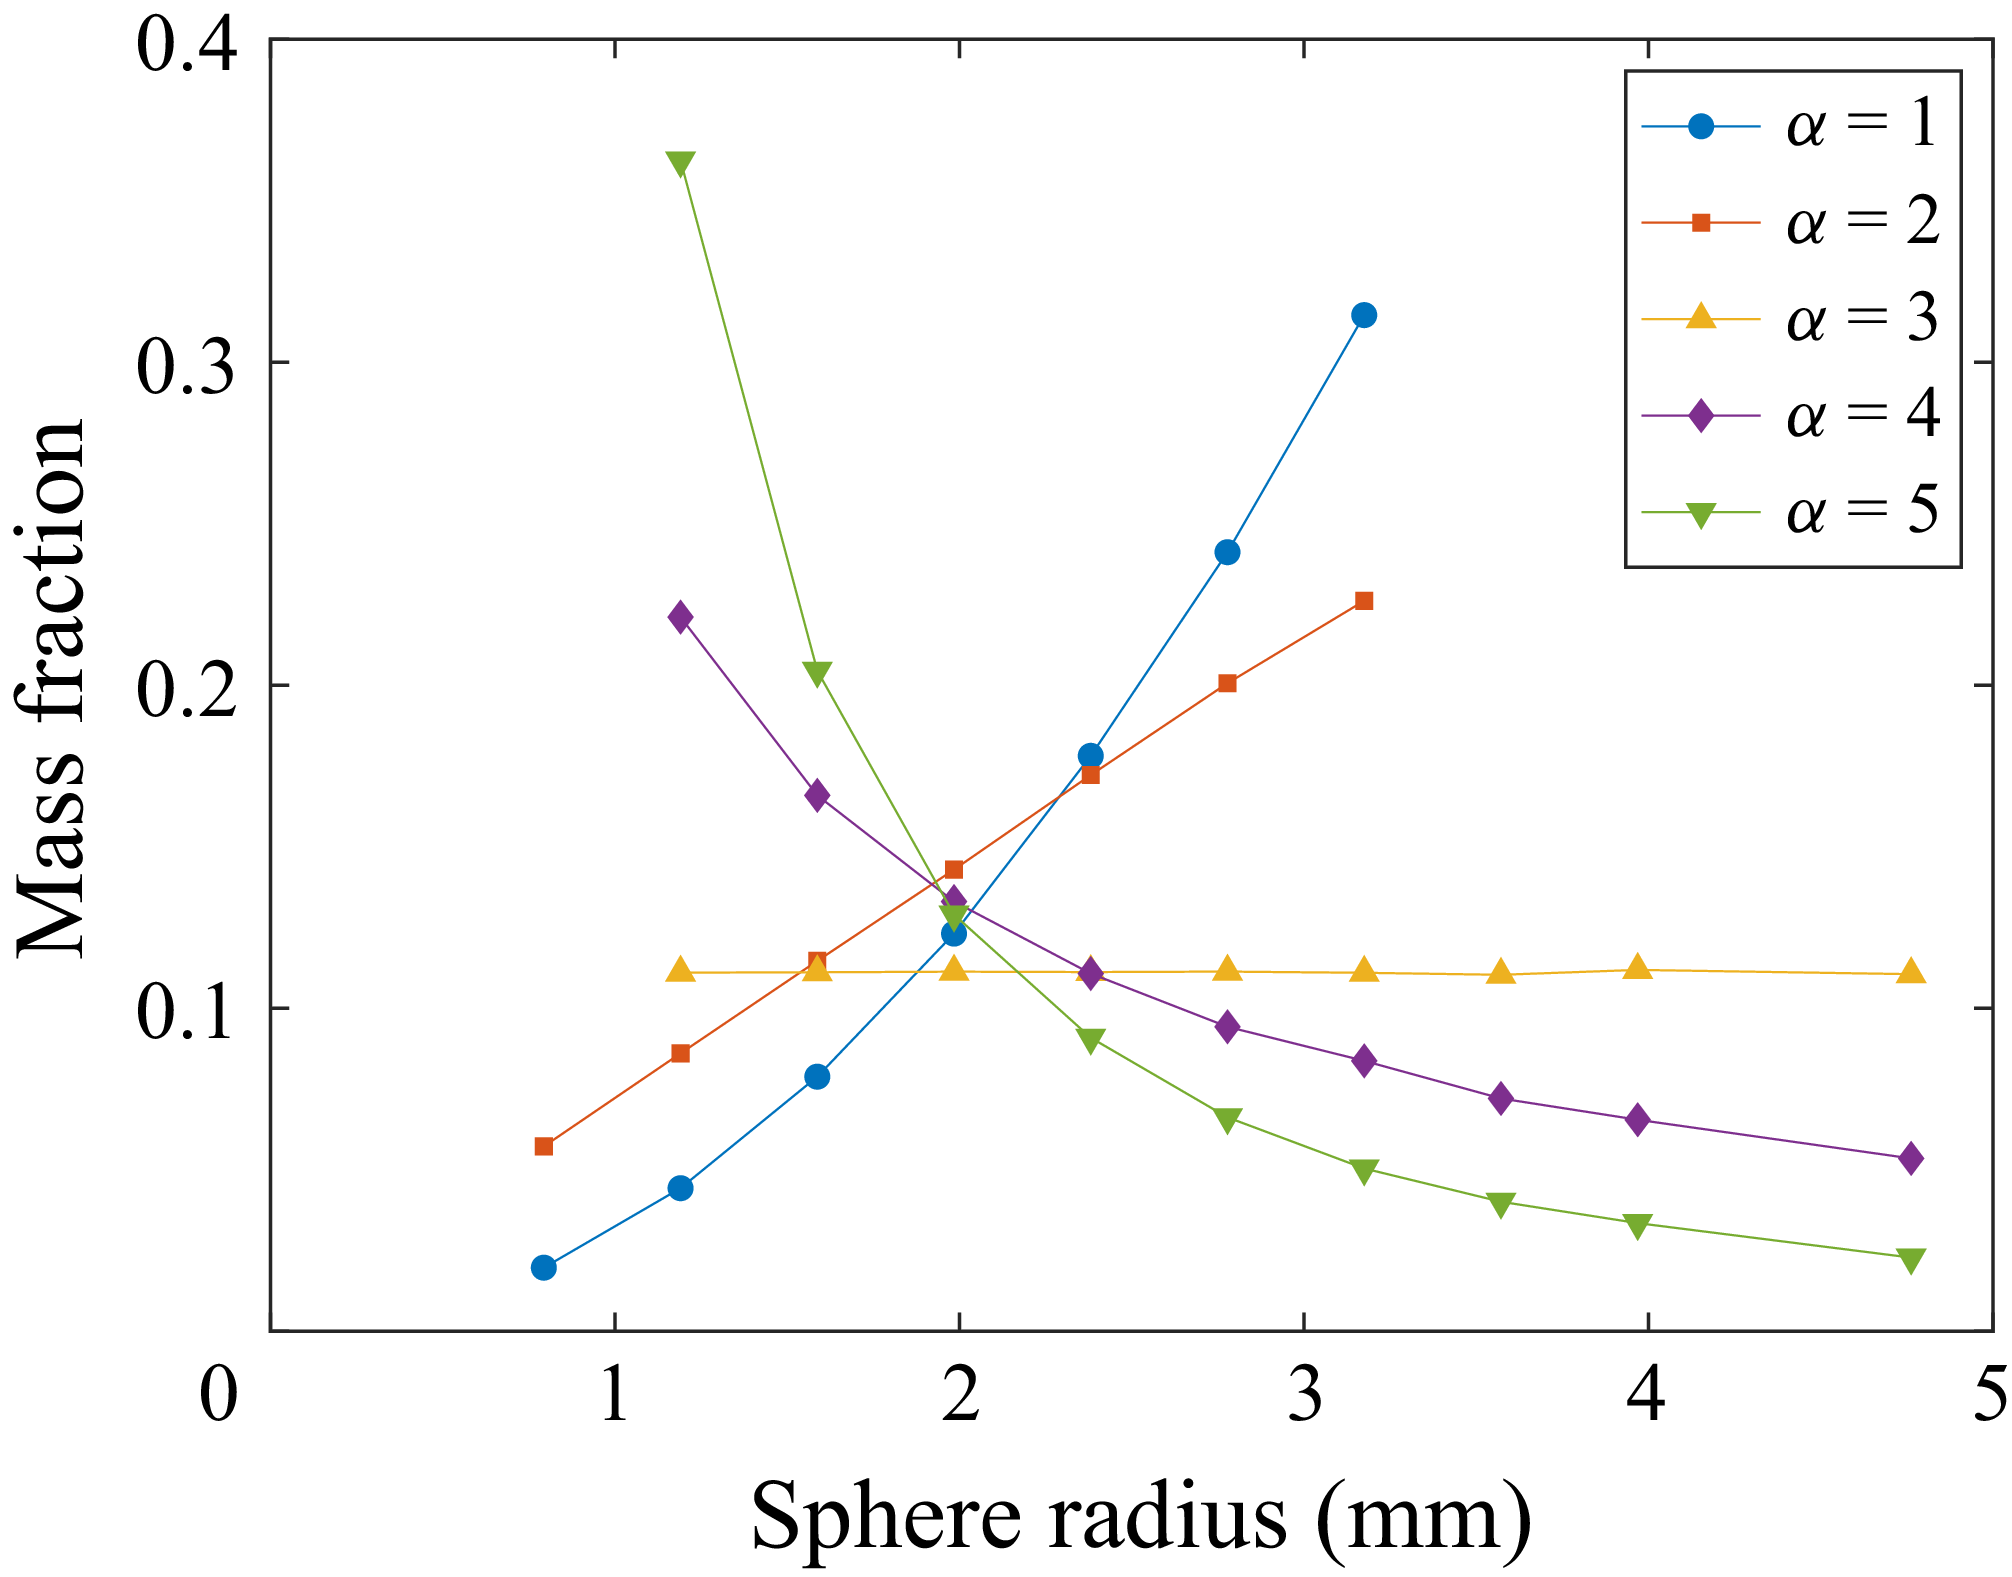
 N=52
 α
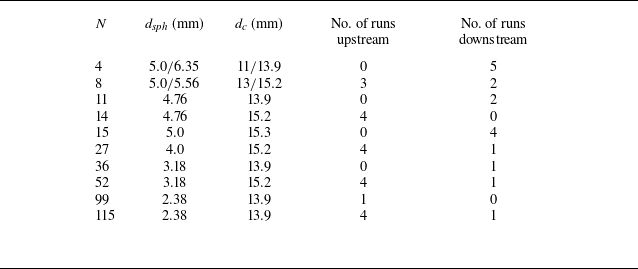

 0.84τs

 0.81τs
 0.87τs

 0.96τs
 1.45ms
 t′=0.55
 VT′¯
 VT,com′
 CT¯

 1.24τs
 1.87ms
 t′=0.54
 t′=4.26
 VT′¯
 VT,com′

 α=2
 α=5
 0.90τs

 α=3
 N=52
 0.64τs


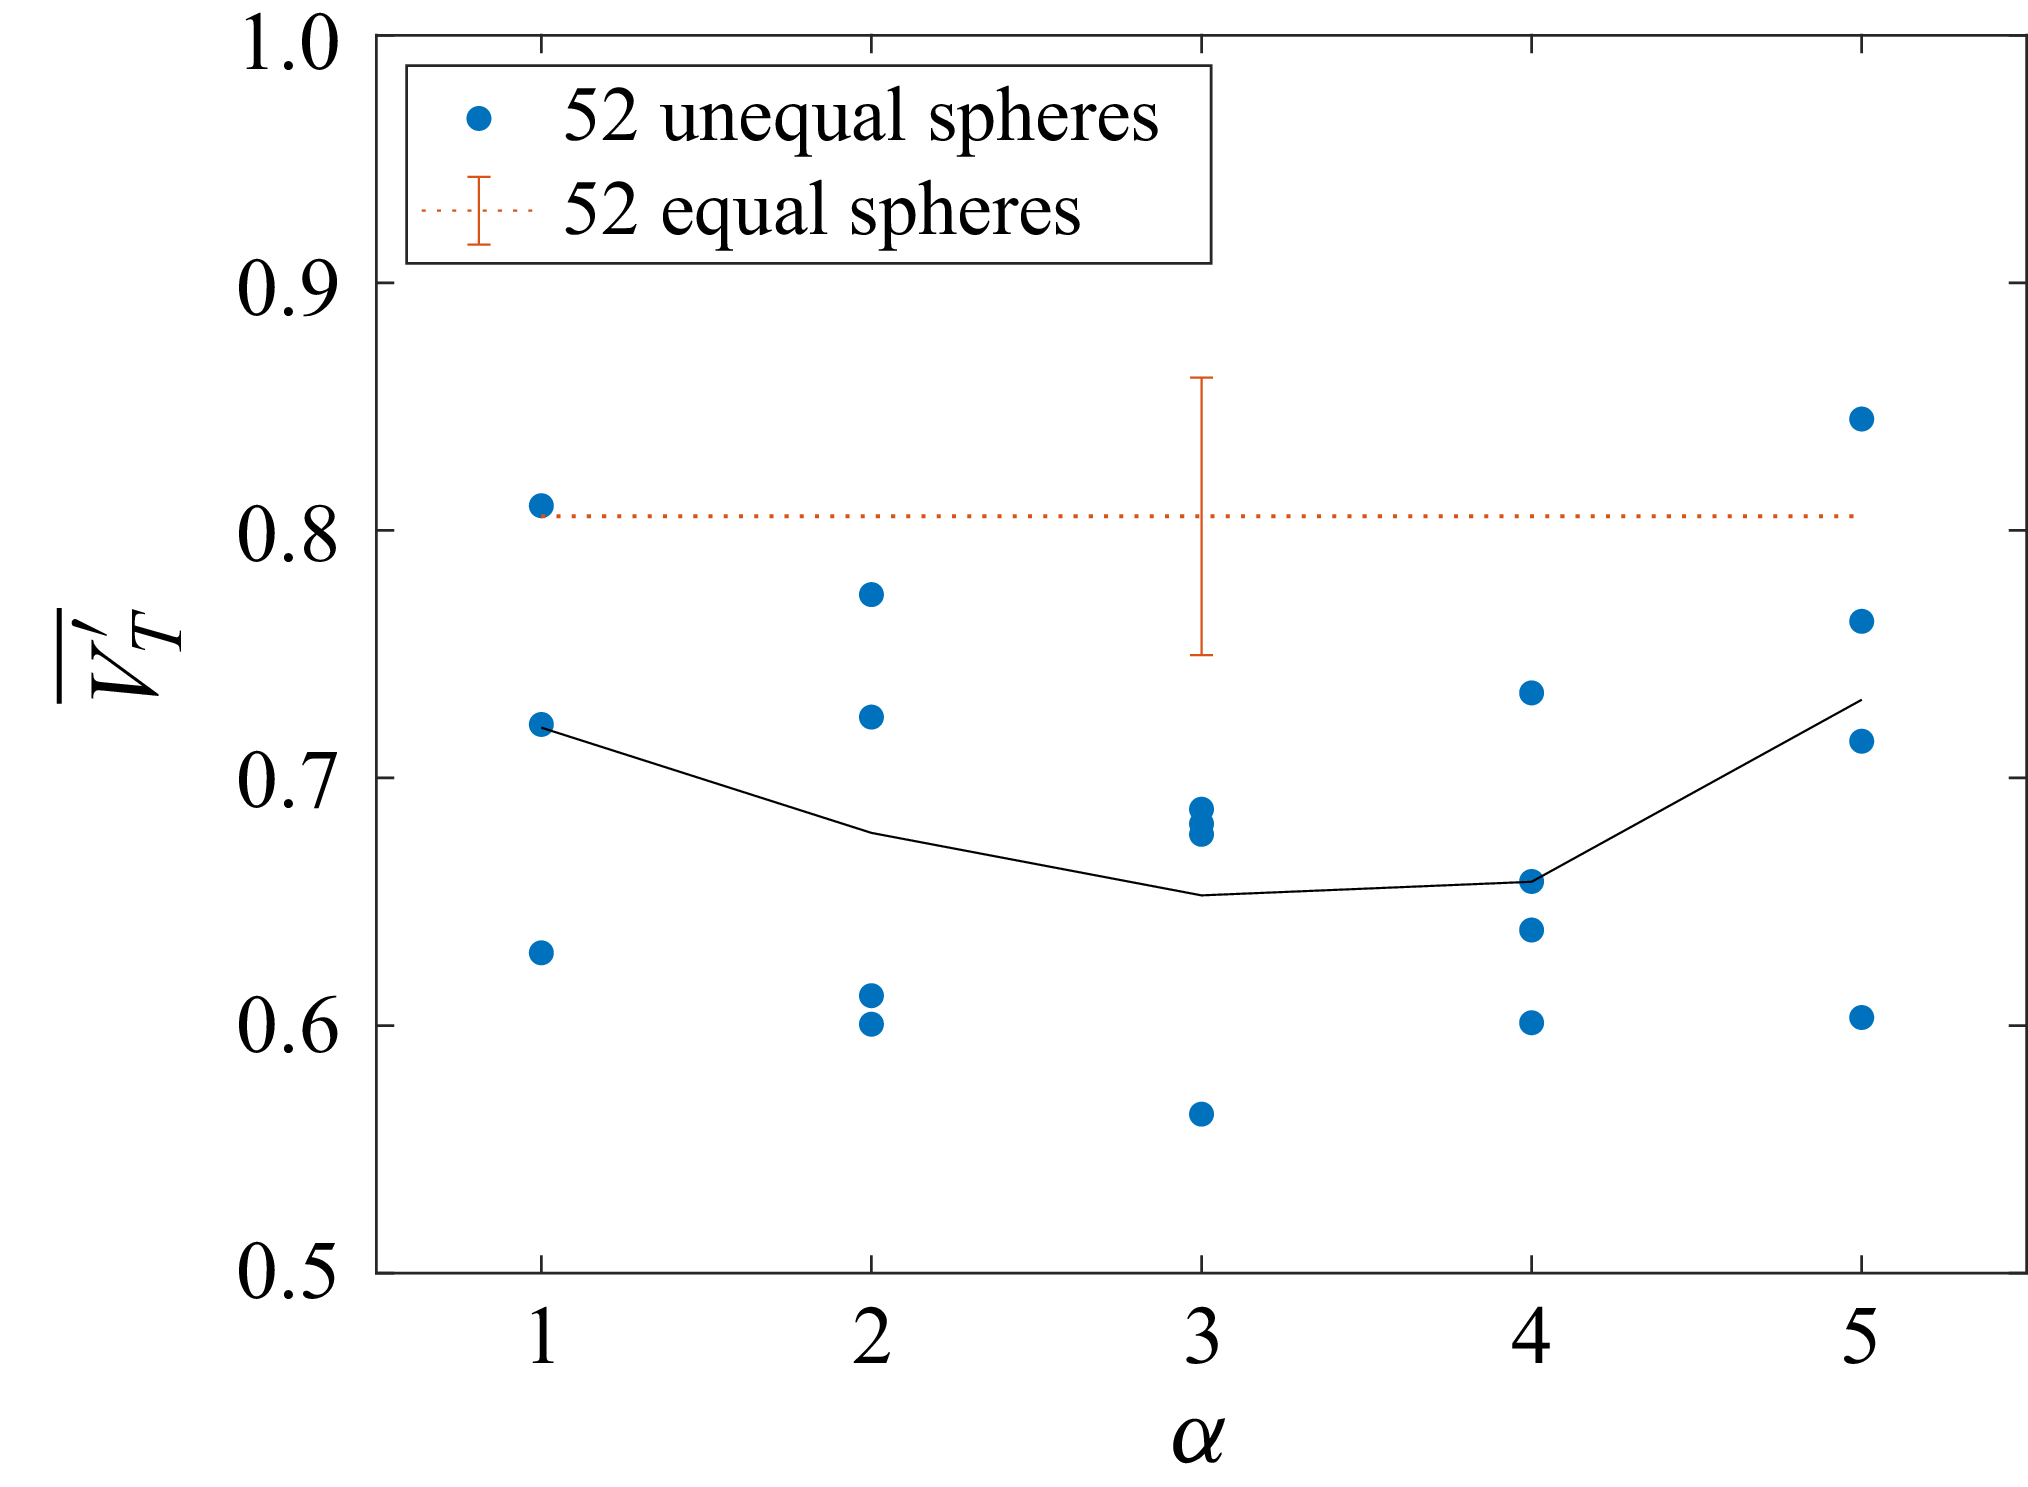

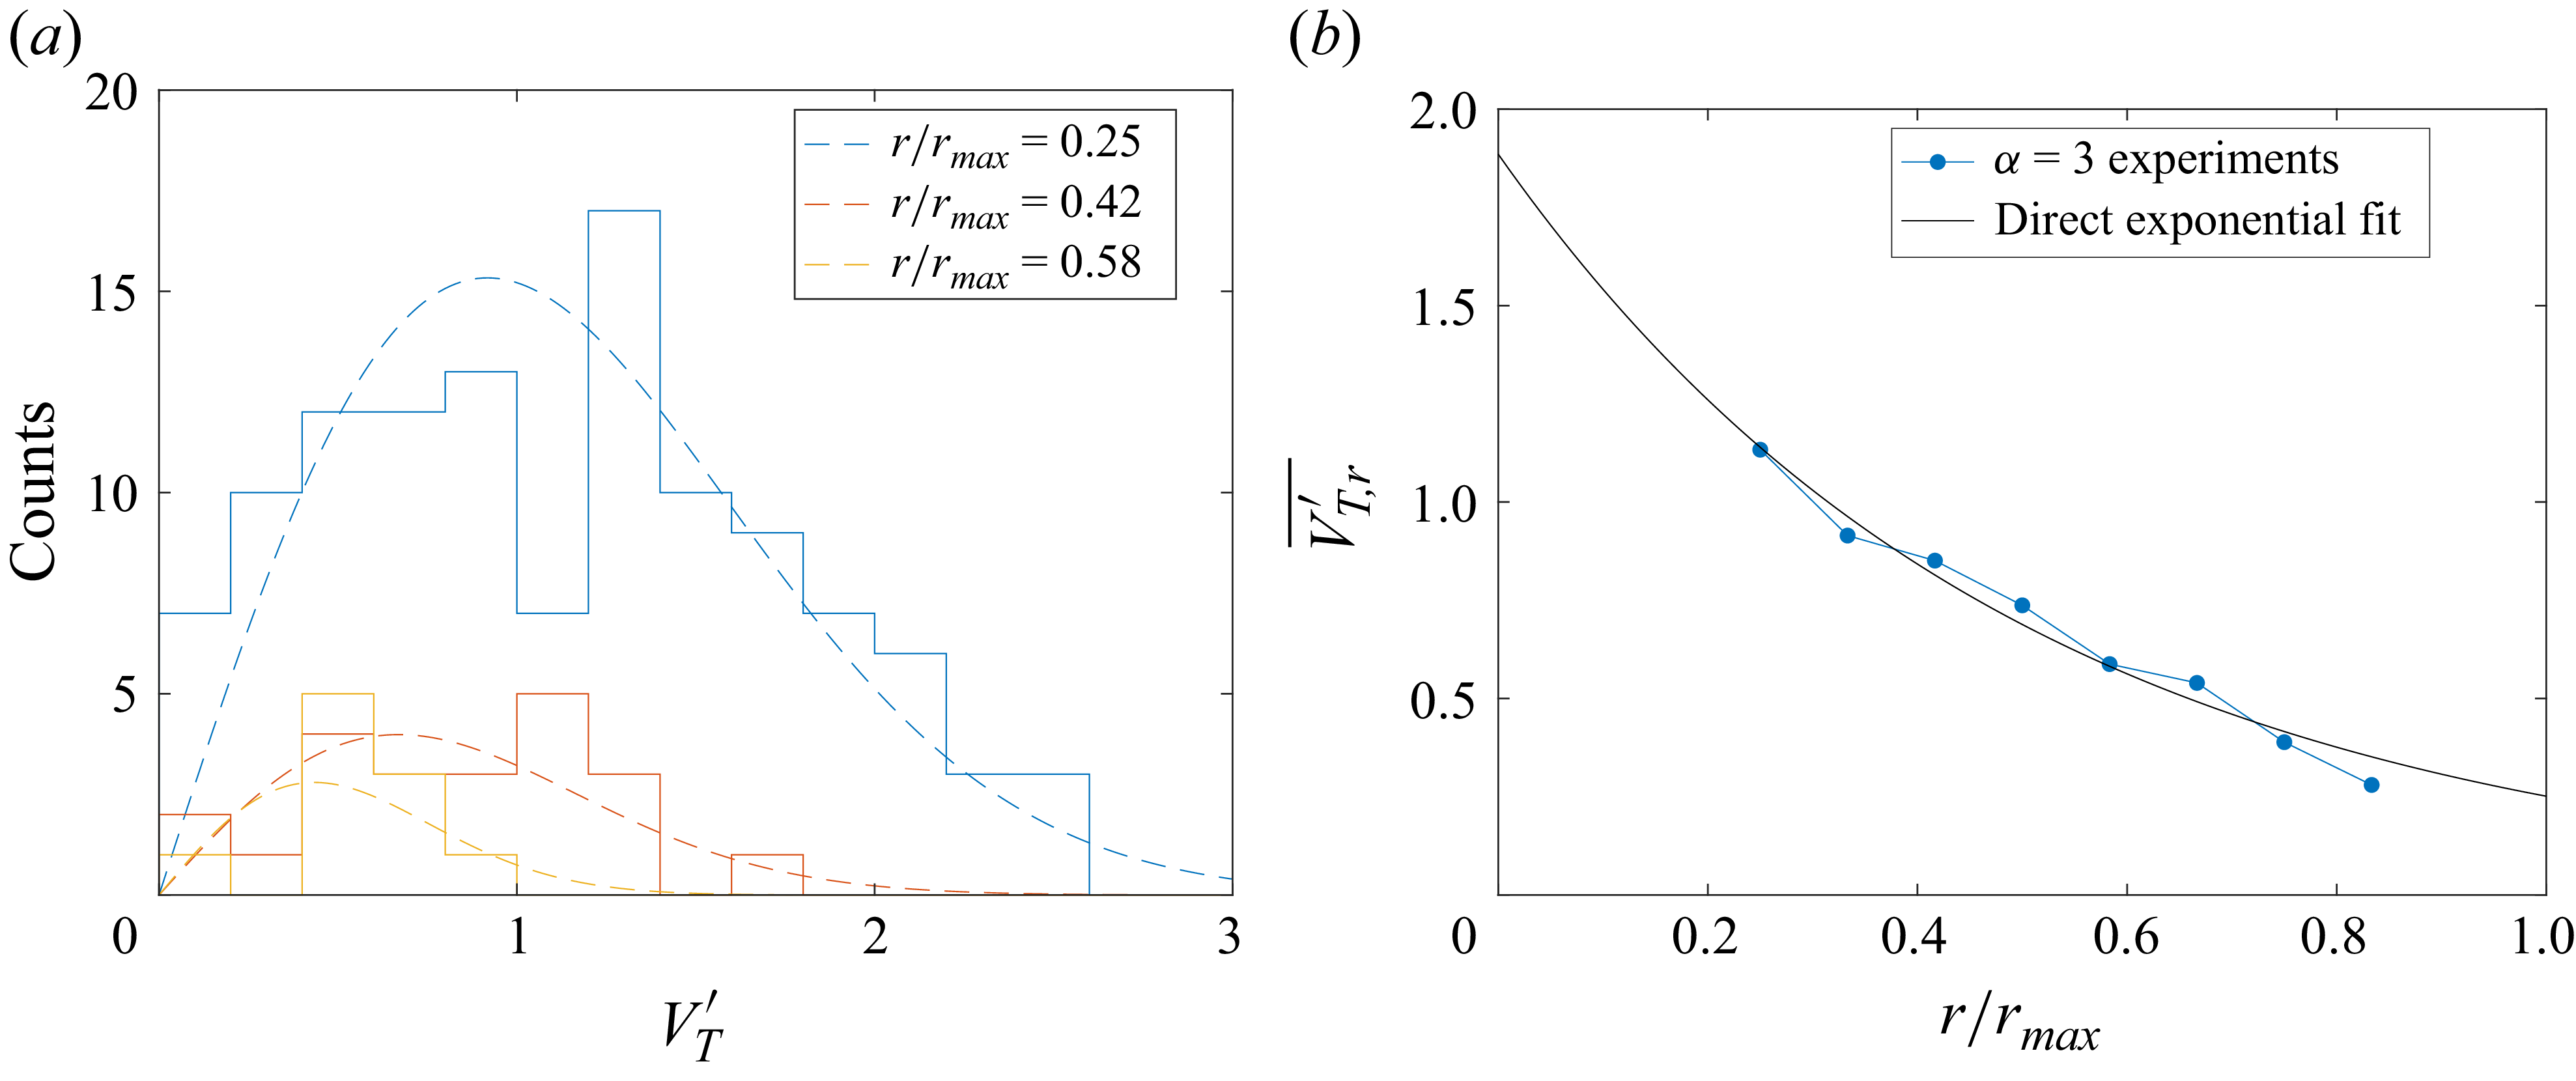
 α=3
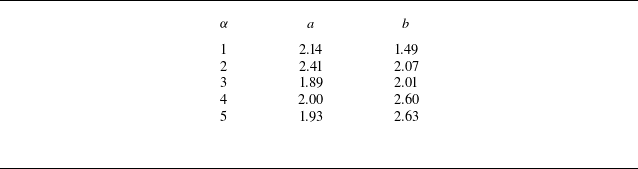

 α=1
 r2/r1
 α

 Vy′
 Vz′
 N=115
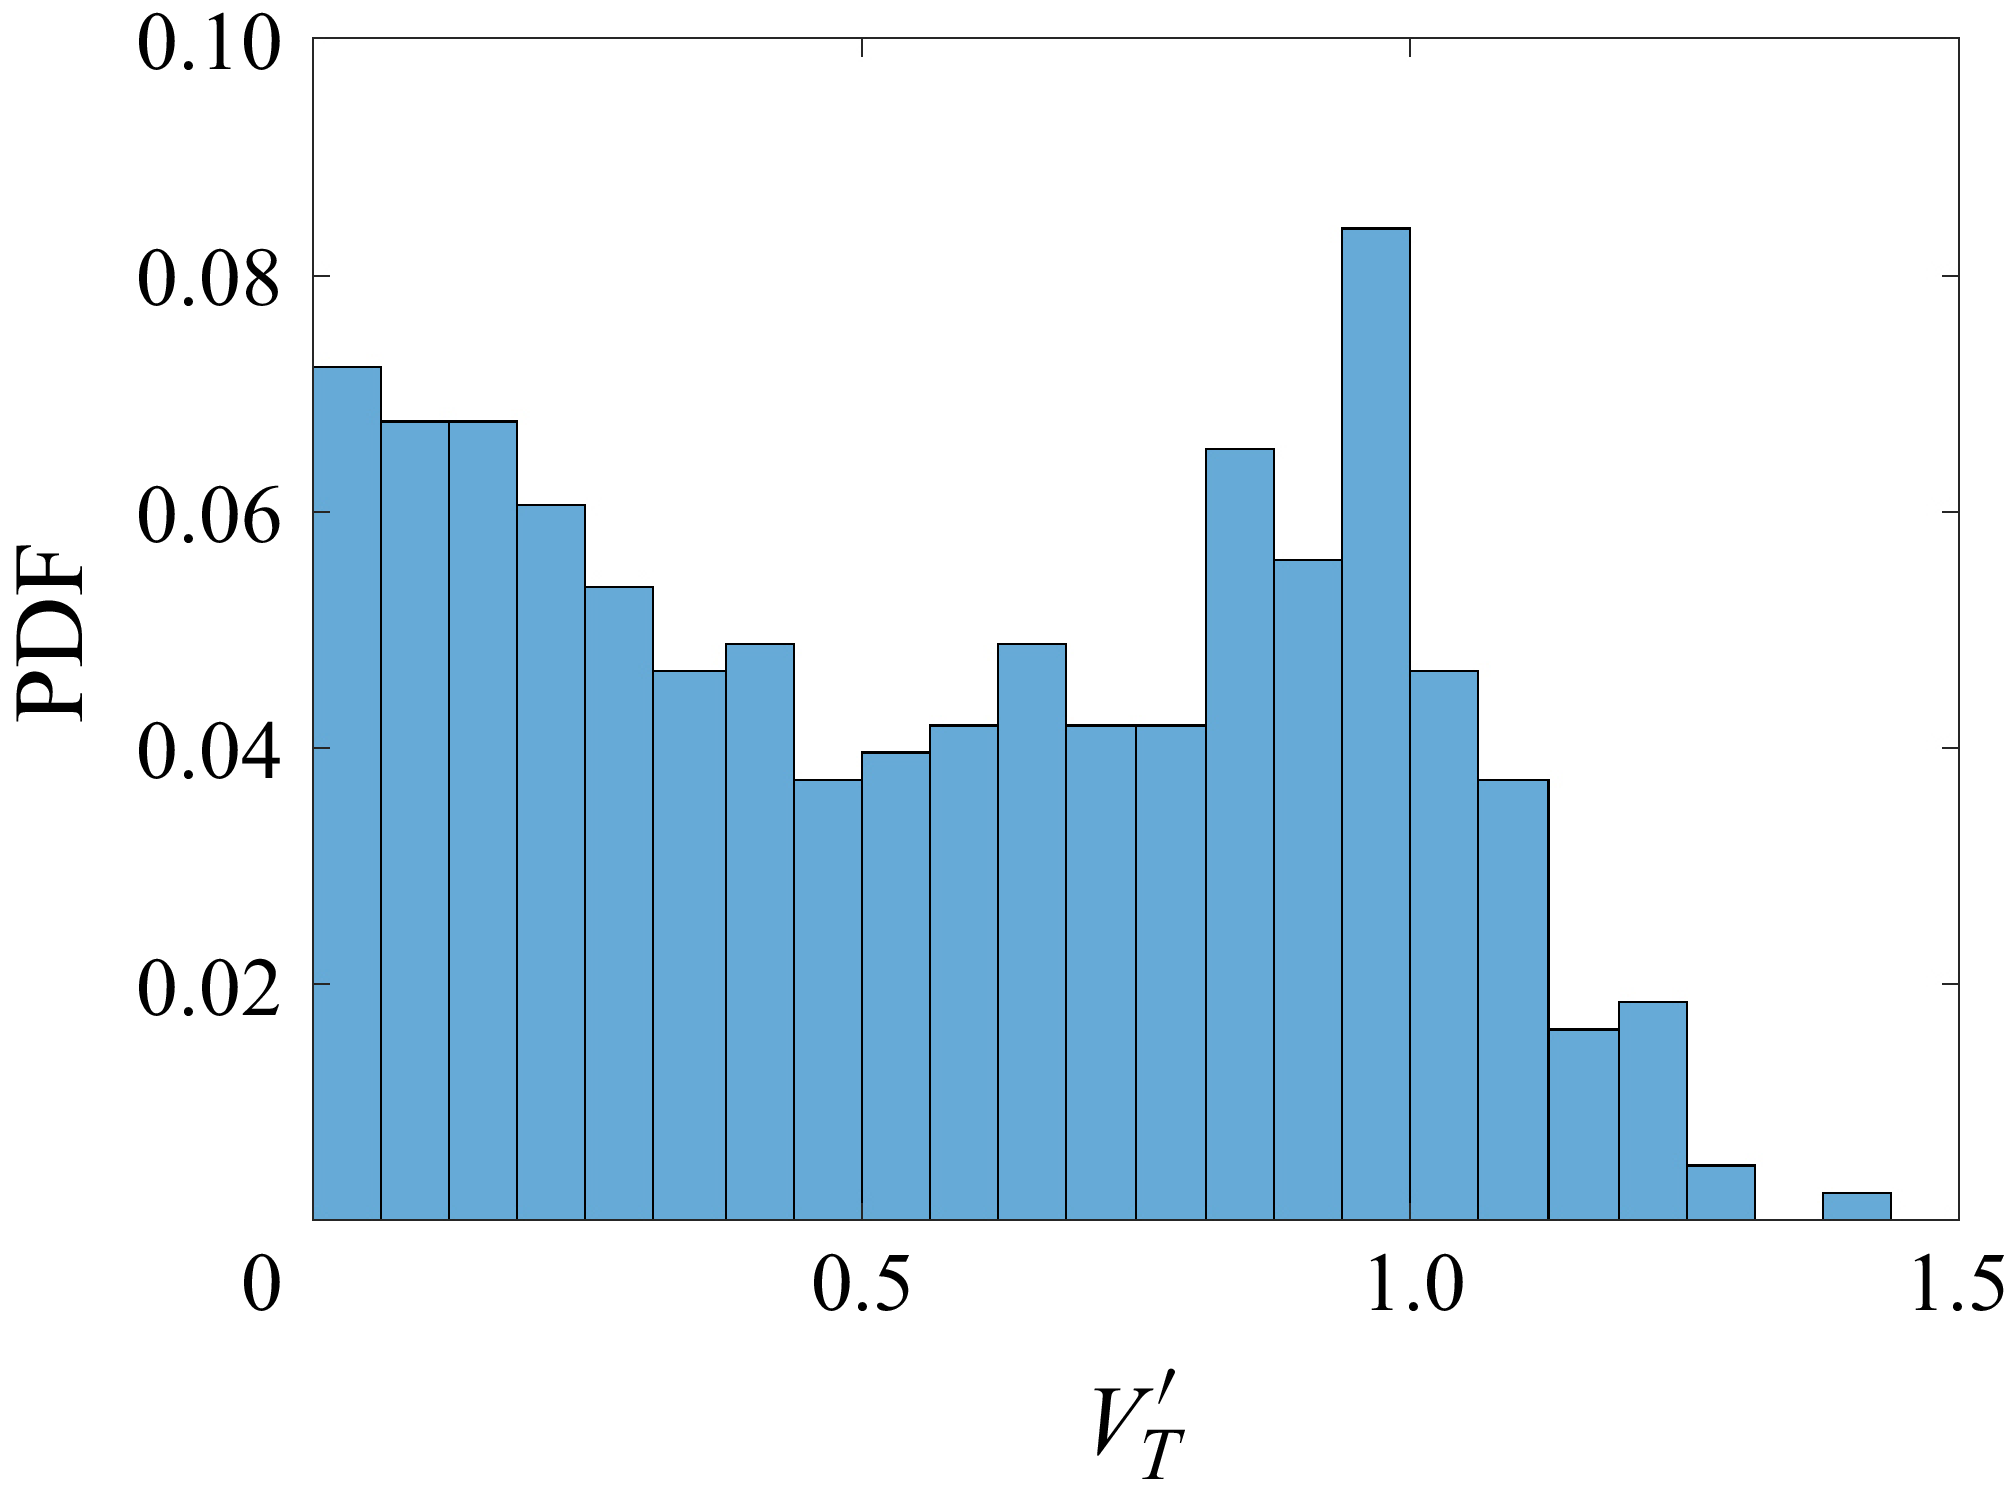
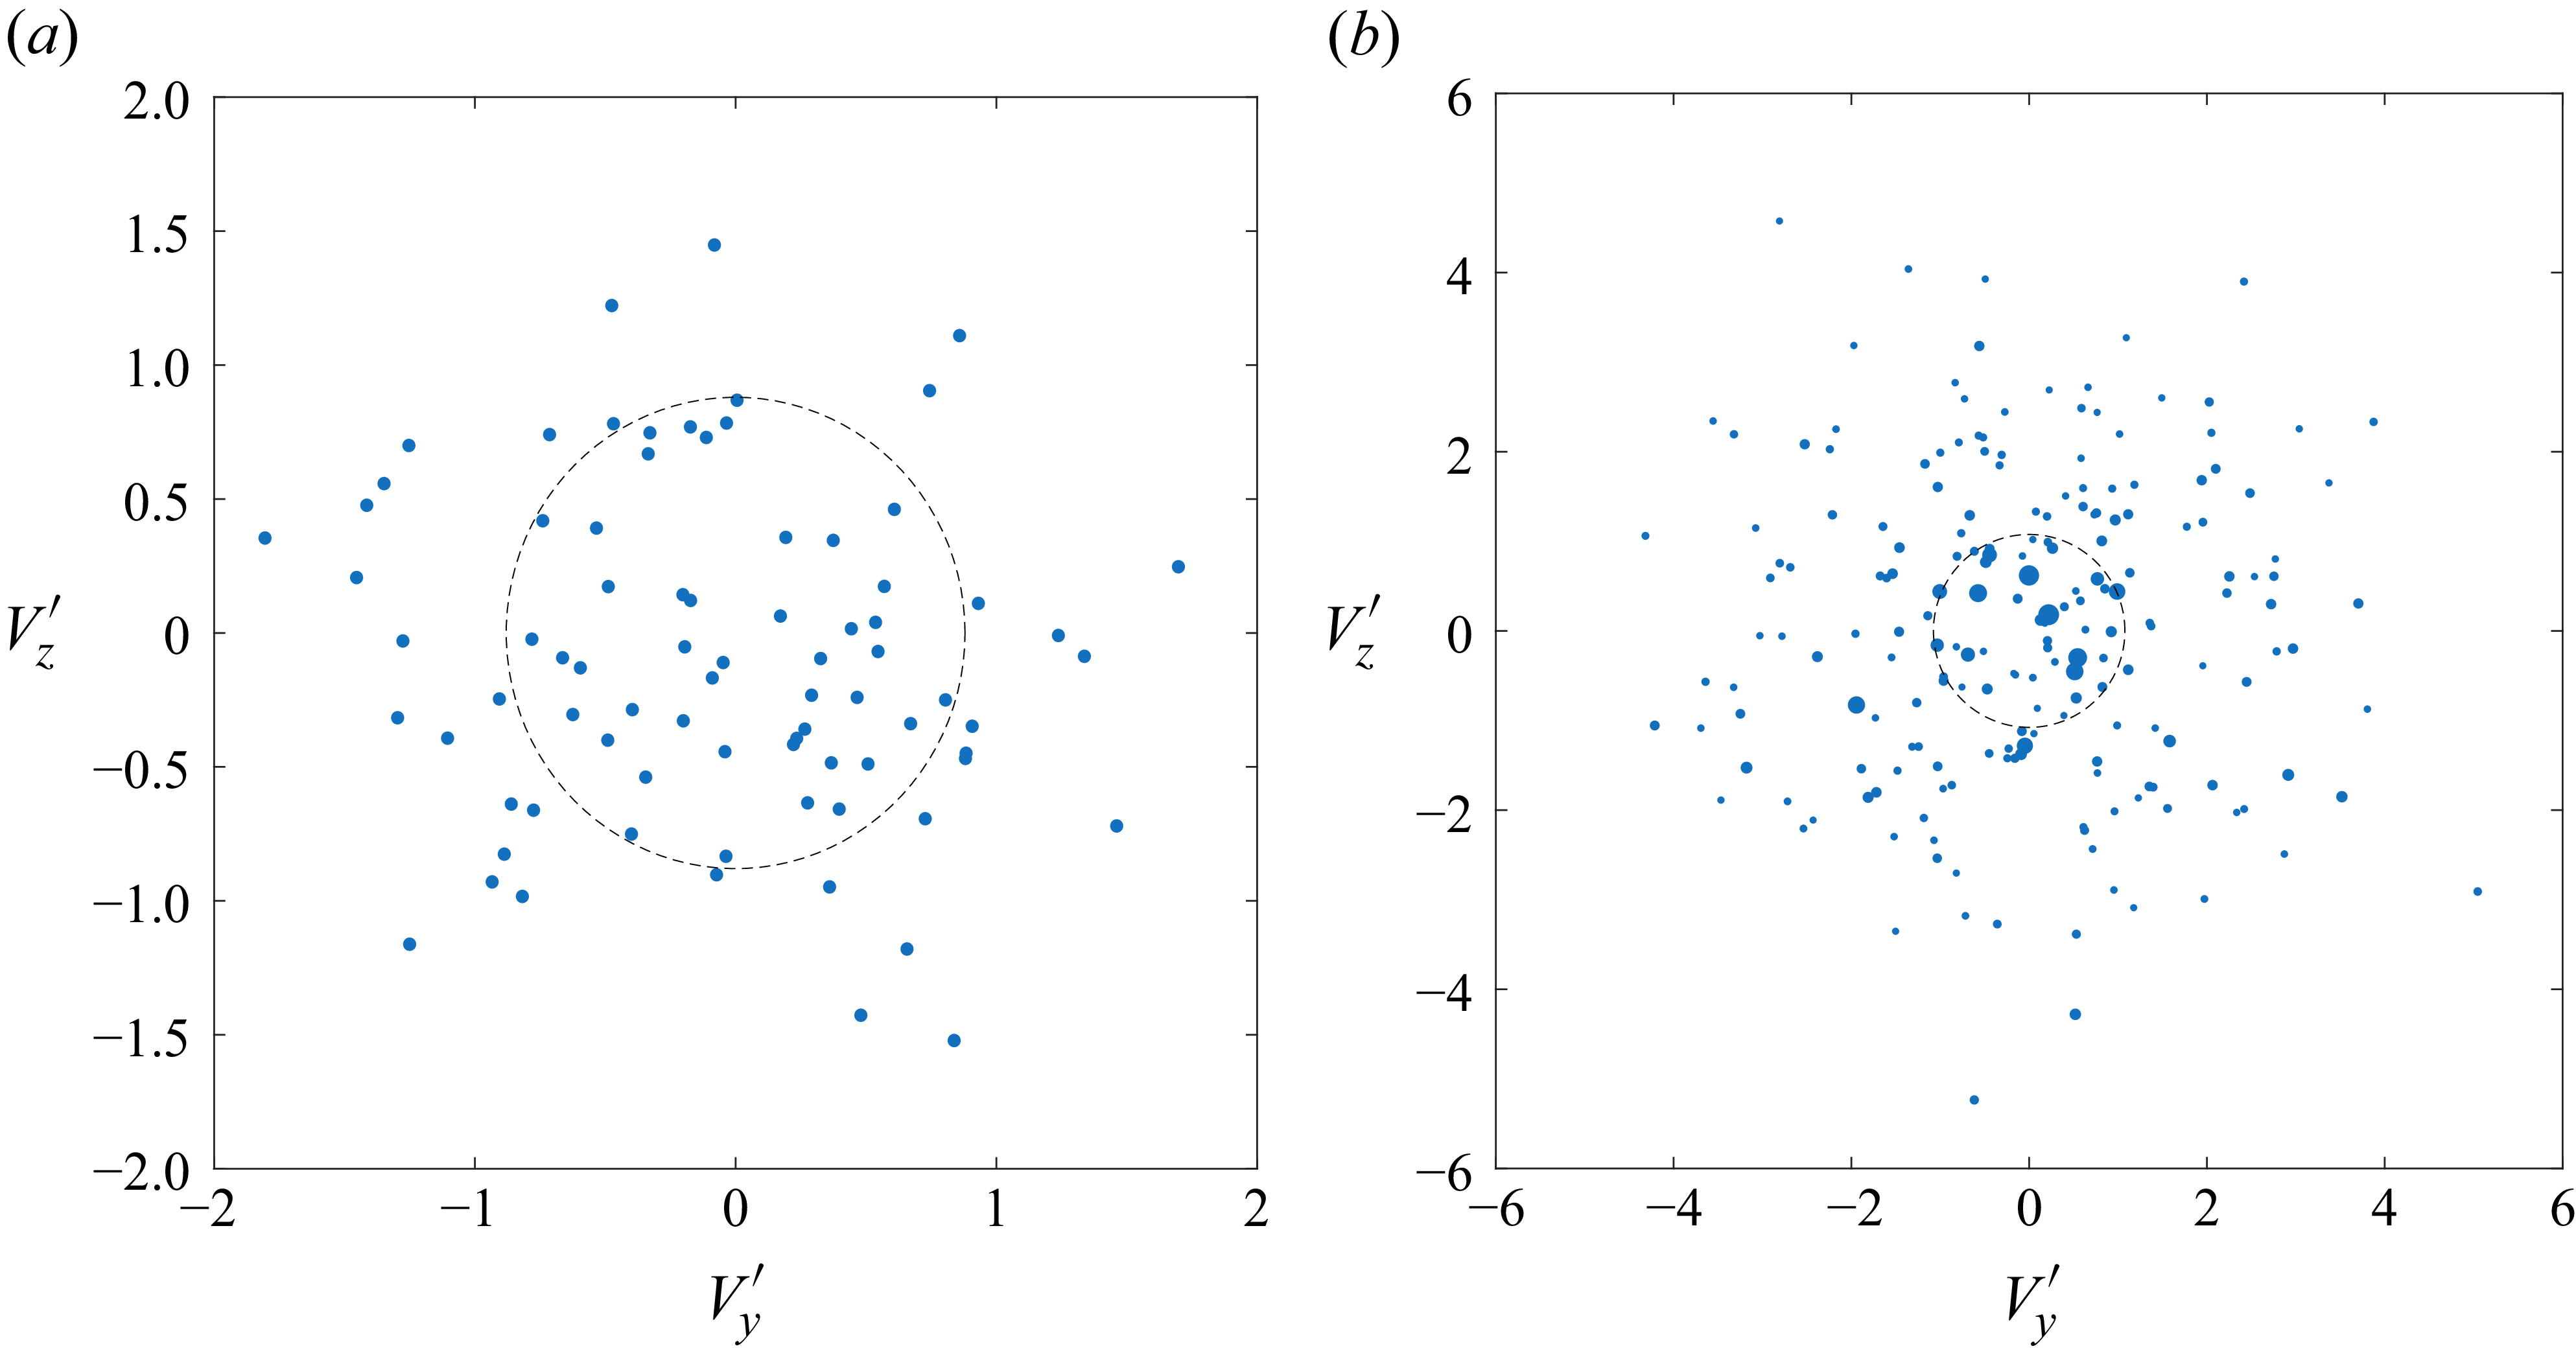
 N=80
 α=3
 N=200


 Open access

