I. INTRODUCTION
Radar applications in the S-band are more and more confronted with the trade-off between high power-added-efficiency (PAE), high output power, and wideband operation of power amplifiers. High efficiency classes of operation are well suited for maximizing PAE [Reference Cripps1–Reference Raab3] and gallium–nitride (GaN) high electron mobility transistors (HEMT) have already demonstrated high power performances. However, a high-efficiency operation is usually restricted to narrow bandwidths, even if recent studies have explored new approaches to propose a trade-off between PAE and bandwidth, as demonstrated by the class J [Reference Cripps1, Reference Wright, Lees, Benedikt, Tasker and Cripps4] and the continuous class F [Reference Carruba, Lees, Benedikt, Tasker and Cripps5].
Although microwave and millimeter-wave integrated circuit (MMIC) amplifiers have already demonstrated high PAE up to 20% of relative bandwidth, packaging is still a critical issue for reaching high-efficiency performances on wide bandwidths. For example, hybrid power amplifiers are generally optimized by designing the matching networks outside the package so that optimum harmonic impedances cannot generally be reached due to the cut-off frequency of the package. A recent study [Reference Chéron6] has demonstrated that the package limits the capability of harmonic impedance matching and can lead to a great degradation of PAE. In addition, whatever the external circuits, their wideband matching capabilities can also be limited at fundamental frequencies by package elements.
To overcome these drawbacks of packaged transistors for wideband PAE performances, the investigated solutions aim to take advantage of the intrinsic constitutive elements of a package in order to implement all wideband harmonic matching circuits inside the package. Indeed, a LC low-pass filter is built by the two main constitutive elements of a package that are the inductance L of bond wire connections and the capacitance C of package access. As it will be illustrated in Section II, this low-pass filter can be efficiently dimensioned so as to implement the internal matching at second harmonic frequencies for reaching high PAE performances over more than 20% of relative bandwidth in the S-band. This low-pass filter can also be adjusted so that the packaged device is always matched at second harmonic frequencies, whatever the harmonic loads presented outside the package.
Section II describes the principle of internal second harmonic matching and demonstrates its application to a 20 W packaged GaN HEMT unit cell in the S-band.
However, the high power levels required by radar applications have led us to design a packaged GaN power bar, which is not only internally-matched at second harmonic frequencies but also at fundamental frequencies for reaching wideband high-efficiency and high-power performances in 50 Ω environment. The packaged GaN power bar has been designed in the 2.5–3.1 GHz band with the objective to completely desensitize the packaged device to external load variations at harmonics. These results are described in Section III.
II. PRINCIPLE OF HARMONIC CONTROL IN PACKAGE
A) Influence of package elements on harmonic control
The die packaging generates many undesirable effects such as coupling capacitances or mutual inductances. Moreover, bond wires and metalized ceramic access can generate irreversible negative impacts on harmonic matching. For all reported designs of packaged GaN devices, complete lumped-element circuit models of the different packages were developed and validated [Reference Liang, Plá, Aaen and Mahalingam7, Reference Chéron8] in the S-band up to the second harmonic bandwidth.
In this section, so as to illustrate the impact of package elements, the simplest model of the package output is considered by using a single bond wire connecting the drain pad of the active die to the metalized ceramic pad of the package. Ideally, if parasitic effects and losses are neglected, the output of the package can be modeled by a LC low-pass filter composed of the equivalent inductance L of the bond wire and capacitance C of the metalized ceramic pad.
This section aims to highlight the impact of this low-pass filter on the output matching at second harmonic frequencies. A good visual representation of this impact is to perform a load-pull (LP) of the external package load at harmonic frequencies, and to visualize the transformed impedances at the drain plane of the intrinsic active die.
First, the impact of the capacitance C is illustrated in Fig. 1, which presents two examples of Smith chart transformation from the output plane of the package toward the drain plane of the transistor in the case of 0.6 pF (case 1) and 2 pF (case 2) package capacitances. In both cases, the bond wire inductance connecting the device is set to 1 nH and the LP is performed at 6 GHz, which is a representative example of second harmonic frequency in the S-band.
Impedance transformation from the output plane of the package toward the drain plane of the device in the case of 0.6 pF (case 1) and 2 pF (case 2) package capacitance at 6 GHz.

In the first case of 0.6 pF capacitance, it can be observed in Fig. 1 that the low-pass filter transforms the Smith chart in a reduced impedance region at the drain plane so that it appears as a small impedance region where it will be difficult to synthesize impedances, whatever the external loads presented outside the package. The LP is performed for a maximum reflection coefficient of magnitude 0.9.
In the second case, the capacitance C is increased up to 2 pF, which is a likely value in the case of active devices with a total gate width higher than 10 mm. Figure 1 shows that transformed impedances at the drain plane are now confined to a very small region of the Smith chart, which leads to a very large impedance region where it will be impossible to synthesize impedances, whatever the external loads presented outside the package.
Hence, the capacitance C of the metalized ceramic pad can be dimensioned to confine the impedances seen by the active die at second harmonic frequencies to their high PAE regions so as to desensitize the package to external harmonic load variations. However, the confined impedance region at second harmonic frequencies should correspond to the optimum one; otherwise it can lead to a great degradation of PAE. Most of the time, power bar packaging is designed to perform the best pre-matching at fundamental frequencies, but a bad location of second harmonic impedances can have a dramatic impact on PAE performances. This critical issue was highlighted in [Reference Chéron6] where a PAE degradation of 17 points was demonstrated whatever the external harmonic tuning, because almost all transformed impedances at second harmonic frequencies were confined by the package elements to low PAE regions.
Therefore, the investigated solutions in this paper consider at first to implement the secondharmonic matching inside the package through the low-pass LC filter with the objective to ease the matching capability at fundamental frequencies. The trade-off is to synthesize a high capacitance value to impose the required confinement of second harmonic impedances at the drain plane, but not too high so as to not restrict the fundamental matching capability.
Secondly, Fig. 2 illustrates the impact of the inductance L by two examples of Smith chart transformation in the case of 1.6 nH (case 3) and 2.9 nH (case 4) bond-wire inductance.
Impedance transformation from the output plane of the package toward the drain plane of the device in the case of 1.6 nH (case 3) and 2.9 nH (case 4) bond wire inductance at 6 GHz.

In both cases, the package capacitance is 2 pF in order to ensure a high impedance transformation ratio. As shown in Fig. 2, the inductance value allows adjusting in phase the transformed impedances. When the inductance value is increased, the confined region of impedances at the drain plane is rotated clockwise. Therefore, the bond wire inductance of the low-pass filter will be dimensioned so as to adjust the confined impedance region at second harmonic frequencies into the required high-PAE region at the drain plane, whatever the impedances presented outside the package. Actually, to reach the best trade-off between second harmonic and fundamental matching, the regions of transformed impedance are also checked at fundamental frequencies so that to not limit the matching capabilities at fundamental frequencies according to their optimum PAE regions.
B) Application to a 20 W packaged GaN HEMT
This method was applied to a 2.4 mm AlGaN/GaN HEMT device from United Monolithic Semiconductors (UMS). A nonlinear electro-thermal model [Reference Jardel9] of the intrinsic active die was extracted from on-wafer pulsed IV and pulsed RF characterizations and nonlinear simulations at fundamental and second harmonic frequencies were performed to determine the optimum PAE regions.
In order to illustrate the preceding design principle, a simple package architecture was designed using a single bond wire Ld to connect the drain of the GaN die to the package output so that a low-pass filter Ld-C 1 appears directly in the equivalent output model of the package. Figures 3(a) and 3(b) show a photograph of the package architecture and its simplified electrical model, respectively. A Metal-Insulator-Metal (MIM) capacitor C 3 is added at the gate side to improve the input pre-matching at fundamental frequencies. Two bond wires Lg 2 and Lg 1 connect the capacitor C 3 to the package input and to the gate, respectively.
Photograph of the package architecture (a) and its simplified electrical model (b).

The input and output metal-ceramic pads were made of a metallic plate of Alloy-42 on a 0.5 mm thick alumina substrate. Given the substrate thickness and its dielectric constant of 9.6, the surface area of the metallic plate was optimized (6.3 mm wide, 1.5 mm long) to synthesize the required value of 2 pF for the package capacitance C 1. Each bond wire is represented by an equivalent inductance (Lg 1, Lg 2, and Ld). For design considerations, a complete equivalent model of the package was derived [Reference Chéron8] considering all mutual inductances between bond wires, input/output coupling capacitances, and losses. However, a simplified electrical modeling is advantageous as it allows the main electrical parameters (Lg 1, Lg 2, Ld, and C 1) to be associated with the physical dimensions of bond wires and metal-ceramic pads.
First, the electrical elements of the output low-pass filter Ld-C 1 are optimized to synthesize the required impedances at the drain plane at fundamental and second harmonic frequencies. Figure 4 presents the synthesized impedances at the drain plane from 2.5 to 3.5 GHz and from 5 to 7 GHz in the case of a 50 Ω termination. The package capacitance C 1 is 2 pF, while two different values of 1.6 nH and 2.9 nH were chosen for the inductance Ld to highlight its impact on the synthesized impedances at the drain plane. In the first case of package configuration using Ld of 1.6 nH (red line in Fig. 4), the synthesized impedances at second harmonic frequencies are close to the optimum PAE impedances from 6 to 7 GHz. However, the synthesized impedances at fundamental frequencies are very far from their optimal values. As a result, the fundamental matching network must be considered outside the package.
Synthesized impedances at the drain plane in the case of 1.6 nH (red dot line) and 2.9 nH (solid blue line) drain inductance Ld.

This first package configuration was realized and reported in [Reference Chéron6] demonstrating that second harmonic load impedances were totally controlled from 2.9 to 4.0 GHz. An optimization of the fundamental load impedance outside the package has demonstrated 72% of PAE without external second harmonic tuning. However, the optimal external load impedances measured at fundamental frequencies presented a high magnitude of reflection coefficient.
In order to improve the trade-off between second harmonic matching and pre-matching at fundamental frequencies, the second package configuration reported in this paper was realized using a higher value of Ld equal to 2.9 nH. In this case, it can be observed in Fig. 4 (blue line) that a better pre-matching is ensured at fundamental frequencies, and the synthesized impedances at second harmonic frequencies are close to the optimum regions from 5 to 6 GHz. This second package configuration was realized and its power measurements are reported in the next section.
C) Power measurements of the 20 W packaged GaN HEMT
A 50 Ω test fixture was designed to measure the packaged GaN HEMT. The RF input power was pulsed using a 10 µs pulse width at a 10% duty cycle, while bias voltages were continuous. The gate was biased slightly above pinch-off and the drain bias voltage was 50 V. De-embedded measurements at the package planes were obtained by using a Thru-Reflect-Line (TRL) calibration. Large signal measurements were made by using a PNA-X and a Large Signal Network Analyzer (LSNA) associated with a specific method of pulse measurements [Reference Reveyrand and Popovic10]. Two different measurement steps were performed.
In the first step, a LP was performed at fundamental frequencies for maximum PAE, while fixed second harmonic impedances of 50 Ω were imposed at the package output. The results of these first measurements are shown in Fig. 5 (blue diamonds) from 2.5 to 3.5 GHz. In order to highlight the impact of second harmonic control inside the package, the results of the packaged device in 50 Ω environment at second harmonic frequencies (blue diamonds) are compared with on-wafer measurements of the 2.4 mm GaN die (red squares) when its load impedance is optimized at fundamental frequencies and equal to 50 Ω at second harmonic frequencies. This first comparison underlines the great impact of packaging on synthesized harmonic impedances at the drain plane. At 2.5 GHz, in the same measurement conditions, the optimized packaged device provides 78% of PAE, i.e. 10 points better than on-wafer performances because of the internal second harmonic matching performed by Ld-C 1. Above 2.5 GHz, the internal matching network at second harmonic frequencies generates PAE improvements up to 3.2 GHz which become insignificant above 3.2 GHz.
Comparison of PAE performances between the packaged GaN HEMT and the GaN HEMT die (on-wafer measurements) when a LP is performed at fundamental and second harmonic frequencies.

In the second step, the fundamental impedance was set to its optimal value for maximum PAE, while a LP was performed at second harmonic frequencies for a reflection coefficient limited to a maximum magnitude of 0.8 due to the tuner capability. Figure 5 shows a comparison between on-wafer measurements of the 2.4 mm GaN die (red area) and measurements of the packaged device (blue area) from 2.5 to 3.5 GHz. Under such LP conditions at second harmonic frequencies, the maximum variation of measured PAE for the packaged device (blue area) is less than 5 points (73–78%) at 2.5 GHz and only 2 points at 3.2 GHz. Conversely, on-wafer measurements (red area) show that PAE variations of the GaN die are always higher than 15 points.
In such a large relative bandwidth of 33% from 2.5 to 3.5 GHz, these comparisons between the active die and its optimized packaged version demonstrate the capability of implementing an efficient second harmonic control inside the package over large relative bandwidths higher than 20%. They also highlight that a good choice of the LC low-pass filter ensures almost all transformed impedances to be confined to high-efficiency regions, whatever the impedances presented outside the package at second harmonic frequencies. Therefore, the optimized packaged device is desensitized to external load variations at second harmonic frequencies.
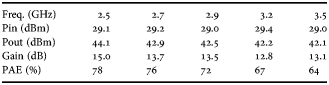
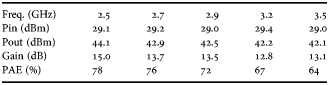
Table 1 summarizes measured power performances of the optimized packaged GaN HEMT from 2.5 to 3.5 GHz. The best measured performances were obtained at 2.5 GHz with 78% PAE, 25 W output power, and 15 dB power gain. From 2.7 to 3.5 GHz, PAE and output powers range from 64 to 76% and 17 to 20 W, respectively.
Measured performances of the 2.4 mm packaged GaN HEMT
III. DESIGN OF A 50 W INTERNALLY-MATCHED PACKAGED GAN POWER BAR
A) Design method and circuit schematic
We used a device from the released AlGaN/GaN GH50-10 process provided by UMS. This technology has been qualified up to an operating drain voltage of 50 V. The GaN HEMT power bar has a total gate periphery of 14.4 mm composed of six unit cells of 2.4 mm gate width. It should be noted that the GaN technology used in this section is different from the preceding technology used in Section II.
Our objective is to apply the previous design method based on the low-pass filter to internally control second harmonic impedances in the particular case of multiple unit cells constituting the power bar. Moreover, other filters will be added inside the package to ease the fundamental matching. The package is optimized to ensure a good matching at the fundamental frequencies from 2.5 to 3.1 GHz and to desensitize the die to external impedance variations at second harmonic frequencies.
Initially, nonlinear simulations of a single unit cell were performed to define its optimum source and load impedance regions at fundamental and second harmonic frequencies for maximum PAE. By using these impedance contours, internal matching circuits of the GaN power bar were designed so that each unit cell of the power bar can be matched to its optimum source and load region at fundamental and second harmonic frequencies.
Figure 6 shows a circuit schematic of the packaged power bar where Z S and Z L denote the external loads.
Equivalent circuit model of the packaged GaN power bar.

Firstly, the drain side of the packaged power bar is desensitized to external second harmonic loads by the second-order low-pass filter L 0-C 0-L 1-C 1, which is optimized to confine the second harmonic load impedances of each unit cell to their high-PAE regions whatever the impedances presented outside the package. Then, the L 2-C 2 circuit is inserted and optimized to have a negligible impact on the second harmonic matching, and to ease the matching at fundamental frequencies when associated with the L 0-C 0-L 1-C 1 filter with a fixed Z L of 50 Ω.
Secondly, the gate side is internally matched at fundamental frequencies by a second-order low-pass filter (L 3-C 3 and L 4-C 4) in the case of a fixed Z S of 50 Ω. Finally, the L 5-C 5 circuit is added in order to control the second harmonic source impedances. In this case, the L 5-C 5 filter is optimized only to ensure a control of second harmonic source impedances in safe efficiency regions from 2.5 to 3.1 GHz. Without the implementation of this circuit, second harmonic source impedances would have been confined to low-efficiency regions. Therefore, the filter properties allow second harmonic source impedances of each GaN die to be confined to safe PAE regions, whatever the impedances presented outside the package (i.e. Z S at 2f 0 is swept over the entire Smith chart). However, this method of second harmonic source control has already demonstrated significant PAE improvements on wide bandwidth in the S-band, while optimal efficiency areas were reached [Reference Chéron11].
Figure 7 shows a photograph of the fabricated packaged power bar with the circuit schematic presenting the actual implementation of ideal circuit elements.
Photograph and schematic of the first packaged GaN power bar.

The ideal capacitances C 1 and C 3 are actually synthesized by shaping the widths of the metalized Duroïd substrate at the output and input of the package, respectively. Indeed, substrate thickness and surface area of metal plates determine the package capacitances. The other capacitances C 0, C 2, C 4, and C 5 are synthesized by MIM capacitors. All inductances are realized by bond wires for which the length, diameter, and shape were optimized to have the required inductance values. Moreover, it is important to note that all mutual inductances were considered during simulations since they have a great impact on synthesized impedances, especially at second harmonic frequencies. Large signal characterizations of this packaged GaN power bar are presented in the next section.
B) Power measurements of the packaged GaN power bar
A 50 Ω test fixture was designed to measure packaged power bars. The RF input power was pulsed using a 10 µs pulse width at a 10% duty cycle with continuous bias voltages. The gate was biased slightly above pinch-off and the drain bias voltage was 40 V. De-embedded measurements at the package planes were obtained by using TRL calibration.
The three separate measurement steps that were performed on packaged power bars are detailed in the next few paragraphs.
1) POWER MEASUREMENTS IN 50 Ω ENVIRONMENT
Firstly, the packaged power bar was measured in 50 Ω source and load environments. Figure 8 shows measured performances of output power, power gain, and PAE from 2.5 to 3.1 GHz. In 50 Ω environment the packaged GaN power bar demonstrated 56–58% PAE associated with 35 W output power and 11.8 dB gain in a relative bandwidth of 21%. These performances are measured at a constant available input power of 33 dBm. Even in 50 Ω environment this packaged power bar provides wideband power and PAE performances.
Measured power performances from 2.5 to 3.1 GHz of the packaged GaN power bar in 50 Ω environment at Vds = 40 V.

2) SOURCE-PULL AND LP MEASUREMENTS
Secondly, the external terminations were still 50 Ω at second harmonic frequencies, while source-pull and LP measurements were performed at fundamental frequencies so as to determine the optimum source and load conditions for minimum return losses and maximum PAE, respectively. In this case, Fig. 9 shows measured performances from 2.5 to 3.3 GHz at a constant available input power of 32.5 dBm.
Power measurements of the packaged power bar with optimal loads (ZS-OPT, ZL-OPT) @ f 0 and 50 Ω @ 2f 0. The blue curve denotes the worst value of measured PAE when Z L is swept @ 2f 0 over the entire Smith chart.

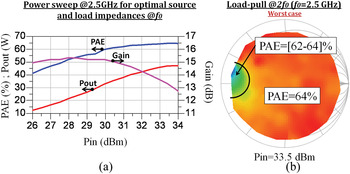
From 2.5 to 3.1 GHz, the packaged power bar delivered 58–64% of PAE associated with output powers higher than 40 W and power gains higher than 13.4 dB. At 2.5 GHz, 64% peak PAE was measured with 44 W output power and 14 dB power gain as shown in Fig. 11(a).
The measured optimal external source and load impedances at the fundamental frequencies are shown in Fig. 10 and denote a good matching at the output from 2.5 to 3.1 GHz.
Loci of optimum source (a) and load (b) impedances @ f 0 for the packaged power bar when Z L = 50 Ω @ 2f 0.

Power measurements of the packaged power bar at 2.5 GHz with optimal loads (ZS-OPT, ZL-OPT) @ f 0 and 50 Ω @ 2f 0 (a). PAE variations of the packaged power bar at 2.5 GHz (b) when Z L is swept @ 2f 0 over the entire Smith chart.
3) INSENSITIVITY TO EXTERNAL LOAD VARIATIONS AT HARMONIC FREQUENCIES:
Thirdly, in order to assess the insensitivity of the packaged GaN power bar to external load variations at second harmonic frequencies, the third characterization step consisted in sweeping Z L all over the entire Smith chart at 2f 0, while Z L was set to its optimum value at f 0. Under these worst-case conditions of harmonic loading, the blue curve of Fig. 9 shows the worst values of measured PAE from 2.5 to 3.3 GHz, demonstrating that the worst-case variation of PAE remains lower than 2 points at 2.5 GHz and lower than 1 point above 2.7 GHz. At the frequency of 2.5 GHz where the maximum variation of PAE is observed, Fig. 11(b) shows the impedance sweep performed at 2f 0 with its corresponding level of measured PAE. It can be observed that the worst-case impedances at 2f 0 are located in a very small area of the Smith chart, so that this area can be easily avoided by the external matching circuit.
These measurements show that the internal output-matching network of the package properly confines the transformed impedances to 2f 0 at the drain plane, whatever the harmonic loads presented outside the package.
IV. COMPARISON WITH STATE-OF-THE-ART POWER AMPLIFIERS
In Fig. 12, the measured power and PAE performances in 50 Ω environment of both internally-matched packaged GaN power bars are compared with performances of other published power amplifiers. In order to limit references and to focus on similar criteria, only power amplifiers providing more than 45% of PAE, output powers higher than 10 W and relative bandwidths higher than 10% were selected in the literature. Moreover, each power amplifier presents a center frequency between 2.5 and 4.0 GHz.
Comparison with state-of-the-art power amplifiers considering PAE higher than 45%, output powers higher than 10 W, relative bandwidths higher than 10%, and a center frequency between 2.5 and 4.0 GHz [12–19].

V. CONCLUSION
The reported method of wideband package design dedicated to high-power GaN HEMT power bar demonstrates the capability to reach high PAE over wide bandwidths in the S-band.
This method is based on the control inside the package of second harmonic load impedances presented to the active die by using the constitutive elements of every package access which constitutes a LC low-pass filter. This low-pass filter can be synthesized so that the packaged device is completely desensitized to external harmonic load variations. This method was applied to a 2.4 mm GaN HEMT unit cell and a 14.4 mm GaN HEMT power bar. Two internally-matched packaged power bars were fabricated with not only second harmonic control but also fundamental matching networks inside the package.
The packaged power bar provided more than 56% of PAE from 2.5 GHz to 3.1 GHz with less than 2 points of PAE variation when an LP was performed at second harmonic frequencies. Hence, this design method demonstrated that load impedances of the power bar at second harmonic frequencies can be confined to high-PAE regions whatever the loads outside the package. Finally, the packaged power bar is desensitized to external load variations at second harmonic frequencies.
ACKNOWLEDGEMENTS
The authors thank the French Defense Agency (DGA) for their financial support.
 Jérôme Chéron was born in Guéret, France, in 1984. He received the Ph.D. degree in microwave communication engineering from the University of Limoges, Limoges, France, in 2011. He is currently a Postdoctoral Fellow with the Fraunhofer IAF, Freiburg, Germany, in partnership with XLIM laboratory, Limoges, France. His research interests include design and optimization of microwave power amplifiers.
 Michel Campovecchio received the M.S. and Ph.D degrees in electrical engineering from the Technical University of Limoges, France, in 1989 and 1993, respectively. In 1994, he joined the XLIM Institute (formerly IRCOM) of the Centre National de la Recherche Scientifique (CNRS) to investigate the nonlinear modeling of high-power microwave transistors and the design of wideband power amplifiers. In 2000, he became Full Professor of electrical engineering at the University of Limoges in charge of the power amplifier group at XLIM Institute. His current research interests include wideband high-efficiency and high-power amplifiers in III-V and III-N technologies for radar and space applications.
 Denis Barataud was born in Saint-Junien, France, in 1970. He received the Engineer's degree from the Ecole Nationale Supérieure de Télécommunications de Bretagne, Bretagne, France, in 1994, and the Ph.D. Degree in electronics from the University of Limoges, Limoges, France, in 1998. From 1998 to 1999, he was a Postdoctoral Scientist with the Microwave Laboratory, CNES, Toulouse, France. Since 2000, he has been with the XLIM (formerly IRCOM) Laboratory, University of Limoges, where in 2001 he became an Assistant Professor. His research interests include the development of a time-domain equipment and techniques for the characterization of nonlinear devices.
 Tibault Reveyrand received the Ph.D. degree from the University of Limoges, France, in 2002. From 2002 to 2004, he was a Postdoctoral Scientist with CNES (French Space Agency). In 2005, he became a CNRS engineer at XLIM (formerly IRCOM). His research interests include characterization, modeling, and simulation of RF and microwave nonlinear components and devices.
 Michel Stanislawiak received the Ph.D. degree in Electronics from the University of Lille in 1998. In 1998, he joined Thales. He was in charge of hybrid circuits design for T/R modules as power switches, high power amplifiers solid state, low noise amplifiers, and high power limiter until 2008. He is now in charge of the new microwave developments including microwave components, circuits, and technology for phased-array antenna radar program.
 Philippe Eudeline was born in Honfleur (France), on January 13, 1956. He graduated from the Engineering School ENSEA. He started his carrier in May 1978 with Thomson-CSF Microwave Links Division as a Microwave Engineer involved in the development and then in the manufacturing of solid-state transmitters and local oscillators. In 1988, he moved to the Radar division of Thomson-CSF to start the move from TWT transmitter to solid-state transmitter. He built a specific team of 75 engineers and technicians devoted to high power solid-state transmitter design. Since 2000, he is Technical Director of a French–Dutch department within Thales Air Systems Company. He is in charge of the research and development of advanced technologies for microwave equipments. His main background is solid-state development. He developed SSPA for air traffic control radars and high power T/R modules for air defense radars.
 Didier Floriot was born in France 1967. He graduated in Electrical Engineering from Supelec in 1992. He received the M.S. and Ph.D. degrees from the University of Paris VI in 1993 and 1995, respectively. He joined the Thales Research Center and worked on the development of the power InGaP/GaAs HBT technology for radar applications and on the integration of this technology inside demonstrators. From 2000 to 2007, he was a team leader at Alcatel Thales III-V Lab, a joint research group on III-V opto-microwave devices and power semiconductors. His fields of interest cover modeling, characterization, and design of power devices including III-V and III-N semiconductors. He joined UMS (United Monolithic Semiconductors) in 2007 managing technological and product co-operations, especially on GaN technologies and acting as a reliability quality expert. He is now in charge of the Technology Support Group at UMS.