


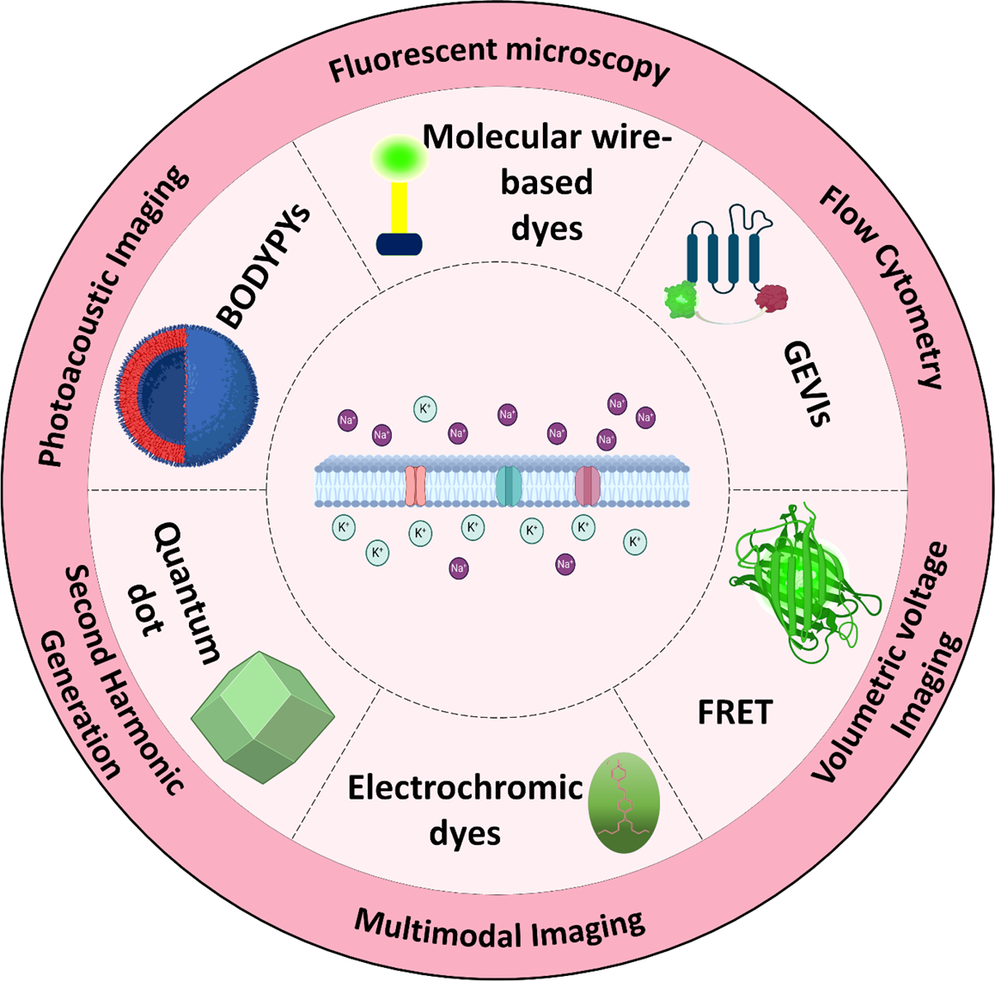
Introduction
The distribution of charges inside and outside the cell creates the resting membrane potential (RMP), which can be measured using various techniques. The methods for measuring RMP are categorized into optical and nonoptical approaches (Figure 1) (Khadria Reference Khadria2022) and among nonoptical techniques, patch-clamp methods are the gold standard for assessing membrane potential and studying ion channel electrophysiology (Ansaryan et al., Reference Ansaryan, Khayamian, Saghafi, Shalileh, Nikshoar, Abbasvandi, Mahmoudi, Bahrami and Abdolahad2019; Kramer et al., Reference Kramer, Miller, Abdelfattah and Baker2022; Shalileh et al., Reference Shalileh, Khayamian, Ghaderinia, Abadijoo, Hassanzadeh-Moghadam, Dalman, Simaee, Faramarzpour, Ghaznavi, Soltan Khamsi, Abbasvandi, Faranoush, Anbiaei, Eftekhari-Yazdi and Abdolahad2021). Conversely, nonoptical techniques or voltage-sensitive dyes (VSD) have emerged as powerful alternatives to traditional patch-clamp techniques for measuring RMP. They offer advantages like noninvasiveness, real-time electrical activity measurement, and suitability for high-throughput screening (Yu et al., Reference Yu, Wang and Nie2021; Zhou et al., Reference Zhou, Liu, Muller and Cui2021). Voltage indicators such as optical dyes detect electrical events by converting changes in electric field strength into fluorescence or UV absorbance (Clarke Reference Clarke2010). Their response mechanisms, which depend on the dye’s molecular structure, involve either the movement of the dye molecules within the membrane or the movement of the dye’s electrons. These dyes measure membrane potentials and monitor ion pump activity, such as Na+/K+-ATPase (Clarke Reference Clarke2010). Optical voltage indicators, in particular, provide high spatial and temporal resolution for visualizing membrane potential changes in living cells, facilitating detailed and dynamic studies of cellular function (Yu et al., Reference Yu, Wang and Nie2021). This is essential for applications in neuroscience, cardiology, and drug discovery (Entcheva and Kay Reference Entcheva and Kay2021; Knöpfel and Song Reference Knöpfel and Song2019; Müllenbroich et al., Reference Müllenbroich, Kelly, Acker, Bub, Bruegmann, Di Bona, Entcheva, Ferrantini, Kohl and Lehnart2021).
Membrane potential measurement including optical and nonoptical methods. Optical classification features dyes and measurement techniques.

This review explores recent advancements in novel voltage indicators for measuring RMP and dynamic membrane potential fluctuations, such as depolarization and hyperpolarization. We begin with a concise overview of the fundamental physics and biology underlying membrane potentials, including RMP. This is followed by an in-depth discussion of voltage indicators, categorized into slow and fast dyes, along with specific examples such as electrochromic dyes, fluorescence resonance energy transfer (FRET)-based dyes, molecular wire-based dyes, BODIPY fluorophores, quantum dots (QDs), and genetically encoded voltage indicators (GEVIs). The review also examines a range of imaging techniques for visualizing membrane potential, including fluorescence microscopy, flow cytometry, volumetric voltage imaging, multimodal imaging, photoacoustic imaging (PAI), second harmonic generation (SHG), and two-photon microscopy (2 PM). Additionally, we explore various calibration strategies, such as ionophore-based methods and the calibration of charged organic dyes, while discussing factors affecting accuracy and precision. Finally, we highlight recent developments in this field, focusing on improvements in sensitivity, specificity, and practical applications, with an emphasis on their potential to revolutionize cellular electrophysiology and neuroscience research.
RMP: from physics to biology
Basic concept and physics
The cell is enclosed by a lipid-based membrane, effectively separating it from its external environment (Carvalho et al., Reference Carvalho, Makowski, Domingues, Martins and Santos2021). Unlike nonpolar molecules, charged molecules such as ions encounter a barrier when attempting to traverse this membrane, resulting in their accumulation on either side of the membrane. This charge segregation creates a voltage disparity known as the RMP (Kaushik et al., Reference Kaushik, He and Dalbey2022).
The measurement of membrane potential is typically relative, comparing the potential inside the cell to that outside (Figure 2). This yields an average RMP of approximately −70 millivolts (mV), although variations exist among different cell types (Klejchova et al., Reference Klejchova, Silva-Alvim, Blatt and Alvim2021; Kramer et al., Reference Kramer, Miller, Abdelfattah and Baker2022). A negative value signifies that the intracellular side of the membrane is negatively charged relative to the extracellular side, indicating a surplus of negatively charged ions inside the cell. This polarity follows the convention that positively charged particles tend to migrate towards regions of lower potential and in the direction of the electric field (Coster Reference Coster2003; Khitrin et al., Reference Khitrin, Khitrin and Model2014; Wright Reference Wright2004).
(a) Schematic structure of the membrane and the ion distribution across it, (b) modeling of channel resistance and membrane capacitance.

(a) Shows K+ ion balance and equilibrium potential at ~ − 102 mV. (b) Illustrates Na+ ion balance and equilibrium potential at ~ + 56 mV. (c) The combined effect of K+, Cl−, and Na+ channels in setting the RMP at ~ − 70 mV.

It is important to note that all cells, including non-excitable cells, possess an RMP. This intrinsic electrical state serves as an energy differential, akin to a battery, which facilitates numerous cellular signaling processes and cascades throughout the cell’s lifespan. Consequently, the RMP is indispensable for the proper functioning of various cellular activities, including but not limited to, neurotransmission, muscle contraction, and hormone secretion (Abdul Kadir et al., Reference Abdul Kadir, Stacey and Barrett-Jolley2018).
Membrane structure and its role in RMP
The structure of the cell membrane plays a critical role in establishing and maintaining the RMP. Composed of phospholipid bilayers, cholesterol, and proteins, the lipid bilayer forms a cohesive barrier enveloping the entire cell (de Lera Ruiz and Kraus Reference de Lera Ruiz and Kraus2015; Denac et al., Reference Denac, Mevissen and Scholtysik2000). This lipid barrier acts as an electrostatic shield, selectively permitting the diffusion of hydrophobic molecules while hindering the passage of hydrophilic particles such as ions. Ions like Na+, Cl−, and K+, with their specific charges, interact with water molecules, forming hydration shells that impede their movement across the membrane (Figure 2a ; Kuang et al., Reference Kuang, Purhonen and Hebert2015; Zifarelli and Pusch Reference Zifarelli and Pusch2007).
From an electronic perspective, the cell membrane functions akin to the dielectric compartment of a capacitor (Demarche et al., Reference Demarche, Sugihara, Zambelli, Tiefenauer and Vörös2011; Dorta et al., Reference Dorta, Plazaola, Carrasco, Alves-Rosa, Coronado, Correa, Zambrano, Gutiérrez-Medina, Sarmiento-Gómez and Spadafora2024). Charged ions are segregated and collected on both sides of the membrane, creating a potential difference (Figure 2b . This potential difference, often referred to as the RMP, is influenced by the cell’s specific capacitance, which is determined by factors such as its geometry, composition, and environmental conditions (Strathmann Reference Strathmann2004).
Despite the impermeability of the lipid bilayer to charged ions, the cell requires the selective transportation of ions across the membrane (Kowacz and Pollack Reference Kowacz and Pollack2020; Langton Reference Langton2021). To facilitate this process, specialized channels and pumps are present in the membrane (Pei Reference Pei2022). These channels and pumps render the cell membrane semi-permeable, allowing certain molecules and ions to traverse it while restricting others. This permeability of the membrane to various ions differs significantly, impacting the establishment of the RMP (Zakany et al., Reference Zakany, Kovacs, Panyi and Varga2020). The uneven distribution of ions, coupled with their varying concentrations and permeabilities, contributes to the unique resting potential characteristic of each cell (Aguilar et al., Reference Aguilar, Ho, Chang, Carlson, Natarajan, Marciano, Bomzon and Patel2021; Kowacz and Pollack Reference Kowacz and Pollack2020; Pei Reference Pei2022).
Electrochemical gradient and equilibrium potential; Nernst and Goldman equations
The whole membrane potential is based on a duel between diffusion and electrostatic forces. The movement of ions is influenced by two primary forces: the chemical gradient and the electric gradient. Under ideal conditions, charged ions strive to equalize concentration and electrically neutralize the system (Roux et al., Reference Roux, Allen, Berneche and Im2004; Zhang et al., Reference Zhang, Keleshian and Sachs2001). This delicate interplay between diffusion and electrostatic forces dictates the movement of ions across the cell membrane, ultimately shaping the RMP. The chemical gradient, established by differences in ion concentrations across the membrane, drives ions from regions of high concentration to areas of lower concentration. Simultaneously, the electric gradient, determined by the charge separation across the membrane, exerts a force on ions, driving them towards regions of opposite charge. These opposing forces work in tandem, with ions moving along their respective gradients until a dynamic equilibrium is reached, where the electrical and chemical forces balance each other out. This equilibrium state defines the RMP of the cell, providing a stable electrical environment essential for cellular function (Hammond Reference Hammond2015; Pethig Reference Pethig1986).
Consider a scenario where a solution contains only potassium and chlorine ions (Figure 3a), and the membrane is permeable only to potassium. Now an electrochemical gradient is established in a way that the chemical gradient is at its maximum and the electrical gradient is at its minimum. As K+ ions move down their concentration gradient out of the cell through potassium channels, the interior of the cell becomes negatively charged relative to the outside, creating an electrical potential difference across the membrane. In this situation, the chemical gradient is reduced and the electrical gradient is increased. This electric potential difference opposes further movement of K+ ions, balancing the chemical force driving them out. The equilibrium potential, where the electrical and chemical forces are equal, is reached when the membrane potential matches the potassium equilibrium potential (Nernst potential; (Hammond Reference Hammond2015). However, in physiological conditions, where cells are permeable to multiple ions including sodium (Na+) and chloride (Cl−), the RMP is slightly less negative than the potassium equilibrium potential. This is because both Na+ (Figure 3b) and Cl− ions contribute to the membrane potential, with Na+ tending to pull the membrane potential toward positivity and Cl− toward negativity. The actual membrane potential lies between the equilibrium potentials of Na+ and K+, closer to the equilibrium potential of the potassium ion with higher permeability (Figure 3c; Dorta et al., Reference Dorta, Plazaola, Carrasco, Alves-Rosa, Coronado, Correa, Zambrano, Gutiérrez-Medina, Sarmiento-Gómez and Spadafora2024; Hammond Reference Hammond2015).
Nernst equation
The Nernst equation is used to calculate the equilibrium potential for a specific ion when there is no net current or concentration gradient across the membrane. Essentially, the Nernst equation provides a way to understand the relationship between the diffusion potential of ions into the membrane and the concentration gradient of those ions on both sides of the membrane. It helps describe the electrical potential that would counteract the tendency of the ion to move across the membrane due to its concentration gradient (Noori Reference Noori2011; Vidal-Iglesias et al., Reference Vidal-Iglesias, Solla-Gullón, Rodes, Herrero and Aldaz2012).
 $$ {V}_m=\pm \frac{\mathrm{RT}}{FZ}\ast \log \frac{{\left[C\right]}_{out}}{{\left[C\right]}_{in}} $$
Where
 $ {V}_m $
is the equilibrium potential of a specific ion in mV, R is the gas constant (8.314 J/(mol·K)), T is the absolute temperature in kelvin (K), Z is the valence of the ion, F is the Faraday constant (96,485 C/mol), [C]out is the concentration of the ion outside of the cell, [C]in is the concentration of the ion inside the cell. It is important to note that the potential outside the cell is assumed to be zero, making the potential inside the cell the focus of the equation. The sign of the equation is positive if the ion that diffuses from inside to outside is negative, and conversely, negative if the ion that diffuses from inside to outside is positive (Feiner and McEvoy Reference Feiner and McEvoy1994).
Goldman equation
Nernst’s equation provides the equilibrium potential for a specific ion, where the electrical and chemical gradients balance, resulting in no net force on the ions across the membrane. For instance, the equilibrium potential for potassium ions is typically around −102 mV. However, since the membrane is also permeable to ions such as chloride and sodium, albeit with varying permeabilities, the concentrations and permeabilities of these ions also impact the RMP (Ward et al., Reference Ward, Dickinson and Compton2010). To calculate the net potential considering the concentrations and permeabilities of multiple ions, the Goldman–Hodgkin–Katz (GHK) equation, also known as the Goldman equation is employed. This equation offers the RMP of a cell when the ions, their concentrations, and permeabilities are known, providing a more comprehensive understanding of the electrical state of the cell membrane (Lee Reference Lee2020).
 $$ {V}_m=\frac{RT}{F}\ln \left(\frac{P_K\hskip0.24em {\left[{K}^{+}\right]}_{out}+{P}_{Na}\hskip0.24em {\left[{Na}^{+}\right]}_{out}+{P}_{Cl}\hskip0.24em {\left[{Cl}^{-}\right]}_{in}}{P_K\hskip0.24em {\left[{K}^{+}\right]}_{in}+{P}_{Na}\hskip0.24em {\left[{Na}^{+}\right]}_{in}+{P}_{Cl}\hskip0.24em {\left[{Cl}^{-}\right]}_{out}}\right) $$
The unit of membrane potential (
 $ {V}_m $
) is in mV. In the Goldman equation, R, T, F, and P represent the universal gas constant, temperature (in Kelvin), Faraday’s constant, and the permeability of the membrane for ions, respectively.
Key points of the Goldman equation include the scenario where the membrane is impermeable to sodium and chloride (zero permeability), indicating that only potassium channels are open, making the cell-permeable to potassium. Under this condition, the potential derived from the Goldman equation is equal to that from the Nernst equation, and this principle applies to other ions as well (Lee Reference Lee2020; Model et al., Reference Model, Mahajana, Düsterwald and Dmitriev2023; Ward et al., Reference Ward, Dickinson and Compton2010).
Nonequilibrium state and the role of sodium/potassium pumps
The disparity between the membrane potential derived from the Goldman equation or experimental data and the equilibrium potential of each ion calculated from the Nernst equation indicates the electromotive force acting on each ion. The discrepancy between the membrane potential and the equilibrium potential of each ion demonstrates that, if left unchecked, this process would lead to a collapse of the ion concentration gradient across the cell membrane (Nguyen et al., Reference Nguyen, Deisl, Fine, Tippetts, Uchikawa, Bai and Levine2022). To counteract this, the sodium/potassium pump actively maintains and restores this concentration gradient to its initial state. Additionally, to establish and sustain the electrochemical gradient within the cell, sodium and potassium pumps, alongside potassium and chloride channels, operate continuously. While the sodium and potassium pumps actively transport ions, contributing to electrogenic pumping, potassium and chloride channels facilitate passive ion diffusion. The coordinated activity of these pumps and channels is essential for preserving the concentration and electric gradients of sodium and potassium ions during the resting potential, ensuring the cell’s proper functioning and viability (Adams and Levin Reference Adams and Levin2012a; Wright Reference Wright2004).
Direct visualization through VSD
The patch clamp techniques as the nonoptical techniques are extremely powerful for measuring the single-cell membrane potential but they are more invasive in comparison with the optical technique (Brown and Greenberg Reference Brown and Greenberg2016; Hill and Stephens Reference Hill and Stephens2021). Direct visualization or optical measuring of the membrane potential is introduced to evaluate the membrane potential of cells, either individually or simultaneously, in a noninvasive and secure manner. Optical measurements are invaluable, eliminating the need for surgical interventions. Particularly for delicate small cells prone to damage from microelectrodes or other patch clamp techniques, the optical method stands out due to its high spatial resolution. Also, Dyes tend to exhibit better signal-to-noise characteristics and temporal properties (Braubach et al., Reference Braubach, Cohen and Choi2015; Lazzari-Dean et al., Reference Lazzari-Dean, Gest and Miller2021).
However, it is crucial to recognize the drawbacks of this method, specifically issues related to dye concentration and photobleaching. Also, this method applies the dye to the whole cell or part of the tissue, and it is not able to dye a specific single cell (Gest et al., Reference Gest, Yaeger-Weiss, Lazzari-Dean and Miller2021; Khadria Reference Khadria2022). In response to these challenges, VSD or fluorescent bioelectricity reporters (FBRs) have been introduced. Bonding the VSD to the membrane is the method to visualize voltage changes and enable the optical measurement of membrane electric field strength by monitoring changes in the dye’s movement across the membrane or the movement of the dye’s electrons and converting the bioelectric signals into optical signals to analyze the membrane potential changes (Adams and Levin Reference Adams and Levin2012a; Y Wang et al., Reference Wang, Han, Cui and Shi2019b). The response time for electric field or VSD measurements is categorized as slow for seconds (slow dyes) and nanoseconds (fast dyes). Importantly, these dyes transform the electric field into a UV or fluorescent response. Assaying the efficiency of the optical method is based on fractional signal intensity change, ΔF/F per 100 mV (F is called for fluorescence) to report membrane potential changes. Increasing dye concentration or light source power can cause cell damage and phototoxicity (Baxter et al., Reference Baxter, Kirk, Garcia, Raimondi, Holmqvist, Flint, Bojanic, Distefano, Curtis and Xie2002; Khadria Reference Khadria2022).
Slow dyes
Slow dyes, with a net charge, include categories such as carbocyanine, rhodamine with a positive charge, and oxonol with a negative charge (Figure 4a ; Adams and Levin Reference Adams and Levin2012b; Bonzanni et al., Reference Bonzanni, Payne, Adelfio, Kaplan, Levin and Oudin2020). These generally hydrophobic dyes can penetrate the cell membrane and, upon entry, position themselves according to cytoplasmic charge and conditions. When an electric field is applied, the dye changes its location in the membrane, translocating between the aqueous phase and the membrane (Liu and Miller Reference Liu and Miller2019). This disruption in equilibrium is described by the Nernst equation, leading to these dyes being termed Nernstian dyes (Krasne Reference Krasne1980; Zhang et al., Reference Zhang, Yan, Kang, Abou, Le, Jha, Thorek, Kang, Rahmim and Wong2017). The measuring time for these dyes is relatively high, around a few seconds, making them suitable for monitoring long-time events in membrane potential. When attached to the membrane at low concentrations, the advantage of measuring the intensity of the fluorescent dye exists, preventing dye bleaching and color merging. These dyes exhibit a fluorescence change of about 80% to 100% per 100 mV (Yu et al., Reference Yu, Wang and Nie2021). Positive-charged cyanine dyes like IR-780 accumulate in the membrane during resting potential, and upon membrane depolarization, they dissociate to emit fluorescence due to changes in the membrane charge as shown in the left side of Figure 4b (Adams and Levin Reference Adams and Levin2012a). Negative-charged oxonol-based dyes such as Bis-(1,3-Dibutylbarbituric acid) Trimethine Oxonol (DiBAC), RH155 and RH1691 move between the outside and inside of the membrane. When combined with a specific protein in the cytoplasm, the fluorescence intensity increases, emitting fluorescence as shown in the right side of Figure 4b (Momose-Sato et al., Reference Momose-Sato, Sato, Arai, Yazawa, Mochida and Kamino1999; Yu et al., Reference Yu, Wang and Nie2021).
(a) Molecular structure of some slow dyes, (b) Schematic mechanism of measuring membrane potential using negative and positive voltage-sensitive dyes. (c) and (d) DiBAC4(3) dye specifically measures plasma membrane potential changes in Jurkat T-cells, with no response to mitochondrial potential alterations. (e) and (f) Sustained cellular depolarization during apoptosis, which increases with anti-Fas antibody concentration and occurs within 1–2 hours, is indicated by elevated DiBAC4(3) fluorescence (Adapted from reference, (Bortner et al., Reference Bortner, Gómez-Angelats and Cidlowski2001)).

DiBAC and CC2-DMPE (N-[6-chloro-7-hydroxycoumarin-3-carbonyl] dimyristoyl phosphatidyl ethanolamine) are VSD that are capable of assaying the changes in RMP in the noneditable cells (Adams and Levin Reference Adams and Levin2012a). DiBAC4 binds into the cytoplasm ‘protein or into the membrane of the cell and exhibits enhanced fluorescence intensity and spectral shift (Adams and Levin Reference Adams and Levin2012b).
Bonzanni et al., (Bonzanni et al., Reference Bonzanni, Payne, Adelfio, Kaplan, Levin and Oudin2020) introduced a method that is able to measure the RMP in noneditable cells and characterize the contribution of individual ions to the RMP by using the DiBAC dye with the stable signal during the recording. DiBAC has some using limitations like; slow kinetic and dilution of dye. Also, the oxonol-based dyes are time-consuming for dye loading about 30–60 min and multistep preparation protocol. To overcome these challenges, membrane potential dye FMP (FLIPR Membrane Potential dye) was introduced. This dye needs less time for dye loading about 15 min at room temperature and is not affected by dilution with assay buffer or other reagents in compare with DiBAC4 (Baxter et al., Reference Baxter, Kirk, Garcia, Raimondi, Holmqvist, Flint, Bojanic, Distefano, Curtis and Xie2002; Fairless et al., Reference Fairless, Beck, Kravchenko, Williams, Wissenbach, Diem and Cavalié2013).
Bortner et al., (Bortner et al., Reference Bortner, Gómez-Angelats and Cidlowski2001) highlight the critical role of ion movement in apoptosis, emphasizing the alterations in intracellular potassium and sodium levels preceding cell shrinkage, which are essential for apoptosis-related processes. In Jurkat cells, the onset of apoptosis is characterized by an early cellular depolarization driven by a rapid increase in intracellular sodium, a process regulated by the inactivation of Na+/K+-ATPase and decreased potassium uptake. Utilizing DiBAC4(3) flow cytometry, acute changes in plasma membrane potential during apoptosis induced by an anti-Fas antibody in Jurkat cells were measured, along with assessments of intracellular sodium levels. Jurkat cells treated with diverse apoptotic agents, such as anti-Fas antibody, A23187, or thapsigargin, exhibited time-dependent increases in DiBAC4(3) fluorescence, indicating plasma membrane depolarization (Bortner et al., Reference Bortner, Gómez-Angelats and Cidlowski2001). The study utilized DiBAC4(3) dye to monitor plasma membrane potential (PMP) changes in Jurkat T-cells via flow cytometry, showing increased fluorescence with KCl-induced depolarization. DiBAC4(3) did not respond to mitochondrial membrane potential (MMP) changes induced by CCCP (carbonyl cyanide m-chlorophenylhydrazone), confirming its specificity for measuring PMP changes. This indicates DiBAC4(3) can distinctly measure PMP without interference from MMP alterations (Figure 4c and d). The observed cellular depolarization during apoptosis is sustained rather than transient, indicating that cells lose the ability to repolarize, maintaining constant depolarization throughout cell death. This depolarization is time-dependent and sensitive to the concentration of apoptotic stimuli. Higher concentrations of anti-Fas antibodies increase the number of cells with elevated DiBAC4(3) fluorescence, showing a direct link between the extent of apoptotic stimulation and cellular depolarization (Figure 4e ). This depolarization occurs rapidly, within 1 to 2 h after anti-Fas stimulation (Figure 4f ).
Fast dyes
Fast dyes operate on the principle of electrochromism to achieve voltage sensitivity. Examples include Styryls (aminonaphthylethenylpyridinium (ANEP) dyes), RH dyes, Annellated hemicyanine dye, and merocyanin, which reorients or redistribute in the membrane due to an electric field to measure membrane potential. The structure of some fast dyes is demonstrated in Figure 5a (Adams and Levin Reference Adams and Levin2012a; Khadria Reference Khadria2022; Lazzari-Dean et al., Reference Lazzari-Dean, Gest and Miller2021). These dyes, depending on their charge, position the positive side of their chromophore in the extracellular space and the negative side in the hydrophobic part of the membrane. When an electric field is applied, rapid electron transfer (ET) occurs, resulting in a shift in fluorescence emission. This method is particularly rapid due to ET, making it suitable for studying fast cellular events (Figure 5b ; Frey et al., Reference Frey, White, Price, Blackmore, Joshi, Nuccitelli, Beebe, Schoenbach and Kolb2006; Yu et al., Reference Yu, Wang and Nie2021). Fast-response dyes typically exhibit signal changes of about 2%–10% per 100 mV. Slow dyes, in contrast, have higher fluorescence intensity but can only measure transmembrane potential as they reorient across the membrane (Clarke Reference Clarke2010). Fast dyes, however, are suitable for measuring both transmembrane and surface potential due to their local responses to the electric field. These dyes are classified as direct dyes since they directly bond with the membrane, unlike indirect dyes that measure action potential by assessing ion concentrations (Yu et al., Reference Yu, Wang and Nie2021).
(a) Molecular structure of some fast dyes, (b) Schematic mechanism of measuring membrane potential using electrochromic dyes.

Electrochromic dyes
One group of the fast-response dyes that the molecules response through the electric field are electrochromic dyes. When the electrochromic dyes are exposed to the electric field the intramolecular charge transfer will occur on the asymmetry Hemicyanine chromophores (also called “styryl” dyes) and causes the electron distribution in the ground and excited states. So, the shift of absorption and emission can record the action potential of the membrane cell (Figure 5b ; Khadria Reference Khadria2022; Loew Reference Loew2011; Yan et al., Reference Yan, Acker, Zhou, Lee, Bollensdorff, Negrean, Lotti, Sacconi, Antic and Kohl2012; Zhou et al., Reference Zhou, Liu, Muller and Cui2021).
The long axis of the alkyl chain of 4-aminostyryl-1- methylpyridinium iodide [ASP] as a fluorochrome interacts with the hydrophobic part of the membrane cell and the charged pyridine ring perpendicular to the hydrophilic part of the membrane surface (Khadria Reference Khadria2022; Lazzari-Dean et al., Reference Lazzari-Dean, Gest and Miller2021; Yu et al., Reference Yu, Wang and Nie2021). When the voltage is applied and the photon is absorbed by the membrane, the electron in the ground state moves from aniline ring to the exited state of pyridine ring and in the emission process, the electron shifts back to the pyridine ring. The ΔF/F for di-5- ASP per 100 mV is 5% in a hemispherical lipid bilayer (Khadria Reference Khadria2022). The great electrochromic shift occurs when the electronic conjugation between the electron donor and acceptor moieties becomes strong or the size of the molecule of the dye is more than the thickness of the membrane (Kao et al., Reference Kao, Davis, Kim and Beach2001; Khadria Reference Khadria2022). The advantage of the electrochromic is sub-millisecond temporal resolution due to the high fast response to the changes in the electric field but they are not high voltage sensitivity because of the small voltage-induced spectral shifts around 10 nm per 100 mV (Nikolaev et al., Reference Nikolaev, Mironov, Shtyrov, Kvashnin, Mereshchenko, Vasin, Panov and Ryazantsev2023). Also, when the lipid in the structure of the membrane changes due to the biological event and they become tightly or loosely packed, so the emission of the electro-sensitive dye is disturbed (Nikolaev et al., Reference Nikolaev, Mironov, Shtyrov, Kvashnin, Mereshchenko, Vasin, Panov and Ryazantsev2023). Another disadvantage of the electrochromic dye is a poor signal-to-noise ratio because the maximum voltage sensitivity is observed only at the tails of the emission spectra (Khadria Reference Khadria2022; Nikolaev et al., Reference Nikolaev, Mironov, Shtyrov, Kvashnin, Mereshchenko, Vasin, Panov and Ryazantsev2023). Some electrochromic dyes that are analogous to the ASP are (naphthylstyryl-pyridinium) ANEPPS (like: di-4-ANEPPS and di-8-ANEPPS), (dienylstyryl-pyridinium) RH795, and RH414, (naphthylstyryl-pyridinium) di-4-ANEPPDHQ, ANNINE-6 (Obaid et al., Reference Obaid, Loew, Wuskell and Salzberg2004), di-4-ANBDQBS and di-4-ANBDQPQ (Yan et al., Reference Yan, Acker, Zhou, Lee, Bollensdorff, Negrean, Lotti, Sacconi, Antic and Kohl2012). All VSDs feature a 6-amino-naphth-2-yl (AN) donor, an ethene (E) or butadiene (BD) linker, and a pyridinium (P) or quinolinium (Q) acceptor, such as the ANEP chromophore. Alkyl groups at the amino end (di-2-, di-3-, or di-4-) anchor the dye to the membrane, while fluorine substitutions are indicated as (F), (F2), or (CF3) based on their position. A 1-prop-3-yl (triethylammonium) head group (PTEA) ensures water solubility and prevents dye flipping across the membrane (Yan et al., Reference Yan, Acker, Zhou, Lee, Bollensdorff, Negrean, Lotti, Sacconi, Antic and Kohl2012). The fast-responding membrane potential ANEPPS, is hemispherical bilayers that are analog to the ASP dye. This dye is useful for analyzing the length and the degree of saturation of the lipid chain and binding of the cholesterol in the membrane structure (Khadria Reference Khadria2022; Schaffer et al., Reference Schaffer, Ahammer, Müller, Koidl and Windisch1994). Also, the ANEPPS is a good choice for monitoring the electrical activity of its individual neurons and provides fluorescence changes during action potentials (APs) and synaptic potentials and also, a very sensitive probe of the dipole potential. ANEPPS is internalized rapidly to the membrane of the cell and can be more useful for short-term experiments. The disadvantages of using this dye are its phototoxicity and low solubility in the water (Frey et al., Reference Frey, White, Price, Blackmore, Joshi, Nuccitelli, Beebe, Schoenbach and Kolb2006; Fromherz et al., Reference Fromherz, Hübener, Kuhn and Hinner2008; Pucihar et al., Reference Pucihar, Kotnik and Miklavčič2009).
By the extended structure of the ASP and modifying the polar headgroups, the dienylstyryl-pyridinium (RH795) is introduced as another dye with lower toxicity related to ANEPPS and rapid degradation of the signal-to-noise ratio (Obaid et al., Reference Obaid, Loew, Wuskell and Salzberg2004). This voltage-sensitive dye can record the electrical activity of the cell membrane. Another styrylpyridinium probe, RH421, is a fast dye that functions as an electrochromic dye by reorienting within the cell membrane. For a better result of detecting the changes in the electric field strength, the chromophore of the dye must be located near the site that changes the membrane potential. RH421 is a good choice for detecting the changes in the membrane potential near the Na+, K + - ATPase pump (Obaid et al., Reference Obaid, Loew, Wuskell and Salzberg2004).
ANNINE and it derives are another electrochromic dye. ANNINE-based dyes have the ΔF/F = 50% per 100 mV. ANNINE-6 as the one derives from the ANNINE-based dyes has a high solubility in water, strong membrane bonding and voltage sensitivity in neurons with respect to the double positively charged chromophore and two bromide counterions are introduced for staining the cultured cells (Fromherz et al., Reference Fromherz, Hübener, Kuhn and Hinner2008; Kuhn and Fromherz Reference Kuhn and Fromherz2003). The electrochromic dyes, 3-hyrdroxyflavone (3HF or 3-hydroxychromone fluorophore) when excited, will have a tautomeric equilibrium based on an excited state intramolecular excited-state proton transfer (ESPT) reaction. The excited dye possesses between two states of normal excited state (N*) and tautomeric state (T*) which both states are fluorescent and produce the two emission bands. The (T*) has a lower dipole moment compared to the (N*). So, any changes in the intramembrane electric field cause a shift in the excited state equilibrium between the N* and T* states (Kao et al., Reference Kao, Davis, Kim and Beach2001). By the advantages of emission ratiometric detection, the 3-Hydroxyflavone dyes are suitable for imaging the dipole potential of the plasma membrane of cells over di-8-ANEPPS for use in fluorescence microscopy and intramembrane electric field strength with changes in the shape of their fluorescence emission spectrum. Also, the 3HF dyes have higher voltage-sensitive responses than the other classes of fast dyes (Guharay et al., Reference Guharay, Chaudhuri, Chakrabarti and Sengupta1997; Peterka et al., Reference Peterka, Takahashi and Yuste2011; Pucihar et al., Reference Pucihar, Kotnik and Miklavčič2009).
In 2006, Frey et al., (Frey et al., Reference Frey, White, Price, Blackmore, Joshi, Nuccitelli, Beebe, Schoenbach and Kolb2006) investigated the membrane potential charging of Jurkat cells under nanosecond pulsed electric fields (100 kV/cm for 60 s). Using ANNINE-6 dye and a 5-ns laser pulse, they visualized membrane voltage changes with high temporal resolution. Before the pulse, uniform fluorescence indicated consistent resting potential (−50 mV). High electric fields caused a significant fluorescence decrease in both cell hemispheres, slightly more pronounced near the cathode (Figure 6a ). Fluorescence intensity rapidly drops for both cathodic and anodic poles (gray area), reaching a minimum of 15 ns. During the 60-ns pulse, intensity slightly increases at the cathodic pole and more strongly at the anodic pole. Post-pulse, the intensity rises faster, almost returning to normal levels within 30 s (Figure 6b ). Voltage evolution was analyzed at both anodic and cathodic sides, revealing a polarity-dependent asymmetry in electrical transport, with greater conduction current observed at the anodic end (Figure 6c ).
(a) High electric fields reduced fluorescence in Jurkat cells, with a greater decrease near the cathode, (b) Fluorescence drops and recovers quickly during and after a 60-ns pulse, (c)with greater intensity increase and conduction at the anodic pole. (Adapted from reference (Frey et al., Reference Frey, White, Price, Blackmore, Joshi, Nuccitelli, Beebe, Schoenbach and Kolb2006)), (d)diagram of a mouse dendrite with the targeted spine, (e) Calcium Green-1 fluorescence in response to two bAPs, (f) Simultaneous di-2-AN(F)EPPTEA VSD fluorescence, (g) Single-sweep VSD fluorescence, (h) Fluorescence maps of
 $ {V}_m $
during sinus rhythm (Adapted from reference(Yan et al., Reference Yan, Acker, Zhou, Lee, Bollensdorff, Negrean, Lotti, Sacconi, Antic and Kohl2012), (i) Phototoxicity of dyes in HeLa cells, (j) Phototoxicity of PKMR and MTR CMXRos and (k) PKMDR and MTDR in HeLa cells, (l) Phototoxicity of mitochondrial dyes in rat cardiomyocytes Adapted from reference(Yang et al., Reference Yang, Li, Ling, Liu, Huang, Ying, Zhao, Zhao, Lei and Chen2020), (m) HVI–COT–Cy3 allowed 30-minute imaging in neurons with no cell changes, (n) No significant effect on action potential frequency under controlled illumination, (o) Prolonged illumination decreased action potential frequency due to phototoxicity, (p) HVI–COT–Cy3 showed minimal bleaching and captured full action potentials in cardiomyocytes Adapted from reference(Liu et al., Reference Liu, Ling, Chen, Cao, Peng, Zhang, Ji, Guo, Chen and Zou2023).

Hemicyanine dyes are versatile VSDs widely used for monitoring changes in membrane potential across various biological systems. Their recent advancements have expanded their application, allowing the recording of electrical activity in human hearts, particularly in transplant patients, and capturing high-resolution membrane potential fluctuations in dendritic spines. The structure of hemicyanine dyes is characterized by a combination of an electron-donating group, a flexible linker, and an electron-accepting group, allowing for tuning based on specific imaging needs. Fluorinated versions of these dyes reduce phototoxicity, enhancing cell penetration and membrane permeability while minimizing light-induced damage, making them suitable for extended imaging use. In membrane potential imaging, fluorination improves the dyes’ stability and performance, ensuring lower toxicity and higher reliability in bioimaging applications. Some studies used fluorinated hemocyanin dye to sense the voltage in cardiac or neural (Casa and Henary Reference Casa and Henary2021; Sacconi et al., Reference Sacconi, Ferrantini, Lotti, Coppini, Yan, Loew, Tesi, Cerbai, Poggesi and Pavone2012; Yan et al., Reference Yan, Acker, Zhou, Lee, Bollensdorff, Negrean, Lotti, Sacconi, Antic and Kohl2012).
In 2012, Yan et al., synthesized 19 fluorinated hemicyanine VSDs with varied substitution patterns, demonstrating their effectiveness in cardiac and neuronal voltage sensing. These dyes, optimized for edge excitation to enhance sensitivity, were used with Calcium Green-1 for simultaneous voltage and calcium imaging in single spines. Figure 6d
highlights slower calcium responses in dendrites, showing lower ΔF/F due to internal membrane staining. Figure 6e and f
present fluorescence responses of Calcium Green-1 and di-2-AN(F)EPPTEA, respectively, to backpropagating APs while Figure 6g
demonstrates single-sweep VSD fluorescence capturing rapid voltage changes. Fluorinated VSDs, such as di-4-AN(CF3)E(F)PPTEA, were effective in cardiomyocyte imaging, whole-heart optical mapping, and simultaneous voltage
 $ {V}_m $
and calcium
 $ {Ca}^{2+} $
fluorescence tracking during sinus rhythm (Figure 6h
; Yan et al., Reference Yan, Acker, Zhou, Lee, Bollensdorff, Negrean, Lotti, Sacconi, Antic and Kohl2012).
Voltage imaging is a noninvasive method for monitoring cellular electrical activity, but phototoxicity from fluorophores can lead to ROS production, photobleaching, and biomolecule damage. Recent advances in photostable, low-toxicity probes enable safer, long-term live-cell imaging. Cyanine dyes, such as Cy3 and Cy5, have been shown to reduce phototoxicity. A 2020 study by Yang et al., demonstrated that Cy3-bisCOT significantly reduced apoptosis (Figure 6i ), and PK Mito dyes like PK Mito Red and PK Mito Deep Red allowed for longer observation times and maintained over 60% cell viability, unlike MitoTracker dyes that caused rapid cell death (Figure 6j and k ). Testing on rat cardiomyocytes showed that PK Mito dyes were less toxic, enabling up to 130 seconds of observation (Figure 6l ; Yang et al., Reference Yang, Li, Ling, Liu, Huang, Ying, Zhao, Zhao, Lei and Chen2020).
In 2023, Liu et al., developed hybrid voltage idicators (HVIs) by combining cyanine dyes with cyclooctatetraene (COT) for voltage sensing using an electrochromic FRET mechanism. HVI–COT–Cy3 demonstrated low phototoxicity and high photostability, allowing 30-min voltage imaging in neurons with no morphological changes after six 5-min cycles (Figure 6m ). It had no significant impact on spontaneous action potential frequency under specific illumination (Figure 6n ), but prolonged illumination caused a decrease in action potential frequency due to phototoxicity (Figure 6o ). HVI–COT–Cy3 also showed minimal bleaching in cardiomyocytes over 30 min and captured the full action potential in ventricular myocytes (Figure 6p ; Liu et al., Reference Liu, Ling, Chen, Cao, Peng, Zhang, Ji, Guo, Chen and Zou2023).
Fluorescence resonance energy transfer (FRET)-based dyes
Förster resonance energy transfer (FRET) is a phenomenon characterized by the transfer of energy between a donor and acceptor molecule through dipole–dipole coupling (Figure 7a ). Upon excitation of the donor molecule, energy is emitted and transferred to acceptor molecules initially in the ground state, subsequently raising them to an excited state (Figure 7b ; Bajar et al., Reference Bajar, Wang, Zhang, Lin and Chu2016; Baker et al., Reference Baker, Mutoh, Dimitrov, Akemann, Perron, Iwamoto, Jin, Cohen, Isacoff and Pieribone2008). This process is particularly notable when both the donor and acceptor molecules are fluorophores, leading to what is commonly known as FRET. To enable the FRET phenomenon, donor and acceptor molecules must be positioned near each other, typically within a distance of 10 to 100 angstroms. Moreover, the emission spectrum of the donor molecule and the absorption spectrum of the acceptor molecule should overlap (Bajar et al., Reference Bajar, Wang, Zhang, Lin and Chu2016). One approach to achieving the FRET phenomenon involves converting the nonfluorescent acceptor into its fluorescent form, ensuring that the emission band of the donor and the absorption band of the acceptor overlap. Another strategy involves both the donor and acceptor being fluorescent molecules. In measuring membrane potential, the donor chromophore is bonded to the membrane and is amphiphilic, anchored to the exterior of the membrane (Yang and St-Pierre Reference Yang and St-Pierre2016). The mobile anionic acceptor moves between the inner and outer leaflets of the plasma membrane. When the membrane is at resting potential, both chromophores are in close proximity to each other on the exterior of the membrane, facilitating effective FRET(Bando et al., Reference Bando, Grimm, Cornejo and Yuste2019; Nikolaev et al., Reference Nikolaev, Mironov, Shtyrov, Kvashnin, Mereshchenko, Vasin, Panov and Ryazantsev2023). At this stage, when the donor molecules are excited, the FRET phenomenon occurs due to the proximity of the acceptor to the donor (Gonzalez and Tsien Reference Gonzalez and Tsien1997; Liu and Miller Reference Liu and Miller2019). However, when the membrane potential changes to an action potential, the mobile anionic acceptor translocates to the other side of the membrane. At this point, the FRET phenomenon is not observed, and only the emission of the donor can be detected due to the increased distance between the donor and acceptor (Figure 7c ). The fractional fluorescence change (DF/F) ranging of the FRET is from dozens to hundreds of percent per 100 mV (Nikolaev et al., Reference Nikolaev, Mironov, Shtyrov, Kvashnin, Mereshchenko, Vasin, Panov and Ryazantsev2023). The drawbacks of the FRET mechanism include its dependence on achieving precise stoichiometry, which is influenced by the solubility of the acceptor (Khadria Reference Khadria2022). Moreover, the translocation of the mobile acceptor from one side of the membrane to the other is time-consuming, rendering this method less reliable for electro-optic response. Additionally, alterations in the solubility of the acceptor within the membrane could potentially impact the resting potential of cells (Baker et al., Reference Baker, Mutoh, Dimitrov, Akemann, Perron, Iwamoto, Jin, Cohen, Isacoff and Pieribone2008; Gonzalez and Tsien Reference Gonzalez and Tsien1997; Khadria Reference Khadria2022).
(a) and (b) FRET is energy transfer between donor and acceptor molecules through dipole coupling. (c) FRET between a stationary donor and a mobile anionic acceptor on the membrane changes with membrane potential.

(a) photoinduced electron transfer (PeT) process, (b) Confocal microscopy of HEK cells treated with dsVF2.2(OMe).Cl and (c) have a voltage sensitivity of 63% per 100 mV (Adapted from reference (Liu and Miller Reference Liu and Miller2019)).

Molecular wire-based dyes
The photoinduced ET (PeT) process, central to solar energy materials, fluorescent sensors, and switches, involves electron movement from an excited state to a ground state between energy levels (Khadria Reference Khadria2022; Liu and Miller Reference Liu and Miller2019). PeT-based color-sensitive sensors feature a fluorophore as a rich electron acceptor connected to an electron donor by a molecular wire. During PeT, in the excited state, ET from the donor to the fluorophore via the wire quenches the fluorescence. Hyperpolarized states reduce fluorescence, while depolarized states increase it due to changes in aniline donor potential and PeT (Figure 8a; Boggess et al., Reference Boggess, Gandhi, Benlian and Miller2021). PeT-based color-sensitive sensors provide precise, noninvasive measurement of cell potential changes, offering FLIM-based methods to reduce voltage noise. With rapid response rates in nanoseconds, they enable real-time monitoring of neuronal and cardiomyocyte potential changes (Gest et al., Reference Gest, Yaeger-Weiss, Lazzari-Dean and Miller2021).
VoltageFluor dyes’ sensitivity depends on an aniline donor, influenced by molecular wire’s electron affinities, resulting in fluorescence changes from 5% to 49% per 100 mV in HEK cells (Khadria Reference Khadria2022). Fast response kinetics (around 25 ns) and fluorescence lifetime variation support PeT-based voltage sensing. PeT-based color-sensitive sensors offer high sensitivity and precision for detecting potential changes, providing nondisruptive voltage measurements in diverse biological contexts (Monteleone et al., Reference Monteleone, Schary, Wenzel, Langhals and Dietrich2021).
Microscope Imaging fluorescence lifetime imaging microscopy (FLIM) measures cell membrane potential by detecting changes in fluorophore decay rates (van Munster and Gadella Reference van Munster and Gadella2005; Wang et al., Reference Wang, Periasamy, Herman and Coleman1992). FLIM relies on fluorescence lifetime, which is the average time that a fluorophore remains in an excited state before being quenched—an intrinsic property unaffected by factors like dye concentration or light intensity, ensuring precise measurements. Potentiometric dyes, sensitive to membrane potential changes, enable FLIM’s application for voltage measurement (Scipioni et al., Reference Scipioni, Rossetta, Tedeschi and Gratton2021; Suhling et al., Reference Suhling, Hirvonen, Levitt, Chung, Tregidgo, Le Marois, Rusakov, Zheng, Ameer-Beg and Poland2015). FLIM captures fluorophore lifetime at each pixel, analyzed using software to derive membrane potential values from a calibration curve. With up to 3–6 mV resolution in single-cell measurements, FLIM accurately determines absolute membrane potential, unaffected by factors impacting intensity-based methods. FLIM’s sensitivity to environmental parameters like pH and ion concentration makes it versatile for functional imaging. Its immunity to factors like photobleaching or excitation intensity enhances reliability, making FLIM a valuable tool for precise voltage measurements in diverse biological contexts (Lazzari-Dean et al., Reference Lazzari-Dean, Gest and Miller2021; Suhling et al., Reference Suhling, Hirvonen, Levitt, Chung, Tregidgo, Le Marois, Rusakov, Zheng, Ameer-Beg and Poland2015). Liu et al., discovered that symmetrical sulfonation on VF dyes lowers their tilt angle in the plasma membrane, boosting voltage sensitivity by approximately 16%. Confocal microscopy of HEK cells treated with dsVF2.2(OMe). Cl shows membrane-associated fluorescence (Figure 8b). The %ΔF/F compared to the final membrane potential (mV) suggests a voltage sensitivity of about 63% per 100 mV (Figure 8c; Liu and Miller Reference Liu and Miller2019).
Genetically encoded voltage indicators (GEVIs)
The accumulation of dyes in specific areas of cells or tissues prompted researchers to employ genetically engineered light-emitting protein sensors known as GEVIs (Lee et al., Reference Lee, Piao, Sepheri-Rad, Jung, Sung, Y-K and Baker2016; Yosinski et al., Reference Yosinski, Clune, Nguyen, Fuchs and Lipson2015; Zhang et al., Reference Zhang, Yokoyama and Sakamoto2021). These indicators could be selectively expressed in target cells and only label the cell population determined by the specificity of the promoter (Nikolaev et al., Reference Nikolaev, Mironov, Shtyrov, Kvashnin, Mereshchenko, Vasin, Panov and Ryazantsev2023; Yang and St-Pierre Reference Yang and St-Pierre2016). GEVIs enabled the recording of voltage from numerous neurons both in vivo and in vitro within a single field of view, boasting millisecond-scale responses capable of yielding high signal-to-noise ratios (SNR) while being minimally invasive (Mutoh et al., Reference Mutoh, Akemann and Knöpfel2012). By incorporating fluorescent proteins (FP) into the voltage sensing domain (VSD) of GEVIs, changes in membrane potential could be optically detected. The VSD, comprised of four transmembrane segments (S1-S4), undergoes conformational changes in response to alterations in membrane potential (Figure 9a ; Bando et al., Reference Bando, Grimm, Cornejo and Yuste2019). Initially, the FlaSh sensor, which fused green fluorescent protein (GFP) to the Drosophila Shaker potassium channel, attempted to measure membrane potential by altering fluorescence intensity (−1.4% in ΔF/F for a 100-mV change), but faced challenges such as poor plasma membrane expression and targeting to neuronal membranes (Baker et al., Reference Baker, Mutoh, Dimitrov, Akemann, Perron, Iwamoto, Jin, Cohen, Isacoff and Pieribone2008; Mutoh et al., Reference Mutoh, Akemann and Knöpfel2012). Subsequent generations introduced voltage-sensitive FP (VSFPs) to address these issues, as the presence of VSFPs in channels like potassium, sodium, or proton channels could affect the chemical environment of the VSFP chromophore, altering brightness. GEVIs like Bongwoori or ArcLight consist of a VSD fused to an FP via a short linker sequence, with mechanical movements of the VSD moderating the efficiency of FRET between the FP donor and acceptor molecules (Baker et al., Reference Baker, Mutoh, Dimitrov, Akemann, Perron, Iwamoto, Jin, Cohen, Isacoff and Pieribone2008; Lee et al., Reference Lee, Geiller, Jung, Nakajima, Y-K and Baker2017; Mutoh et al., Reference Mutoh, Akemann and Knöpfel2012). GEVIs find application in various organisms including worms, flies, and mice (Lee et al., Reference Lee, Piao, Sepheri-Rad, Jung, Sung, Y-K and Baker2016). To localize GEVIs to cell membranes for measuring membrane potential, factors within the cells facilitate their translocation, with signal sequences like Golgi-to-plasma membrane trafficking signal (Golgi TS) and endoplasmic reticulum export signal (ER ES) added to transgenes to enhance transport from the ER to the Golgi and ultimately to the cell membrane (Lee et al., Reference Lee, Kang, Y-K and Baker2022; Lee et al., Reference Lee, Piao, Sepheri-Rad, Jung, Sung, Y-K and Baker2016; Yang and St-Pierre Reference Yang and St-Pierre2016).
(a) Genetically encoded voltage indication (GEVIs), (b) FRET-Opsin Genetically encoded voltage indicators, (c) Microbial rhodopsin-based GEVI, (d) Genetically encoded calcium indicators (GECIs).

FRET-opsin genetically encoded voltage indicators
In the FRET-Opsin GEVIs the FP proteins fused or linked to the rhodopsin proteins. The absorption spectrum of microbial rhodopsin has a large range spectrum overlaps with the emission of lots of FP or chemical fluorophores (Kandori Reference Kandori2015; Zhang et al., Reference Zhang, Yokoyama and Sakamoto2021). By changing in the transmembrane electric field, the rhodopsin that served as the FRET acceptor absorbed the emission of the FP that served as the donor FRET so the attached FP quenched by the rhodopsin (Figure 9b; Bando et al., Reference Bando, Grimm, Cornejo and Yuste2019; Ernst et al., Reference Ernst, Lodowski, Elstner, Hegemann, Brown and Kandori2014; Hofmann and Lamb Reference Hofmann and Lamb2023).
Microbial rhodopsin-based GEVI
Optogenetics entails achieving precise temporal and spatial resolution by integrating optical techniques with genetic engineering to monitor cellular, tissue, and organ activity. Across organisms, there exists a ubiquitous expression of transmembrane photoactive proteins known as rhodopsins (Hou et al., Reference Hou, Venkatachalam and Cohen2014; Zhang et al., Reference Zhang, Yokoyama and Sakamoto2021). As depicted in Figure 9c rhodopsins are divided into two main categories: microbial rhodopsins and animal rhodopsins. Microbial rhodopsins function as ion pumps and ion channels, responding to light stimuli through interaction with specific transducers. In animals, rhodopsins are linked with G-proteins to facilitate transduction pathways (Nikolaev et al., Reference Nikolaev, Mironov, Shtyrov, Kvashnin, Mereshchenko, Vasin, Panov and Ryazantsev2023; Yang and St-Pierre Reference Yang and St-Pierre2016). The apoprotein called opsin with the structure of the seven transmembrane α helix and the photosensitive chromophore called retinal, form the structure of rhodopsin. In the ground state, the 11-cis-retinal chromophore is bound to the opsin apoprotein by a protonated Schiff base. By absorbing the light, the11-cis-retinal chromophore is photoisomerized to the all-trans configuration and it changes from the ground state into the intermediate state and reactive state (Khadria Reference Khadria2022). For coming back to the ground state, the rhodopsin should release the excess energy as the fluorescence. Light absorption and changes in membrane potential affect the local electrochemical potential at the Schiff base, allowing for the recording of membrane voltage (Gong et al., Reference Gong, Huang, Li, Grewe, Zhang, Eismann and Schnitzer2015; Joshi et al., Reference Joshi, Rubart and Zhu2020). Alterations in membrane potential cause shifts in the electrochemical conditions of retinal, altering the protein’s fluorescence protonated states fluoresce, while deprotonated states do not. This mechanism facilitates the measurement of membrane potential fluctuations (Ernst et al., Reference Ernst, Lodowski, Elstner, Hegemann, Brown and Kandori2014). Through mutagenesis techniques, microbial rhodopsin functionality was adapted to detect membrane potentials within a physiologically relevant range. Microbial rhodopsin GEVIs offer rapid response rates, typically within sub-millisecond timeframes, and exhibit a fractional change in fluorescence intensity ranging from 30% to 90% per 100 mV (Kannan et al., Reference Kannan, Vasan and Pieribone2019; Mollinedo-Gajate et al., Reference Mollinedo-Gajate, Song and Knöpfel2021). However, these GEVIs face limitations such as low fluorescent intensity, inadequate signal-to-noise ratio (SNR), and extensive requirements for genetic engineering. The quantum yields of rhodopsin sensors typically fall within the range of 0.8%–1.2%. Utilizing the opsin protein to record voltage in cultured neurons or tissue slices necessitates high illumination intensities, typically around (~12 W/mm2 or 1–10 W/mm − 2, or several tens to a hundred), which can create a significant thermal environment potentially damaging the tissue. To address this thermal issue, opsins are combined with FP to form an FRET pair (Gong et al., Reference Gong, Huang, Li, Grewe, Zhang, Eismann and Schnitzer2015; Lin and Schnitzer Reference Lin and Schnitzer2016; Nikolaev et al., Reference Nikolaev, Mironov, Shtyrov, Kvashnin, Mereshchenko, Vasin, Panov and Ryazantsev2023). Archaerhodopsin-3 (Arch), derived from the Halorubraceae family, is a microbial rhodopsin functioning as a light-driven outward proton pump. When excited by green light (558 nm), Arch emits far-red fluorescence at 687 nm due to the protonation of Aspartic acid 95, acting as the counterion to the Schiff base (Gong et al., Reference Gong, Li and Schnitzer2013). Light absorption triggers conformational and electronic reorganizations, leading to proton transfer from the cell’s interior to its exterior. While Arch serves as a high-speed fluorescent voltage sensor, it faces challenges such as photocurrents, inadequate SNR, and the need for extensive engineering of Arch variants (Joshi et al., Reference Joshi, Rubart and Zhu2020; Rhee et al., Reference Rhee, Leong, Mukim, Kang, Lee, Bilbao-Broch and Baker2020). In efforts to enhance Arch performance and mitigate photocurrents while boosting sensitivity, mutations targeting residues involved in the photocycle or around the retinal have been introduced. Variants like Arch-D95N, for instance, exhibit a 40% change in fluorescence per 100 mV (Flytzanis et al., Reference Flytzanis, Bedbrook, Chiu, Engqvist, Xiao, Chan, Sternberg, Arnold and Gradinaru2014; Gong et al., Reference Gong, Li and Schnitzer2013). In 2012, a fast and sensitive voltage indicator based on green-absorbing proteorhodopsin, known as proteorhodopsin optical proton sensor (PROPS), was developed, initially applicable only in Escherichia coli due to challenges in localizing PROPS to the plasma membrane of eukaryotic cells (Gong et al., Reference Gong, Li and Schnitzer2013; Nadeau Reference Nadeau2015). To address these limitations, Archaerhodopsin 3 (Arch), another microbial rhodopsin capable of mammalian plasma membrane localization, was introduced. This Arch variant enables the recording of individual APs in mammalian neurons in vitro, offering a high SNR, low phototoxicity, and the ability to map neuronal APs with sub-millisecond temporal resolution. Increasing the membrane potential voltage results in increased fluorescent intensity. Through mutation at D95N in Arch, the photocurrent can be eliminated (Baker et al., Reference Baker, Mutoh, Dimitrov, Akemann, Perron, Iwamoto, Jin, Cohen, Isacoff and Pieribone2008; Mutoh et al., Reference Mutoh, Akemann and Knöpfel2012; Peng et al., Reference Peng, Xu and Zou2017; Zhang et al., Reference Zhang, Yokoyama and Sakamoto2021).
Genetically encoded calcium indicators (GECIs)
Intracellular calcium has a crucial role in the physiological process in the cell. So, changing in the calcium concentration could indicate changes in the electrical activity of the cells (Lee et al., Reference Lee, Piao, Sepheri-Rad, Jung, Sung, Y-K and Baker2016; Yang and St-Pierre Reference Yang and St-Pierre2016). When the influx of calcium through the voltage-gated calcium channels is united with the APs of the neural cells, the changes in the electrical activity of the neurons can monitored indirectly. By imagining the calcium flux into the neurons, the measure of the action potential of the neural cell is possible. Calcium dyes indicators like Oregon Green BAPTA-1 (OGB-1), fluo-3, Rhodamine-2, fluo-4, and fura-2 are brighter and photostable with high-affinity and easier to use (Khadria Reference Khadria2022; Oh et al., Reference Oh, Lee and Kaang2019). Also, this technique allows the researcher for monitoring the action potential of a large population of neurons with single-cell resolution. However, the disadvantages of these techniques are that dyes can accumulate in the cell when the concentration of calcium is high (Lohr et al., Reference Lohr, Beiersdorfer, Fischer, Hirnet, Rotermund, Sauer, Schulz and Gee2021; Mank and Griesbeck Reference Mank and Griesbeck2008). Calcium imaging with larger signal changes (ΔF/F = 1%–20%) and excellent SNR has a lower temporal resolution (typically milliseconds rather than microseconds; Carter and Shieh Reference Carter and Shieh2015). The ratiometric FRET imaging is brighter and allows better identification of expressing cells. The GECIs based on FP-based calcium indicators are categorized into groups (Suzuki et al., Reference Suzuki, Kanemaru and Iino2016). The CaM/M13-based GECIs consist of blue- or cyan-emitting mutants of the green fluorescent protein (GFP) and enhanced green- or yellow-emitting GFP with calmodulin and the calmodulin-binding peptide M13 between them. When the four calciums are bonded to the calmodulin, the calmodulin wraps around the M13 and causes the FRET between the two GFPs (Figure 9d ; Miyawaki et al., Reference Miyawaki, Llopis, Heim, McCaffery, Adams, Ikura and Tsien1997). The next GECIs based on FP-based calcium indicators introduced for in vivo imaging were troponin C (TnC) from toadfish Opsanus tau. The calcium can bind to the C-terminal domain of TnC which they have two calcium ion-binding sites per molecule (Thestrup et al., Reference Thestrup, Litzlbauer, Bartholomäus, Mues, Russo, Dana, Kovalchuk, Liang, Kalamakis and Laukat2014). In these GECIs, the TnC was attached by linkers into the two FPs as acceptors and donners. The lower the amount of Ca2 + −binding sites in GECIs enhanced the efficiently and provided a more linear response and the calcium quantification became high. So, the CaM/M13-based GECIs have disadvantages because of 4 calcium binding sites related to the TnC-based GECIs (Barykina et al., Reference Barykina, Subach, Doronin, Sotskov, Roshchina, Kunitsyna, Malyshev, Smirnov, Azieva and Sokolov2016; Hu et al., Reference Hu, Hu, M-L and Wang2013; Madhusoodanan Reference Madhusoodanan2019). Other disadvantages of these GECIs are that they have low fluorescence at resting Ca2+ levels in neurons and the majority of the GECIs should transferred to the cell by the adeno-associated virus (AAV)-based vectors which has some limitations for packaging. Also, the GECIs with high specificity and sensitivity but their potential is limited because of their large size (Miyawaki et al., Reference Miyawaki, Llopis, Heim, McCaffery, Adams, Ikura and Tsien1997; Pavlou et al., Reference Pavlou, Babutzka and Michalakis2022; Thestrup et al., Reference Thestrup, Litzlbauer, Bartholomäus, Mues, Russo, Dana, Kovalchuk, Liang, Kalamakis and Laukat2014).
The method for creating GEVIs involves fusing the gene encoding a fluorescent protein with a linker fragment into the voltage-sensing domain (VSD) of a channel (Rhee et al., Reference Rhee, Leong, Mukim, Kang, Lee, Bilbao-Broch and Baker2020). To ensure efficient movement of GEVIs between the ER and Golgi, and proper localization to the cell membrane, trafficking signals like TS-ER sequences are added to vectors or plasmids using polymerase chain reaction (PCR) with overlapping fragments (Lee et al., Reference Lee, Kang, Y-K and Baker2022). The gene arrangement on the vector is adjusted based on specific research objectives (Beck and Gong Reference Beck and Gong2019; Lee et al., Reference Lee, Piao, Sepheri-Rad, Jung, Sung, Y-K and Baker2016; Yang and St-Pierre Reference Yang and St-Pierre2016). For transient transfection, the transgene is incorporated into Lipofectamine and then introduced into target cells. These cells are placed in a patch chamber, and filamented glass capillaries are prepared to achieve the desired resistances. Voltage steps are applied, and the procedures are carried out under an inverted microscope for epifluorescence imaging (Thestrup et al., Reference Thestrup, Litzlbauer, Bartholomäus, Mues, Russo, Dana, Kovalchuk, Liang, Kalamakis and Laukat2014). A Xenon arc lamp serves as the light source, with a filter cube containing an excitation filter and an emission filter. An oil-immersion objective lens is used to focus excitation light and collect emitted fluorescence. Fluorescence signals are recorded using a high-speed charge-coupled device (CCD) camera mounted on the microscope (Beck and Gong Reference Beck and Gong2019; Platisa and Pieribone Reference Platisa and Pieribone2018). A slow-speed color CCD assists in locating cells and pipettes during patch clamp experiments. Images from these experiments define ΔF/F as the change in fluorescence during an applied voltage step and at rest, with SNR calculated using the equation (ΔF/F) × F0. This process allows for precise measurement of voltage changes in cells through fluorescence imaging and recording during patch clamp experiments. All procedures are shown in Figure 10a (Beck and Gong Reference Beck and Gong2019; Lee et al., Reference Lee, Piao, Sepheri-Rad, Jung, Sung, Y-K and Baker2016; Lin and Schnitzer Reference Lin and Schnitzer2016).
(a) The method for creating genetically encoded voltage indicators (GEVIs), (b) the method for genetically encoded calcium indicators (GECIs), (c) the method for TnC-based GECIs.

The preparation method for GECIs involves placing a slice of neural tissue in an extracellular solution under a two-photon microscope. Voltage recordings are conducted using whole-cell patch-clamp techniques. Patch pipettes with the desired resistance are attached to the cell, while another pipette filled with extracellular solution is placed in the surrounding environment (Palmer Reference Palmer2019). A third pipette, containing a calcium indicator dye, is mounted on the microscope and positioned near the cell using an electrode holder attached to a micromanipulator. This setup allows for the detection of excitation and emission signals under visual control. The selected wavelength of excitation photons is used to image the calcium indicator, and neuronal activity is detected by changes in fluorescence through epifluorescence imaging (Figure 10b ). To overcome the limitations of calcium indicator dyes, genetically encoded calcium indicators (GECIs) are introduced as voltage-sensitive probes (Barykina et al., Reference Barykina, Subach, Doronin, Sotskov, Roshchina, Kunitsyna, Malyshev, Smirnov, Azieva and Sokolov2016; Catterall Reference Catterall2011; Nevian and Helmchen Reference Nevian and Helmchen2007).
Also, the method for TnC-based GECIs involves using a transgene that includes a calcium-binding site, such as calmodulin or Troponin C, linked to two fluorescent proteins (one donor and one acceptor). This construct is created using CR with overlapping fragments. The cDNA gene library can be expressed in mammalian cells using vectors like pcDNA3 or in bacteria using vectors like pRSETB. Once the chimeric protein is expressed, it is isolated and purified. An optical microscope equipped with a cooled CCD camera and an optical filter changer is used to monitor and image changes in FRET at specific excitation and emission wavelengths, along with varying concentrations of Ca2+ (Lee et al., Reference Lee, Kang, Y-K and Baker2022; Miyawaki et al., Reference Miyawaki, Llopis, Heim, McCaffery, Adams, Ikura and Tsien1997).
Patch pipettes, adjusted to the desired resistances, apply voltage steps within the required range to stimulate APs in cells while holding the cell membrane potential at the desired mV. For bacterial expression, varying calcium concentrations are applied to plates containing bacteria with membranes permeabilized using polylysine and ionomycin. In mammalian expression, GECI-encoding genes are injected into the cortex of animals. After decapitation, coronal cortical tissue slices are incubated in an ice-cold standard extracellular solution. Patch pipettes with the desired resistances and voltage steps are used to stimulate APs in cells while maintaining the cell membrane potential at the desired mV (Figure 10c ; Thestrup et al., Reference Thestrup, Litzlbauer, Bartholomäus, Mues, Russo, Dana, Kovalchuk, Liang, Kalamakis and Laukat2014).
Gong et al., (Gong et al., Reference Gong, Wagner, Zhong Li and Schnitzer2014) developed FRET-opsin fluorescent voltage sensors that combine bright FP with L. maculans (Mac) rhodopsin’s rapid kinetics. These sensors are highly effective at detecting fast neural APs in cultured cells, offering a fourfold increase in kinetic speed and a two- to fourfold increase in brightness compared to Arclight, with significant responses to APs (DF/F = 5%). For research in cultured neurons and brain slices, FRET-opsin constructs with a CaMKIIa promoter and the woodchuck hepatitis post-transcriptional regulatory element (WPRE) were developed (Figures 11a and b). The terminal placement of trafficking signals did not affect membrane localization, as fluorescence emission was primarily membrane-localized with minimal intracellular aggregation in transfected neurons as depicted left side of Figure 11c Image pixels showing the highest DF/F changes in response to a voltage step protocol were membrane-localized and colocalized with baseline fluorescence signals Figure 11c right side.
(a) and (b) FRET-opsin sensors with mOrange2/mCitrine were targeted to the neuron membrane using the Camk2a promoter and TS/ER sequences. (c) Fluorescence signals from neurons labeled with MacQ-mOrange2 and MacQ-mCitrine show colocalization between fluorescence and voltage response regions. The left images display the fluorescent protein’s color channel, while the right images are spatial maps of the fluorescence response to a ~ 100 mV voltage step depolarization (Adapted from reference(Gong et al., Reference Gong, Wagner, Zhong Li and Schnitzer2014)). (d) Voltage alters fluorescence in eFRET GEVIs by affecting the protonation and absorption spectrum of the Schiff base connecting the retinal to the protein. (e) Voltage measurement using GEVIs in HEK293 cells (f) The fluorescence of all eFRET GEVIs exhibited a nearly linear relationship with the applied voltage (Adapted from reference(Zou et al., Reference Zou, Zhao, Douglass, Hochbaum, Brinks, Werley, Harrison, Campbell and Cohen2014a)).

In 2014, Zou et al., (Zou et al., Reference Zou, Zhao, Douglass, Hochbaum, Brinks, Werley, Harrison, Campbell and Cohen2014a) introduced a collection of multicolored, highly fluorescent GEVIs. These indicators feature sensitivities ranging from 8% to 13% ΔF/F per 100 mV and response times of 4–7 ms. For the eFRET GEVIs, they used an electrochromic quencher, a mutant of Arch named QuasAr2 (Figure 11d ). Given that QuasAr2 absorbs strongly between 500 and 640 nm, they anticipated that eFRET would be effective for FP with various emission wavelengths, leading them to develop a range of eFRET proteins. The emission spectra of these proteins overlap to some extent with QuasAr2’s absorption spectrum. When tested in HEK cells, the eFRET GEVIs effectively localized to the plasma membrane and displayed bright fluorescence upon excitation at 3 W/cm2 with appropriate excitation and emission wavelengths (Figure 11e ). The fluorescence response of these indicators showed a nearly linear correlation with the applied voltage (Figure 11f ).
BODIPYs
Dipyrromethene boron difluoride (BODIPY) fluorophores, such as 4,4′-difluoro-4-bora-3a,4a-diaza-s-indacene, are fluorescent molecules integrated into surfactants (Figure 12a ) (H Wang et al., Reference Wang, Zhao, Liu, Wang and Wang2019a). These fluorescent surfactants, characterized by their good hydrophilicity and biocompatibility, find utility in cell membrane imaging and photodynamic therapy (PDT) through the generation of reactive oxygen species (ROS; Nikolaev et al., Reference Nikolaev, Mironov, Shtyrov, Kvashnin, Mereshchenko, Vasin, Panov and Ryazantsev2023). BODIPYs offer advantages including high molecular extinction coefficients and narrow absorption and emission bands, resulting in enhanced brightness. The chemical makeup of BODIPY can be altered to include various functionalities. With excitation wavelengths around 488 nm and emission around 500 nm, BODIPYs are well-suited for incorporation into molecular wire-based, photoinduced electron-transfer (PeT) membrane potential sensing frameworks (Boens et al., Reference Boens, Leen and Dehaen2012). Franke et al., (Franke et al., Reference Franke, Raliski, Boggess, Natesan, Koretsky, Zhang, Kulkarni, Deal and Miller2019) introduced sulfonated BODIPYs into a molecular wire voltage-sensing framework for PeT-based voltage-sensitive measurements (Franke et al., Reference Franke, Raliski, Boggess, Natesan, Koretsky, Zhang, Kulkarni, Deal and Miller2019). Fluorescence images of amidemH (dye 35) are adjusted to enhance membrane staining visibility (Figure 12b ), while plots demonstrate the fractional fluorescence change (ΔF/F) during hyper- and depolarizing steps in a single HEK cell under whole-cell voltage-clamp mode. AmidemH (dye 35), an amide-substituted BODIPY VF, shows a voltage sensitivity 10 times greater than carboxymH (dye 28), displaying a fractional sensitivity of 48% ΔF/F per 100 mV in HEK cells compared to 4.4% for dye 28 (Figures 12c and d ). The method involved synthesizing BODIPY-based voltage-sensitive fluorophores and localizing them to the target membrane. Under epifluorescence microscopy, whole-cell voltage-clamp techniques were utilized to maintain the membrane potential within the desired range while recording the dye fluorescence intensity.
(a) Dipyrromethene boron difluoride (BODIPY) fluorophores, (b) fluorescence images of amidemH, (c) and (d) Plots show ΔF/F in HEK cells: AmidemH (dye 35) has 10x higher voltage sensitivity than carboxymH (dye 28), with 48% versus 4.4% ΔF/F per 100 mV. (Adapted from reference (Franke et al., Reference Franke, Raliski, Boggess, Natesan, Koretsky, Zhang, Kulkarni, Deal and Miller2019)).

QD probes
QDs and quantum rods (QRs) are nanoscale semiconductor particles made of materials like CdSe, CdS, InP, or PbS, belonging to II–VI, III–V, or IV–VI categories (Aalinkeel et al., Reference Aalinkeel, Nair, Reynolds, Sykes, Law, Mahajan, Prasad and Schwartz2012; Yong et al., Reference Yong, Hu, Roy, Ding, Vathy, Bergey, Mizuma, Maitra and Prasad2009). QDs exhibit unique quantum properties due to electron confinement, following quantum physics laws. CdSe QDs, for instance, emit light with wavelengths from 400 to 650 nm, determined by nanocrystal size from 2 to 7 nm (Caglar et al., Reference Caglar, Pandya, Xiao, Foster, Divitini, Chen, Greenham, Franze, Rao and Keyser2019; Efros et al., Reference Efros, Delehanty, Huston, Medintz, Barbic and Harris2018). Quantum confinement in three dimensions governs their photophysical features, including fluorescence wavelength. QDs can modulate photoluminescence (PL) intensity through FRET or ET, often alongside membrane potential monitoring methods. Although QDs have been used as FRET donors with organic dyes as acceptors, their FRET efficiency is usually lower compared to organic dye-based FRET due to distance dependency (Figure 13a ; Mohamed et al., Reference Mohamed, Abd El-Gawad, Mekkey, Galal, Handal, Mousa and Labib2021; Semonin et al., Reference Semonin, Luther and Beard2012). QDs offer advantages for FRET applications, including avoiding excitation cross-talk, longer fluorescence lifetimes, and large two-photon action cross-sections (Grazon et al., Reference Grazon, Chern, Lally, Baer, Fan, Lecommandoux, Klapperich, Dennis, Galagan and Grinstaff2022; Shamirian et al., Reference Shamirian, Ghai and Snee2015). However, FP or organic dyes are generally preferred. As voltage sensors, QDs boast photostability, tunable PL color, broad absorption spectra, high quantum yields, low cytotoxicity, and multiplexing capabilities (Caglar et al., Reference Caglar, Pandya, Xiao, Foster, Divitini, Chen, Greenham, Franze, Rao and Keyser2019; Chern et al., Reference Chern, Kays, Bhuckory and Dennis2019). Yet, challenges like toxicity, blinking, photobleaching, size, charge impacts, complexity, and cost need addressing for their full potential in membrane potential assessment (Shapira et al., Reference Shapira, Degani-Katzav, Yudovich, Grupi and Weiss2021). QDs, comparable in size to cell membranes, possess tunable properties sensitive to external electromagnetic fields. Changes in membrane potential of 100 mV create intense electric fields, affecting charge carriers in QDs and altering their properties. Proximity to the cell membrane enhances sensitivity to potential changes. Specialized coatings enable precise tuning of quantum dot properties for converting electric field alterations into optical signals (Efros et al., Reference Efros, Delehanty, Huston, Medintz, Barbic and Harris2018). A method using QDs to measure membrane potential involves coating the dots for sensitivity to electric fields, incubating them with cells, and inducing potential changes. Fluorescence response of the dots correlates with changes, showing a 0.5% intensity change per 1 mV shift. This approach aligns with electrophysiological recordings using patch clamping, validating its sensitivity (Figure 13b ) (Caglar et al., Reference Caglar, Pandya, Xiao, Foster, Divitini, Chen, Greenham, Franze, Rao and Keyser2019; G Chen et al., Reference Chen, Zhang, Peng, Huang, Li and Wang2019b; Efros et al., Reference Efros, Delehanty, Huston, Medintz, Barbic and Harris2018; Roy et al., Reference Roy, Shapira and Weiss2022).
(a) and (b) Describe the mechanism and method of using Quantum Dots (QDs) to measure membrane potential. (c) and (d) Illustrate how CdSe@ZnS-GSH QDs function as fluorescent emitters, while (e) explains the use of CdSe@ZnS-GSH QDs/DPA for detecting cell membrane potential (Adapted from reference (G Chen et al., Reference Chen, Zhang, Peng, Huang, Li and Wang2019b)).

In 2019, Chen et al., (G Chen et al., Reference Chen, Zhang, Peng, Huang, Li and Wang2019b) introduced glutathione-coated CdSe@ZnS QDs, paired with dipicrylamine (DPA) to create a two-component voltage sensor, providing an effective method for detecting membrane potentials, particularly valuable for researching neuronal circuits (Figures 13c and d ). CdSe@ZnS-GSH QDs act as fluorescent emitters, while DPA acts as an acceptor, enabling FRET in response to membrane potential changes. Patch clamp tests confirmed changes in fluorescence intensity, validating the utility of this approach for detecting cell membrane potential. The observed variations in fluorescence intensity in target cells in relation to membrane potential affirm the utility of the CdSe@ZnS-GSH QDs/DPA approach for detecting cell membrane potential. The Fluorescence images of neurons co-labeled by CdSe@ZnS-GSH QDs and DiD are also shown in Figure 13e .
Briefly, slow dyes, with a net charge, cross cell membranes and rearrange based on cytoplasmic charge, showing significant fluorescence changes in response to electric fields, making them ideal for long-term monitoring. In contrast, fast dyes rely on electrochromism for rapid ET and fluorescence shifts, making them suitable for observing quick cellular events (Wang et al., Reference Wang, Bou, Klymchenko, Anton and Collot2021; Yamada et al., Reference Yamada, Gaja, Ohya, Muraki, Narita, Ohwada and Imaizumi2001; Yu et al., Reference Yu, Wang and Nie2021). Table 1 provides a comprehensive overview of various dyes, including electrochromic dyes, GEVIs, genetically encoded calcium indicators (GECIs), QD, and BODIPY, detailing their classifications, response times, and other characteristics. The broad scope of Table 1 ensures a detailed comparison across these categories to guide dye selection for specific applications.
Summary of slow dyes and fast dye

Note: The sensitivity mentioned in the table is the highest reported in the articles. The response time and sensitivity of BODIPY and quantum dots (QDs) are based on the reported articles, which led us to categorize them as fast dyes.
fs, Femtosecond; ps, Picosecond.
Imaging technique for measuring the membrane potential
This section explores various imaging techniques employed to measure membrane potential, each offering unique strengths and applications. Alongside fluorescent microscopy, advanced methods like PAI and SHG provide alternative approaches. PAI combines optical and ultrasound imaging to detect membrane potential changes with high spatial resolution and deep tissue penetration (Lin and Wang Reference Lin and Wang2021), while SHG utilizes nonlinear optical properties to image membrane potential without the need for exogenous dyes, offering a label-free, high-contrast imaging option (Chen et al., Reference Chen, Hu, Kong and Mao2021; Peterka et al., Reference Peterka, Takahashi and Yuste2011). Together, these techniques enhance our ability to accurately measure and visualize membrane potential in complex biological systems.
Fluorescent microscopy
Fluorescence microscopy provides high spatial resolution for measuring membrane potential at the single-cell or subcellular level, making it ideal for capturing dynamic changes over time. It is particularly useful for imaging membrane potential using VSD, such as DiSC₃(5), but its application in Gram-negative bacteria is complicated by the extra membrane layer. Despite its effectiveness in qualitative and quantitative analysis, fluorescent microscopy faces challenges such as susceptibility to artifacts from cell shape or environmental factors, difficulties in achieving accurate quantification, and a complex, time-consuming process. Additionally, it is less suited for high-throughput analysis (Bradley et al., Reference Bradley, Luo, Otis and DA2009). To address these challenges, advanced techniques with improved spatial resolution have been developed for more accurate membrane potential measurements using voltage indicator dyes. In 2022, Buttress et al., demonstrated that fluorescent microscopy with DiSC₃(5) effectively tracks membrane potential changes in bacteria. The study found that E. coli cells in PBS with glucose exhibited higher and more heterogeneous DiSC₃(5) signals than those in LB, with fluorescence decreasing in the absence of glucose, indicating reduced membrane potential (Figures 14a and b ). Additionally, E. coli cells in PBS with a carbon source and CaCl₂ gradually lost membrane potential over time, as shown by declining DiSC₃(5) fluorescence(Buttress et al., Reference Buttress, Halte, Te Winkel, Erhardt, Popp and Strahl2022).
(a & b) PBS with glucose increased DiSC₃(5) signals, while glucose absence reduced fluorescence, indicating lower membrane potential(Adapted from reference(Buttress et al., Reference Buttress, Halte, Te Winkel, Erhardt, Popp and Strahl2022)), (c) DiBAC4(3) fluorescence in Na-buffer showed quenching above 6.25 μM, peaking at 9 μM, (d) with green and red emissions from 1.6 μM. Depolarized IGR1 cells in K-buffer at 4,800 nM showed a higher membrane potential (e), with slight repolarization at 25 and 1,600 nM (f) (Adapted from reference (Klapperstück et al., Reference Klapperstück, Glanz, Klapperstück and Wohlrab2009)).

Flow cytometry
Fluorescence microscopy offers high spatial resolution for detailed, real-time membrane potential observations, while flow cytometry enables high-throughput analysis of large cell populations but lacks spatial and temporal resolution (Shapiro Reference Shapiro2000). Flow cytometry is a valuable tool for assessing membrane potential across diverse cellular populations, complementing other techniques in cellular electrophysiology. However, it has limitations in detecting rapid membrane potential changes (seconds or less) and may lack accuracy and precision in its measurements (Klapperstück et al., Reference Klapperstück, Glanz, Klapperstück and Wohlrab2009; Shapiro Reference Shapiro2000). In 2009, Klapperstück (Klapperstück et al., Reference Klapperstück, Glanz, Klapperstück and Wohlrab2009)et al., used flow cytometry to measure membrane potential in IGR1 melanoma cells with the DiBAC4(3) dye. The study found that fluorescence peaked at 9 μM in Na-buffer (Figure 14c ) and emitted green–red fluorescence from 1.6 μM (Figure 14d ). Depolarized cells in K-buffer showed higher membrane potential (Figure 14e ), with slight repolarization observed over time at lower concentrations (Figure 14f ). The results indicated that fluorescence intensity is influenced by protein content and fixation, and is linearly related to dye concentration below 100 nM (Klapperstück et al., Reference Klapperstück, Glanz, Klapperstück and Wohlrab2009).
Volumetric voltage imaging
Light-sheet microscopy (LSM) and light-field microscopy (LFM) are both techniques within the realm of volumetric voltage imaging. These methods are designed for high-speed, three-dimensional imaging, utilizing specialized illumination strategies. LSM and LFM offer advanced spatial imaging capabilities that enable the capture of dynamic voltage signals across 3D volumes. Together, they represent cutting-edge tools for real-time, volumetric voltage imaging in fields such as neuroscience, cardiology, and other areas (Chatterjee et al., Reference Chatterjee, Pratiwi, Wu, Chen and Chen2018; Poola et al., Reference Poola, Afzal, Yoo, Kim and Chung2019). LSM is an advanced imaging technique that uses a thin sheet of light to illuminate only the focal plane of a sample, minimizing phototoxicity and photobleaching. By capturing images from an orthogonal axis, LSM creates high-resolution 3D or 4D datasets through volumetric scanning. It is ideal for live imaging of biological processes like membrane potential dynamics and neuronal activity, offering speed and precision. Enhanced techniques such as lattice LSM (LLSM) further improve imaging by using optical lattices for uniform illumination and subcellular resolution. LLSM captures rapid dynamics, such as voltage and calcium fluctuations, with lateral and axial resolutions of 250 nm and 500 nm, respectively, and millisecond acquisition speeds. LSM is particularly valuable for obtaining confocal sections needed in voltage-sensitive dye imaging, supporting long integration times, and efficient monitoring of cardiac and neuronal activities (C-Y Chen et al., Reference Chen, Liu, Lu, Lee, Tsai, Wu, Chen and Chen2019a; Hillman et al., Reference Hillman, Voleti, Li and Yu2019).
LFM captures volumetric data in a single shot by recording light’s spatial and directional properties, enabling rapid imaging of voltage dynamics in tissues and large neuronal networks. While it sacrifices some spatial resolution compared to LSM, LFM is ideal for high-speed applications like large-scale calcium and voltage imaging in neurons. Although it experiences fluorescence background noise, confocal LFM mitigates this by enhancing signal collection within adjustable axial ranges, improving throughput. Technical challenges still limit its full potential for high-throughput voltage imaging(Wang et al., Reference Wang, Zhu, Xu and Zhang2022).
In 2021, Sacconii et al., presented zebrafish as a valuable cardiac model due to their heart’s voltage transients mimicking those of humans and their small size allowing full heart imaging. Traditional techniques, however, lacked millisecond resolution. To address this, they developed SPEED microscopy with parallel light sheets and separate cameras for real-time data capture. Enhanced by deconvolution algorithms, the system achieves high acquisition rates while preserving signal quality, resolution, and dynamic range. Explanted zebrafish hearts, stained with a voltage-sensitive dye, were imaged at 500 frames/s across seven 400 × 400 pixel planes (Figure 15a and b) shows APs from atrial (blue), ventricular (red), and atrioventricular (AV) canal (green) regions, with deconvolution clarifying the AV signal despite some signal quality loss. Figure 15c illustrates backpropagation of ventricular early after depolarizations (EADs) triggering atrial activation, though some EADs did not show backpropagation (Sacconi et al., Reference Sacconi, Silvestri, Rodríguez, Armstrong, Pavone, Shrier and Bub2022).
(a) Orientation of the sample relative to the seven light sheets in light sheet microscopy, (b) Action potentials from atrial, ventricular, and AV canal tissues, with deconvolution enhancing AV signal clarity at the cost of signal smoothness, (c) Backpropagation of ventricular EADs activating atrial tissue, with some EADs failing to propagate((Adapted from reference(Sacconi et al., Reference Sacconi, Silvestri, Rodríguez, Armstrong, Pavone, Shrier and Bub2022)), (d) LLSM setup with perpendicular objectives and a 3D culture sample in a temperature-controlled chamber, (e) 3D mapping of voltage responses on hippocampal neuron membranes using LLSM, (f) Different angular views of hippocampal neurons showing 3D neurite outgrowth, (g) LLSM recorded 3D voltage responses of hippocampal neurons, with higher initial fluorescence in the soma than neurites, (h) After KCl stimulation, three out of five neurites showed increased fluorescence intensity ((Adapted from reference(C-Y Chen et al., Reference Chen, Liu, Lu, Lee, Tsai, Wu, Chen and Chen2019a)), (i) Single scanner with a two-sided mirror reduces distortions and noise in light field microscopy, (j) Confocal detection enhanced SBR by 2.4-fold across 987 neurons, reducing background noise, (k) Confocal LFM captured 10,000 neurons/mm3 at depths of 30–210 μm for fluorescence trace extraction, (l) 28% of 330 spiking neurons were visually responsive, preferring vertical and nasal direction gratings(Adapted from reference(Bai et al., Reference Bai, Cong, Shi, Zhao, Zhang, Lu, Zhang, Xiong, Xu and Mu2024)).

(a) Voltage tests show a linear response from −100 mV to +100 mV at 730 nm and weak sensitivity at 570 nm, (b) ElectroFluor730p demonstrated enhanced staining and durability in cardiac imaging, (c) ElectroFluor730p exhibited superior AP sensitivity with an isosbestic point at 571 nm, (d) Excitation and emission spectra of ElectroFluor730p compared with hR2 excitation spectrum(Adapted from reference(Yan et al., Reference Yan, Acker, Biasci, Judge, Monroe, Sacconi and Loew2023)), (e) Neurons loaded with CaSiR-1 via whole-cell recording pipettes, (f) Current injections triggered action potentials, shown as fluorescence changes, (g) Fluorescence amplitude tracked action potential frequency, (h) CaSiR-1 allowed multicolor Ca2+ imaging, distinguishing neuronal and astroglial activity(Adapted from reference (Egawa et al., Reference Egawa, Hanaoka, Koide, Ujita, Takahashi, Ikegaya, Matsuki, Terai, Ueno and Komatsu2011)).

2D neuron cultures are used to study neurodegenerative diseases, but 3D neuronal activity monitoring is challenging due to light penetration and imaging speed. LLSM enables high-speed volumetric imaging with reduced photobleaching and better resolution. In 2019, Chen et al., used di-4-ANEPPS, a voltage-sensitive dye, to monitor membrane potential in 3D hippocampal neurons The LLSM setup employed perpendicular excitation and detection objectives with a temperature-controlled chamber (Figure 15d ). LLSM’s setup with perpendicular excitation and detection objectives allows mapping of 3D voltage responses, revealing 3D neurite outgrowth (Figure 15e and f ). LLSM showed faster fluorescence increases in the soma than in neurites (Figure 15g ), with increased intensity in three out of five neurites post-stimulation (Figure 15h ; (C-Y Chen et al., Reference Chen, Liu, Lu, Lee, Tsai, Wu, Chen and Chen2019a).
Bai et al., (Reference Bai, Cong, Shi, Zhao, Zhang, Lu, Zhang, Xiong, Xu and Mu2024) developed a confocal LFM system for high-speed 3D neuronal imaging with minimal noise. It imaged 1,000 neurons in the mouse visual cortex, with 300 showing sufficient signals for spiking analysis. Figure 15i shows the use of a single scanner with a two-sided mirror to reduce distortions at high scanning speeds. The system improved signal-to-background ratio (Figure 15j ) and signal-to-noise ratio (SNR), enabling deeper, denser neuronal imaging (Figure 15k ). In awake mice, 28% of spiking neurons showed distinct visual preferences (Figure 15l ). While speed is limited by camera bandwidth, future advancements could enable large-scale in vivo voltage recording across larger populations(Bai et al., Reference Bai, Cong, Shi, Zhao, Zhang, Lu, Zhang, Xiong, Xu and Mu2024).
Multimodal imaging
Multimodal imaging combines techniques like fluorescence, electrophysiology, and optical imaging to monitor membrane potential and cellular activity. In cardiac research, fluorescence imaging simultaneously tracks parameters like transmembrane potential (
 $ {V}_m $
) and intracellular calcium concentration [Ca2+], providing insights into heart dynamics. Recent advancements focus on combining IR dyes with calcium sensors and optogenetics. IR dyes offer better tissue penetration, reduced scattering, and improved sensitivity, making them ideal for deep-tissue imaging. When paired with calcium sensors, they provide real-time, comprehensive views of both anatomical and functional changes (Egawa et al., Reference Egawa, Hanaoka, Koide, Ujita, Takahashi, Ikegaya, Matsuki, Terai, Ueno and Komatsu2011; Holcomb et al., Reference Holcomb, Woods, Uzelac, Wikswo, Gilligan and Sidorov2009; Martí-Bonmatí et al., Reference Martí-Bonmatí, Sopena, Bartumeus and Sopena2010).
Far-red and NIR dyes offer advantages over traditional UV–visible probes, although challenges remain in improving signal clarity and reducing background fluorescence. Optogenetics, using light-sensitive ion channels, allows precise control of neural and cardiac activity. Integrating optogenetics with IR dyes and calcium sensors enables real-time manipulation and monitoring of cellular activity, enhancing understanding of complex biological systems (Marchal et al., Reference Marchal, Biasci, Yan, Palandri, Campione, Cerbai, Loew and Sacconi2023; Z Wang et al., Reference Wang, Hu, Ai, Zhang and Xing2019c).
Despite challenges in sensor sensitivity and kinetics, the combination of IR dyes, calcium sensors, and optogenetics holds great potential for advancing in vivo imaging and real-time control in both neuroscience and cardiac research(Holcomb et al., Reference Holcomb, Woods, Uzelac, Wikswo, Gilligan and Sidorov2009; Lee et al., Reference Lee, Jeon, Jung, Chung and Ahn2014). In 2023, Yan et al., developed red-shifted hemicyanine VSDs with improved sensitivity (~100 nm) compared to earlier dyes. ElectroFluor730p, with high voltage sensitivity and fluorescence efficiency, enabled imaging of optogenetically driven cardiac activity in a mouse heart (730 nm excitation). Dye 2a showed a > 100-fold fluorescence increase upon membrane binding and a 125 nm Stokes shift (Figure 16a). ElectroFluor730p demonstrated superior staining in cardiac applications, recording action potential (AP) waves (Figure 16b), with a linear voltage response from −100 mV to +100 mV. Tests identified an isosbestic point at 571 nm for dual-wavelength imaging (Figure 16c), and minimal crosstalk with ChR2 allowed simultaneous optical pacing and recording (Figure 16d). These red-shifted dyes show potential for advanced bioimaging (Yan et al., Reference Yan, Acker, Biasci, Judge, Monroe, Sacconi and Loew2023).
Egawa et al., (Reference Egawa, Hanaoka, Koide, Ujita, Takahashi, Ikegaya, Matsuki, Terai, Ueno and Komatsu2011) developed CaSiR-1, a far-red to near-infrared (NIR) probe for enhanced neuronal imaging. Combining SiR and BAPTA, offers better tissue penetration, reduced autofluorescence, and lower phototoxicity. CaSiR-1 visualized Ca2+ dynamics in neurons, with fluorescence changes correlating to action potential frequency (Figure 16e and f) and numbers (Figure 16g). It also enabled multicolor imaging in brain slices, separating signals from GFP and SR101 (Figure 16h; Egawa et al., Reference Egawa, Hanaoka, Koide, Ujita, Takahashi, Ikegaya, Matsuki, Terai, Ueno and Komatsu2011).
Photoacoustic imaging
Photoacoustic (PA) imaging utilizes short bursts of light to induce thermal expansion in materials or tissues, generating megahertz ultrasound waves (Figure 17a ; Zhang et al., Reference Zhang, Yan, Kang, Abou, Le, Jha, Thorek, Kang, Rahmim and Wong2017). This emerging hybrid imaging technique overcomes limitations of optical methods, such as limited penetration depth due to light scattering. By employing longer wavelengths, PA imaging enhances tissue penetration depth while maintaining high spatial resolution, making it valuable for monitoring brain activity and imaging nerves, veins, and arteries (Beard Reference Beard2011; Yao and Wang Reference Yao and Wang2011). It has applications in cancer imaging and wound healing processes. PA imaging is safer and less invasive due to the absence of nonionizing electromagnetic waves. It encompasses photoacoustic tomography (PAT) and photoacoustic microscopy (PAM) (Barbosa and Mendes Reference Barbosa and Mendes2022). The mechanism involves the excitation of localized VSD in cell membranes by infrared laser light, leading to thermal expansion and generation of ultrasonic waves sensed by external ultrasonic transducers (Barbosa and Mendes Reference Barbosa and Mendes2022; Galisteo-González et al., Reference Galisteo-González, Monasterio, Gil, Valle and Goñi2020).
(a) Photoacoustic (PA) imaging, (b) The engineered cyanine dye PAVSD800–2 responds to membrane potential changes via PA imaging, (c) PA images at 800 nm with a 22.72% signal change, in contrast, affected by valinomycin and gramicidin (Adapted from reference (Zhang et al., Reference Zhang, Yan, Kang, Abou, Le, Jha, Thorek, Kang, Rahmim and Wong2017)). (d) in vivo mouse brain responses with M-mode imaging, (e) Photoacoustic signal in HEK-293 cells, (f) Photoacoustic signal change versus membrane voltage in HEK-293 cells through ex vivo brain tissue (Adapted from reference (Rao et al., Reference Rao, Zhang, Li, Shao and Wang2017)).

In 2017, Zhang et al., (Zhang et al., Reference Zhang, Yan, Kang, Abou, Le, Jha, Thorek, Kang, Rahmim and Wong2017) pioneered the development of the initial iteration of PA-VSDs, utilizing NIR excitation and emission bands to monitor membrane potential fluctuations of the brain. They engineered a cyanine dye, PAVSD800–2, tailored specifically for PA-VSD applications, wherein alterations in PA intensity corresponded to shifts in membrane potential. The cyanine dye redistribution via voltage-dependent mechanisms across cell membranes, albeit slower on the order of seconds, limiting its utility for capturing fast neuronal APs or synaptic events. Despite this, the integration of proposed VSD technology with PA imaging offers the potential for deep monitoring of brain activity patterns on submillimeter spatial scales and second timescales. Subsequently, the synthesized PAVSD800–2 was targeted within lipid vesicles, inducing changes in vesicular membrane potential via ion transportation facilitated by gramicidin and valinomycin ionophores for testing the performance of the PA-VSD and measuring both the PA and spectrophoto/fluorometric response. At higher concentrations, the cyanine dye can aggregate within polarized cells, rendering it nonfluorescent. During cellular depolarization, dye molecules disperse into the larger extracellular volume, transitioning into fluorescent monomers. This redistribution across cell membranes occurs gradually over seconds, releasing heat and generating the PA signal (Figure 17b ). PA images at 800 nm showed a 22.72% signal change. The contrast increased with valinomycin but returned to normal with gramicidin (Figure 17c ). PAT as one of the subsets of the PA imaging is a hybrid optical imaging method that used for sectional imaging of the hemoglobin, human breast, microvasculature, melanin, etc.
In 2017, Rao et al., (Rao et al., Reference Rao, Zhang, Li, Shao and Wang2017) presented the initial demonstration of photoacoustic voltage response imaging, conducted on both in vitro HEK-293 cell cultures and in vivo mouse brain surfaces. They utilized hydrophobic anions such as DPA (dipicrylamine) and sodium tetraphenylborate (TphB), which adhere strongly to plasma membranes through well-understood adsorption mechanisms. DPA, known for inducing voltage-dependent membrane capacitance, they investigated as a potential voltage sensor for PAT, exhibiting significant signal changes in response to membrane potential alterations. Using a reflection-mode optical-resolution photoacoustic microscope, they recorded in vivo mouse brain responses at a minimally vascular point before and during electrical stimulation, with the M-mode imaging location marked by a yellow cross in the depth-coded image of the DPA-stained cranial window (Figure 17d ). A greater alteration in membrane potential resulted in a more pronounced change in the photoacoustic signal. The fractional photoacoustic signal recorded in HEK-293 cells showed a shift of about 40% per 100 mV for changes in RMP (Figure 17e ). Despite its slow response characteristics, voltage responses were observed in live mouse brains using DPA dye. Additionally, fractional changes in photoacoustic amplitude recorded in the membrane potential of HEK-293 cell clusters within thick rat brain tissue were approximately 60% per 100 mV of cell membrane voltage (Figure 17f ). Spectrophotometric and photoacoustic experiments confirmed that the observed voltage sensitivity stemmed from the voltage-dependent redistribution of DPA molecules within the lipid membrane, providing insights into the mechanism underlying photoacoustic signal changes in response to shifts in membrane voltage.
Second harmonic generation
In the mid-1980s, a pivotal discovery was made by researchers regarding ANEP chromophores. These chromophores exhibit a significant charge redistribution when they absorb photons, leading to their electrochromic nature (Chen et al., Reference Chen, Hu, Kong and Mao2021; Pantazis et al., Reference Pantazis, Maloney, Wu and Fraser2010). This unique property not only makes them valuable for monitoring membrane potential changes in cells but also positions them as promising candidates for SHG applications. SHG microscopy with hyperpolarizable amphiphilic dyes offers higher sensitivity for imaging membrane potential than electrochromic fluorescence methods (Campagnola and Loew Reference Campagnola and Loew2003; Mendes et al., Reference Mendes, Thirupathi, Zaccaron, Corrêa, Bittencourt, Casagrande, de Lima, de Oliveira, de Andrade and Gu2022). SHG is a nonlinear optical process that converts two incoming photons into a single outgoing photon with twice the energy (Figure 18a ) (Sacconi et al., Reference Sacconi, D’Amico, Vanzi, Biagiotti, Antolini, Olivotto and Pavone2005). This process is prompt and efficient and is highly responsive to alterations in membrane potential, potentially offering greater sensitivity than the typical 10% fluorescence change per 100 mV making it a useful tool in membrane potential imaging (Sacconi et al., Reference Sacconi, D’Amico, Vanzi, Biagiotti, Antolini, Olivotto and Pavone2005). This phenomenon arises when an ultrafast NIR laser is focused on a sample. The strength of the SHG signal depends on the molecular hyperpolarizability of the molecules interacting with the intense laser field. For measuring membrane potential using an SHG microscopy, Stain the cells with electrochromic membrane-staining probes, such as styryl or naphthyl styryl dyes, that produce SHG signals sensitive to voltage changes (Millard et al., Reference Millard, Jin, Wuskell, Lewis and Loew2004). A two-photon excitation microscope is then used to capture the SHG signals from the stained cell membranes. Patch-clamp electrophysiology measurements are performed on the cells to directly record the membrane potential changes. The SHG signals from the same cells are simultaneously imaged and correlated with the measured membrane potential changes (Sacconi et al., Reference Sacconi, Dombeck and Webb2006; Theer et al., Reference Theer, Denk, Sheves, Lewis and Detwiler2011; Wilson et al., Reference Wilson, Millard, Lewis and Loew2014).
(a) Second harmonic generation (SHG) mechanism, (b) SHG imaging effectively detects transmembrane potential changes, (c) Sensitivity to
 $ {V}_m $
in HEK293/Balb/c3T3 (normal cells) and SY5Y/SV3T3 (neuroblastoma cells) varies. (Adapted from reference (Sacconi et al., Reference Sacconi, D’Amico, Vanzi, Biagiotti, Antolini, Olivotto and Pavone2005)). (d) Asynchronous Ca2+ release observed in T-tubules using voltage-sensitive dyes and FluoForte imaging, (e) Detection of spontaneous depolarizations in T-tubules through advanced imaging techniques.(Adapted from reference(Crocini et al., Reference Crocini, Coppini, Ferrantini, Yan, Loew, Tesi, Cerbai, Poggesi, Pavone and Sacconi2014)), (f) Optical setup combines GPC and CGH excitation paths for scanless voltage imaging with high resolution, (g) spontaneous neuronal activity in hippocampal slices, including depolarizations, AP bursts, and sub-threshold changes, (h) neurons co-expressing ChroME-ST and JEDI-2P-Kv in hippocampal slices, identified by membrane and nuclear labeling (Adapted from reference(Sims et al., Reference Sims, Bendifallah, Grimm, Lafirdeen, Domínguez, Chan, Lu, Forget, St-Pierre and Papagiakoumou2024).

SHG-based Membrane Potential Imaging offers noninvasive, high-resolution monitoring of membrane potential dynamics in excitable cells like neurons. Advantages include linear sensitivity to membrane potential, simultaneous imaging of SHG and fluorescence signals, and reduced photodamage, but limitations arise for in vivo imaging due to challenges in forward propagating emission (Aghigh et al., Reference Aghigh, Bancelin, Rivard, Pinsard, Ibrahim and Légaré2023; Mizuguchi and Nuriya Reference Mizuguchi and Nuriya2020). Sacconi et al., (Sacconi et al., Reference Sacconi, D’Amico, Vanzi, Biagiotti, Antolini, Olivotto and Pavone2005) used RH 237 dye to explore SHG signal responses to electrical potential changes across cell types. Their study revealed distinct SHG sensitivity to
 $ {V}_m $
, especially heightened in transformed cells. This highlights SHG’s potential in studying cell electrical activity and membrane features, including those affected by neoplastic transformation. To study changes in membrane potential, cells were selected based on morphology, patch-clamped at resting potential (
 $ {V}_{rest} $
), then subjected to laser excitation and SHG imaging, alternating between
 $ {V}_{rest} $
and
 $ {V}_{rest} $
± Δ
 $ {V}_m $
to detect SHG signals from membrane dye molecules. They showed SHG imaging’s effectiveness in detecting transmembrane potential changes, with significant variability observed among different cell types (Figure 18b
). Examining SHG sensitivity to
 $ {V}_m $
in HEK293/Balb/c3T3 (normal cells) and SY5Y/SV3T3 (neuroblastoma cells) revealed varying sensitivities (Figure 18c
).
Two-photon microscopy
Nonlinear excitation, including 2 PM, has revolutionized fluorescent imaging by enabling the simultaneous excitation of multiple fluorophores using a single excitation wavelength. Unlike traditional fluorescence microscopy, which relies on a single high-energy photon for fluorophore excitation, 2 PM utilizes two lower-energy photons that collide simultaneously with the fluorophore, triggering fluorescence. This technique offers significant advantages over single-photon microscopy, especially for imaging thicker tissues or deeper layers that conventional methods cannot reach. The use of NIR light allows for greater tissue penetration, reduces scattering and absorption, and minimizes photodamage, enabling high-quality imaging of live biological samples with minimal disruption. These features make TPM ideal for deep-tissue imaging, providing safe and effective visualization of complex biological processes in vivo.(Denk et al., Reference Denk, Strickler and Webb1990; Helmchen and Denk Reference Helmchen and Denk2005; So et al., Reference So, Dong, Masters and Berland2000).
2 PM offers significant advantages for imaging thick tissues and complex biological structures. It confines fluorescence to the laser’s focal point, enabling optical sectioning, efficient photon collection, and reduced photodamage. The use of high-intensity lasers ensures localized excitation, improving image resolution, while NIR light reduces scattering, allowing for deeper tissue penetration and better imaging quality. Additionally, 2 PM enables simultaneous excitation of multiple dyes, even with overlapping absorption spectra, allowing dual-label imaging with minimal cross-talk. This capability is particularly useful for studying dynamic biological processes in living systems, eliminating the need for sequential imaging and improving efficiency. 2 PM has broad applications in developmental biology, neuroscience, and cancer research, providing high-resolution visualization of live cells and tissues (Guo and Wong Reference Guo and Wong2014). 2 PM is a powerful imaging technique that uses NIR light for deep tissue visualization with minimal photodamage. By exciting fluorophores with two lower-energy photons, TPM enables high-resolution, three-dimensional imaging of complex biological structures. It supports dual-label imaging of multiple fluorophores and reduces scattering, making it ideal for studying living tissues and whole organisms. Complemented by SHG for label-free imaging of structural components like collagen, TPM is widely used in developmental biology, neuroscience, and cancer research, offering detailed insights into cellular dynamics, tissue architecture, and disease mechanisms (Diaspro Reference Diaspro2001; Parodi et al., Reference Parodi, Jacchetti, Osellame, Cerullo, Polli and Raimondi2020).
In heart failure, TATS remodeling disrupts Ca2+ release and action potential propagation, leading to weakened contraction and irregularities. Advanced imaging reveals AP failures and spontaneous depolarizations in TATS. Crocini et al. (Reference Crocini, Coppini, Ferrantini, Yan, Loew, Tesi, Cerbai, Poggesi, Pavone and Sacconi2014) developed a method to simultaneously measure Ca2+ transients and APs in tubular elements, revealing the link between TATS electrical activity and Ca2+ release in heart failure. In heart failure, TATS remodeling disrupts AP propagation and Ca2+ release, leading to irregular contractions. Advanced imaging with VSD and FluoForte reveals this disruption, showing asynchronous Ca2+ release and spontaneous depolarizations in TTs (Figure 18d and e ). These imaging techniques help study the link between TATS electrical activity and Ca2+ dynamics in heart failure (Crocini et al., Reference Crocini, Coppini, Ferrantini, Yan, Loew, Tesi, Cerbai, Poggesi, Pavone and Sacconi2014).
Fluorescent calcium indicators (GECIs) are useful for tracking neural activity but struggle with high-frequency APs and sub-threshold changes. GEVIs address these issues but require faster imaging. While multi-photon (2P) microscopy offers enhanced resolution, it faces imaging rate limitations, which are mitigated by advanced techniques like acousto-optic holography. Sims et al., (Reference Sims, Bendifallah, Grimm, Lafirdeen, Domínguez, Chan, Lu, Forget, St-Pierre and Papagiakoumou2024) demonstrate scanless two-photon voltage imaging with high-frequency spike recordings and simultaneous voltage imaging and photostimulation in vivo. The optical setup combines two excitation paths: one for generating GPC patterns and another for CGH (Figure 18f ), achieving lateral and axial FWHM of 12 μm and ~ 9 μm, respectively. The system uses an sCMOS camera with 3.7 μm resolution and spatial light modulators for scanless voltage imaging within a 300 × 300 μm2 field. Three protocols were tested, with 2P-TF-CGH yielding the highest signal-to-noise ratio (SNR) and minimal power use, making it the optimal method. Figure 18g shows spontaneous neuronal activity in hippocampal slices, including slow depolarizations, AP bursts, and rhythmic sub-threshold changes. Figure 18h displays neurons co-expressing ChroME-ST (with nuclear BFP) and JEDI-2P-Kv in hippocampal slices, identified by membrane JEDI-2P-Kv and BFP-positive nuclei(Sims et al., Reference Sims, Bendifallah, Grimm, Lafirdeen, Domínguez, Chan, Lu, Forget, St-Pierre and Papagiakoumou2024).
SHG microscopy enhances sensitivity and contrast through molecular electro-optic responses and membrane alignment dynamics. Near-resonance excitation of styryl dyes increases hyperpolarizability and SHG efficiency by up to 100-fold. The signal is further amplified by coherent summation of SHG fields from aligned molecules, optimized beam focusing, and efficient phase matching. SHG microscopy uses hyperpolarizable amphiphilic dye molecules, sensitive to transmembrane fields through electro-optic hyperpolarizability and molecular tilt alterations, with frequency-dependent sensitivity modeled by a two-level perturbation (Moreaux et al., Reference Moreaux, Sandre, Blanchard-Desce and Mertz2000). This sensitivity is influenced by molecular properties such as the photoinduced charge shift (
 $ \Delta \mu $
) and the transition dipole moment (
 $ {\mu}_{eg} $
). The formula
 $$ k\approx \frac{2\Delta \mu }{\mathrm{\hslash}}\mathit{\operatorname{Re}}\left(\frac{1}{{\overset{\sim }{\omega}}_{eg}-2\omega}\right)+\hskip0.15em \frac{4}{\omega_{eg}}\left(1-\frac{{\left|{\mu}_{eg}\right|}^2}{\Delta {\mu}^2}\right) $$
Captures this frequency dependence, emphasizing the role of
 $ \Delta \mu $
in optimizing the sensitivity. Furthermore, molecular alignment within the membrane, quantified by the order parameter q, significantly enhances the SHG response. The SHG intensity’s sensitivity to field-induced molecular reorientation can be expressed as:

where R(E) is the relative SHG response, E is the transmembrane electric field, ҡ is the sensitivity constant, and q is the order parameter(Moreaux et al., Reference Moreaux, Pons, Dambrin, Blanchard-Desce and Mertz2003). Building upon this, the study by Mertz et al, highlights the complementary role of tilt-angle mechanisms in enhancing SHG responses. These mechanisms involve angular reorientations of chromophores in response to electric fields, characterized by a sensitivity parameter
 $ {\kappa}_a $
, and work in conjunction with the electro-optic mechanism (
 $ {\kappa}_b $
). The relative SHG change is then given by:
 $$ \frac{\varDelta {SHG}_i}{SHG_i}=\left({\kappa}_{\alpha }+{\kappa}_{\beta}\right){\mathrm{E}}_0 $$
where
 $ {\kappa}_{\alpha } $
and
 $ {\kappa}_{\beta } $
contribute additively and independently, ensuring linear response over a broad range of potentials.
The combination of these mechanisms’ frequency-sensitive electro-optic modulation, molecular alignment, and tilt-angle alterations not only ensures high sensitivity but also significantly enhances membrane contrast. Aligning the electro-optic and tilt-angle mechanisms to operate synergistically, as opposed to antagonistically, represents a powerful strategy for designing high-performance SHG membrane potential sensors with broad biological applications (Pons et al., Reference Pons, Moreaux, Mongin, Blanchard-Desce and Mertz2003).
Calibration methods
Accurate calibration is essential for ensuring reliable membrane potential measurements when using VSD. Calibration methods align the fluorescence signal with known membrane potentials, enabling precise quantification of cellular electrical activity. This section explores the key approaches for calibrating charged organic dyes and ionophore-based methods, highlighting their reliance on the Nernst equation to establish a correlation between fluorescence intensity and membrane potential. Additionally, it discusses the factors that can influence calibration accuracy, emphasizing the importance of tailoring the calibration process to specific experimental conditions (Nikolaev et al., Reference Nikolaev, Mironov, Shtyrov, Kvashnin, Mereshchenko, Vasin, Panov and Ryazantsev2023).
Calibration of charged organic dyes for membrane potential measurement
The calibration of charged organic dyes, such as DiBAC4(3) or di-4-ANEPPS, for measuring membrane potential involves several key steps. First, cells are completely depolarized to achieve a membrane potential of 0 mV, typically using ionophores. This step ensures that dye levels inside and outside the cells become balanced. Fluorescence intensity values are then plotted against corresponding dye concentrations to establish a calibration curve (Nikolaev et al., Reference Nikolaev, Mironov, Shtyrov, Kvashnin, Mereshchenko, Vasin, Panov and Ryazantsev2023; Yamada et al., Reference Yamada, Gaja, Ohya, Muraki, Narita, Ohwada and Imaizumi2001). This curve correlates the measured fluorescence signal strength with the dye concentration in the sample. The process involves measuring fluorescence across a range of known external dye concentrations in depolarized cells. The Nernst equation is used to determine the membrane potential by leveraging the ratio of intracellular to extracellular dye concentrations, which directly correlates with the measured fluorescence intensity levels (Figure 19a ) (Klapperstück et al., Reference Klapperstück, Glanz, Klapperstück and Wohlrab2009; Krasznai et al., Reference Krasznai, Márián, Balkay, Emri and Trón1995; Krasznai et al., Reference Krasznai, Márián, Izumi, Damjanovich, Balkay, Trón and Morisawa2000).
 $$ \hskip0.24em \mathrm{Nernst}\ \mathrm{equation}\hskip0.24em {V}_m=\frac{RT}{F}\;\mathit{\ln}\frac{\left[ Dye\;\right]\; out}{\left[ Dye\;\right]\; in} $$
Calibration of charged organic dyes (a) and Ionophore-based calibration (b) for measuring the membrane potential.

Ionophore-based calibration
Ionophore-based calibration is a precise method for quantifying specific ion levels inside cells by using ionophores, compounds that facilitate ion movement across cell membranes. For example, valinomycin transports potassium ions, and ionomycin transports calcium ions. Introducing an ionophore allows intracellular ion concentrations to equilibrate with extracellular levels. Researchers measure the fluorescence of an intracellular ion indicator dye at various controlled extracellular ion concentrations. This creates a calibration curve linking the fluorescence signal to the actual ion concentration, enabling accurate intracellular ion quantification.
The membrane potential, however, is not solely determined by a single ion species but by the cumulative effects of multiple ions, such as sodium (
 $ {Na}^{+} $
), potassium (
 $ {K}^{+} $
), and chloride (
 $ {Cl}^{-} $
), as described by the Goldman-Hodgkin-Katz (GHK) equation. The GHK equation accounts for ion permeability and concentration gradients, providing a more comprehensive understanding of membrane potential dynamics (Crespo et al., Reference Crespo, Cuartero and Bakker2015; Rong et al., Reference Rong, Kim, Poskanzer and Clark2017):
 $$ {V}_m=\frac{RT}{F}\;\mathit{\ln}\;\left(\;\frac{{\left[{K}^{+}\right]}_{out}+{\left[{Na}^{+}\right]}_{out}+{\left[{Cl}^{-}\right]}_{in}}{{\left[{K}^{+}\right]}_{in}+{\left[{Na}^{+}\right]}_{in}+{\left[{Cl}^{-}\right]}_{out}}\right) $$
In practice, cells are loaded with fluorescent VSD and fluorescence intensities are measured at various extracellular ion concentrations. These measurements are plotted against membrane potentials calculated using the GHK or Nernst equations to establish a relationship between fluorescence intensity and membrane potential. This approach enables noninvasive optical imaging of absolute membrane potentials across multiple cells simultaneously while accounting for the contributions of various ions. This refinement ensures a more accurate and physiologically relevant calibration process (Figure 19b ; Cuartero et al., Reference Cuartero, Crespo and Bakker2016; Novilla Reference Novilla2018).
Factors affecting Calibration
It is crucial to recognize that calibration needs to be tailored for each experimental setup, as variables like cell variety, sample preparation methods, and experimental parameters can influence the voltage-dependent behavior of the optical signal. Stringent control over environmental factors, encompassing temperature, pH levels, and ionic concentrations, is indispensable for attaining accurate calibration (Torralba et al., Reference Torralba, Palenciano, Reija, Rigla, Peñas, Llerena, Contreras-Martínez, Benlliure, Vega and Aguado-Barrera2022).
Conclusion
In conclusion, advancements in voltage indicators for measuring RMP and dynamic membrane potential fluctuations, such as depolarization and hyperpolarization, represent a transformative step in cellular electrophysiology. These innovative tools—including fast and slow dyes, electrochromic and FRET-based dyes, BODIPY fluorophores, QDs, and GEVIs—offer noninvasive, real-time measurement capabilities with exceptional spatial and temporal resolution. Complemented by cutting-edge imaging techniques such as fluorescence microscopy, flow cytometry, volumetric voltage imaging, PAI, and SHG, these developments address the limitations of traditional methods like patch-clamp techniques, providing more versatile, high-throughput alternatives. The enhanced sensitivity and specificity of these tools hold immense promise for advancing research in neuroscience, cardiology, and drug discovery, as well as uncovering novel insights into cellular physiology and membrane potential dynamics. These innovations pave the way for groundbreaking applications and a deeper understanding of complex biological systems.
Funding
This work is based upon research funded by Iran National Science Foundation (INSF) under project no. 4022012.



