Academic achievement is garnering increasing attention as a crucial developmental task for children, with significant implications for future adaptation in multiple domains of competence and psychopathology (Masten, Burt, & Coatsworth, Reference Masten, Burt, Coatsworth, Cicchetti and Cohen2006). There is particular concern about the school achievement of children living in poverty because of high and persistent risks for academic difficulties that carry long-term costs not only to individuals, but also to society (Arnold & Doctoroff, Reference Arnold and Doctoroff2003; Foster & Miller, Reference Foster and Miller2007; Heckman, Reference Heckman2006). Among socioeconomically disadvantaged children, compelling data suggest that homeless and highly mobile (H/HM) children fall at the high end along a continuum of risk for academic problems and related psychopathology (Buckner, Bassuk, Weinreb, & Brooks, Reference Buckner, Bassuk, Weinreb and Brooks1999; Haber & Toro, Reference Haber and Toro2004; Masten, Reference Masten1992; Raffery & Shinn, Reference Rafferty and Shinn1991; Rog & Buckner, Reference Rog and Buckner2007). To date, however, there is a paucity of longitudinal data on academic achievement in large or representative samples of H/HM children. The purpose of the present study was to examine (a) the differential risk associated with H/HM for longitudinal patterns of academic achievement among students in a large, urban school district and (b) the variability of H/HM students' academic trajectories in terms of achievement covariates and in the context of national norms.
Developmental Importance of Academic Achievement
There is growing evidence that academic problems in primary school not only foreshadow academic troubles in secondary school and beyond, but also carry considerable risk for “cascade” or progressive effects where academic difficulties spill over to other domains of adaptation over time (Masten et al., Reference Masten, Long, Roisman, Burt, Obradović and Roberts2005; Patterson & Stoolmiller, Reference Patterson and Stoolmiller1991; Rutter, Kim-Cohen, & Maughan, Reference Rutter, Kim-Cohen and Maughan2006). Academic failures, for example, may exacerbate antisocial behaviors and increase the risk for social and emotional problems, with many subsequent implications for adult outcomes (Caspi, Wright, Moffitt, & Silva, Reference Caspi, Wright, Moffitt and Silva1998; Cole, Martin, Powers, & Truglio, Reference Cole, Martin, Powers and Truglio1996; Dishion, Patterson, Stoolmiller, & Skinner, Reference Dishion, Patterson, Stoolmiller and Skinner1991; Hart & Risley, Reference Hart and Risley1995; Maguin & Loeber, Reference Maguin and Loeber1996; Maughan, Rowe, Loeber, & Stouthamer-Loeber, Reference Maughan, Rowe, Loeber and Stouthamer-Loeber2003; Patterson, Forgatch, Yoerger, & Stoolmiller, Reference Patterson, Forgatch, Yoerger and Stoolmiller1998; Thornberry, Lizotte, Krohn, Smith, & Porter, Reference Thornberry, Lizotte, Krohn, Smith, Porter, Thornberry and Krohn2003; Williams & McGee, Reference Williams and McGee1994). It is also increasingly clear that economically disadvantaged children begin school behind their more advantaged peers, which jeopardizes their future in multiple ways (Brooks-Gunn & Duncan, Reference Brooks-Gunn and Duncan1997; Dubow & Ippolito, Reference Dubow and Ippolito1994; Duncan & Brooks-Gunn, Reference Duncan and Brooks-Gunn2000; McLoyd, Reference McLoyd1998; Pagani, Boulerice, Vitaro, & Tremblay, Reference Pagani, Boulerice, Vitaro and Tremblay1999), yet efforts to address such “achievement gaps” have met with only limited success (Bradley & Corwyn, Reference Bradley and Corwyn2002; Carpenter, Ramirez, & Severn, Reference Carpenter, Ramirez and Severn2006; Heckman, Reference Heckman2006; Keating & Hertzman, Reference Keating and Hertzman1999; Temple & Reynolds, Reference Temple and Reynolds1999).
Unique Risks Faced by H/HM Children
In addition to the multitude of risks associated with child poverty (Evans, Reference Evans2004; Luthar, Reference Luthar1999), residentially mobile children living in poverty often face threats to development arising from disrupted relationships, stressful life events associated with mobility, and discontinuities in school attendance and curriculum. Mobile children in poverty are at high risk for broken bonds with teachers, friends, relatives, schools, and other potentially positive sources of security and opportunity (Rafferty, Shinn, & Weitzman, Reference Rafferty, Shinn and Weitzman2004). In addition, there often is an escalation of adversity immediately preceding transitions into homelessness, ranging from family violence to economic crises. Homeless families have higher levels of recent negative life experiences and more distressed parents than comparably poor but housed families (Masten, Miliotis, Graham-Bermann, Ramirez, & Neemann, Reference Masten, Miliotis, Graham-Bermann, Ramirez and Neemann1993). Moreover, the transient nature of H/HM children's life experiences jeopardizes the consistency of their educational experiences. Thus, it is not surprising that there is increasing concern regarding learning and academic progress among children in families who are both poor and residentially unstable (Eckenrode, Rowe, Laird, & Brathwaite, Reference Eckenrode, Rowe, Laird and Brathwaite1995; Rumberger, Reference Rumberger2003; Rumberger & Thomas, Reference Rumberger and Thomas2000; Temple & Reynolds, Reference Temple and Reynolds1999).
Despite the significance of the issues posed by residential mobility among low-income children, longitudinal research on the development and well-being of H/HM children is rare. In addition, there is very little data on how H/HM children fare in the context of public schools. Evidence suggests that federal legislation (i.e., McKinney Vento Homeless Assistance Act, 1987) designed to address the educational needs of H/HM children has improved access to school (Rog & Buckner, Reference Rog and Buckner2007). Little is known, however, about many other aspects of the educational experiences of H/HM students, including the degree to which their achievement issues differ from those of other low-income children. Most of the research on the competence and mental health of H/HM children is characterized by limitations such as small convenience samples, lack of comparison groups, and cross-sectional designs that cannot address key questions concerning growth and change over time (Haber & Toro, Reference Haber and Toro2004; Rog & Buckner, Reference Rog and Buckner2007). To our knowledge, there are no published studies that examine longitudinal patterns of academic achievement in large, representative samples of urban H/HM students.
Academic Achievement in H/HM Students
Early studies of academic success among children in homeless families suggested substantial problems. For example, Rafferty and Rollins (Reference Rafferty and Rollins1989) reported that among the homeless children who took standardized tests in reading (N = 3,805) and math (N = 4,203) in 3rd through 10th grade in New York City schools, only 42% and 28%, respectively, performed at or above grade-level norms. Several smaller studies also showed an association with delays in achievement. In Reference Zima, Wells and Freeman1994, Zima, Wells and Freeman reported severe vocabulary and reading delays in a sample of 169 children, ages 6 to 12, staying in 18 emergency homeless family shelters in Los Angeles County. Among these children, 47% scored at or below the 10th percentile on the Peabody Picture Vocabulary Test—Revised, while 39% scored at or below the 10th percentile on the reading subtest of the Woodcock–Johnson Language Proficiency Battery. The authors concluded that homeless children were approximately four times more likely than the general population to score at or below the 10th percentile, which is approximately 1 year below grade level. In 1997, Masten et al. reported that 80% of a small sample of 59 African American children living in emergency shelter with their families scored in the bottom quartile on the Wechsler Individual Achievement Test Screener (WIAT-S) relative to national norms. Moreover, based on teacher ratings of academic performance, 73% of the children fell in the clinical range.
Other studies have compared achievement in homeless children with matched samples of housed, low-income children to clarify whether homelessness poses additional risks for academic achievement beyond other well-established risks associated with poverty. Some studies have also examined whether variable attendance rates account for differences in academic achievement. Results have been mixed. Some studies suggest H/HM status is linked to lower achievement beyond the effects of attendance (Rubin et al., Reference Rubin, Erickson, Augustin, Cleary, Allen and Cohen1996; Vostanis, Grattan, Cumella, & Winchester, Reference Vostanis, Grattan, Cumella and Winchester1997). Rubin et al. (Reference Rubin, Erickson, Augustin, Cleary, Allen and Cohen1996) compared 102 children, ages 6 to 11, living in homeless shelters with 178 housed classmates on the Wide Range Achievement Test—Revised. After controlling for the child's age, sex, race, social class, and family composition, they found homeless children exhibited significantly lower levels of reading, spelling, and arithmetic, although the children did not differ in attendance rates. Follow-up analyses revealed that significantly more homeless children than housed children scored below grade level on reading (75.5% vs. 48%), spelling (72.4% vs. 50%), and arithmetic (53.6% vs. 21.7%). In contrast, a well-matched comparison study of 60 homeless and 114 low-income housed children, ages 6 to 17, showed no significant differences in achievement scores on the WIAT-S (Buckner, Bassuk, & Weinreb, Reference Buckner, Bassuk and Weinreb2001). The two groups had comparable attendance rates as well. Thus, it remains unclear whether H/HM students face unique academic achievement risk, particularly in comparison with low-income but less mobile peers.
Similar risks and achievement gaps have been reported in studies comparing children with high and low levels of residential mobility. In a national sample of 9,915 children ages 6 to 17, Wood, Halfon, Scarlata, Newacheck, and Nessim (Reference Wood, Halfon, Scarlata, Newacheck and Nessim1993) compared children whose lifetime number of age-adjusted residential moves fell above and below the 90th percentile. The two groups were equally likely to exhibit delays in growth or development and to have learning disorders. However, children with high rates of lifetime moves were 35% more likely to repeat a grade and 77% more likely to have four or more behavioral problems, controlling for various sociodemographic risk factors (including sex, minority status, maternal age at the birth of the child, parental employment and education, family structure, and poverty). In a study of African American female adolescents from low-income urban households, Adam and Chase-Lansdale (Reference Adam and Chase-Lansdale2002) showed the number of residential moves in the last 5 years predicted current overall adjustment, self-reported academic achievement, externalizing problems, and sexual activity, controlling for demographic risk factors (e.g., caregiver's age, education, financial strain, and marital status) and perceived current environment (e.g., quality of familial and peer relationships, support networks, and neighborhood problems). Another study found combined residential and school mobility partially accounted for the negative effect of maltreatment on English grades, standardized test scores, and grade retentions, after controlling for children's age, sex, and public assistance status (Eckenrode et al., Reference Eckenrode, Rowe, Laird and Brathwaite1995).
Longitudinal studies of academic achievement in relation to homelessness are rare, although such studies make it possible to examine changes in achievement over time. In one of the few extant studies, Rafferty and colleagues (2004) examined short- and long-term effects of homelessness on intelligence, reading, and math achievement in a sample of 46 initially homeless children, ages 11 to 17, who were later rehoused, and 87 very low-income, but consistently housed children. Before the first period of homelessness, no group differences in academic achievement existed. One year after the homeless group first entered a shelter, many still lived in a shelter and the average reading and math scores were approximately six percentile points lower than the consistently housed group of adolescents. After 5 years, however, when most of the homeless families had been rehoused for 3 years or more, no differences were found in achievement. Although both groups had low achievement scores relative to norms, the researchers concluded that the relative disadvantages of the homeless group were resolved after stable housing was established. Although this study demonstrates that average achievement of H/HM students may improve over time to resemble that of poor, housed peers, to date there have been no studies examining achievement growth trajectories of H/HM students.
Current Study
The goal of the present study was to examine longitudinal achievement patterns in H/HM children on a nationally norm-referenced test designed for growth curve analysis, in a large, urban school district. This study was made possible by district efforts to comply with the recent federal requirements (Title X of the No Child Left Behind Act of 2001, 2002) to track and assess the educational progress of H/HM students, the routine identification of children who qualify for free or reduced-price meals, and the availability of multiyear test data on a well-standardized achievement measure that accommodates growth analysis. A collaborative effort between university researchers and school district staff was formed to understand and address school success among H/HM students, with the long-term objective of identifying and promoting the processes that lead to academic resilience among mobile, high-risk students. This convergence of data and collaboration made an unprecedented study of achievement trajectories in a large H/HM population feasible.
The present study addresses the first two objectives of the collaborative team. The first objective was to identify the scope and nature of the achievement gaps in the school district with a representative sample of children, with a specific goal of testing whether H/HM children differed in risk from other low-income children who were not as residentially mobile. We compared initial levels of achievement and academic growth among three groups of students in the same district: (a) H/HM students, (b) low-income students (who qualified for free or reduced price lunch, but were not H/HM), and (c) relatively “advantaged” students (neither H/HM nor low income). Based on the concept of a continuum of risk, we hypothesized that students who were H/HM at any point during the study would show significantly lower levels of achievement than economically disadvantaged, but residentially more stable students and that both disadvantaged groups would have much lower achievement than the advantaged students who were neither H/HM nor low income. We also explored whether the rate of change in achievement growth varied by different levels of risk exposure. The effects of risk status were tested after controlling for differences related to sex, ethnicity, English language proficiency, and attendance rate differences. Based on the general literature on academic achievement (Arnold & Doctoroff, Reference Arnold and Doctoroff2003; Sirin, Reference Sirin2005) and data reported by the same school district in the past (Minneapolis Public Schools, 2005, 2007), we expected that girls would show higher levels of reading ability, whereas minority students, English language learners (ELLs), and students with lower attendance rates would have lower achievement scores in reading and math. Only achievement differences between White students and different minority groups were examined, because of the lack of a theoretical rationale for specific discrepancies among the various minority groups.
The second objective was to examine the variability of individual academic achievement trajectories within the H/HM subsample. First, we examined the effects of four well-established covariates of achievement. We expected to observe heterogeneity among the H/HM children that would be partially explained by differences in sex, ethnicity, ELL status, or attendance, all of which were expected to covary with achievement in expected directions noted above. Second, we further examined the variability of H/HM students' academic trajectories in terms of divergence from national norms on the administered achievement test after the effects of four covariates were accounted for. We calculated the percentages of H/HM children whose individual academic trajectories fell within benchmarks established by national averages and standard deviations for particular grades and assessment periods. We expected to observe individual trajectories of H/HM students that reflect academic resilience (achievement 1 SD below the national average or higher) as well as serious problems after controlling for traditional covariates of achievement that school districts routinely document.
We began our studies of the district data on H/HM students in the primary grades for five main reasons: (a) we were focused on children moving and residing with their families, and H/HM families tend to have younger children because the parents are younger (Haber & Toro, Reference Haber and Toro2004), in contrast to H/HM unaccompanied youth who tend to be teenagers living away from home and often not attending school or taking standardized tests; (b) studies of educational disparities indicate early emergence of achievement problems (Foster & Miller, Reference Foster and Miller2007; Hart & Risley, Reference Hart and Risley1995; Ramey & Ramey, Reference Ramey and Ramey2004; Temple & Reynolds, Reference Temple and Reynolds1999); (c) preventive interventions tend to be more cost effective when they begin earlier in developmental risk trajectories (Heckman, Reference Heckman2006); (d) the district had administered the same achievement test designed to assess growth over time to district students three times, beginning in Grades 2–5; and (e) the district was particularly concerned about achievement gaps and the scope of the problem represented by young H/HM students. In addition, multiple cohorts presented an opportunity to scrutinize the robustness of results through replication and also to examine whether findings varied across different grades.
Methods
Participants
Data for this study were drawn from a large data set originally collected by the Minneapolis Public School district (MPS) in Minnesota and deidentified for the purposes of secondary data analyses. Data for this study spanned three school years: 2003–2004 (T1), 2004–2005 (T2), and 2005–2006 (T3). The sample included four cohorts of children who were enrolled at the beginning of the study in the second, third, fourth, and fifth grades.Footnote 1 (Children who entered MPS after T1 were assigned to a cohort according to the grade in which they would have been enrolled at T1.) This study referred to these groups as the second, third, fourth, and fifth GCs. In the Minneapolis School District, 57.5% of seventh graders from the fifth GC attended K–8 grade schools, whereas 42.5% attended sixth to eighth grade schools.
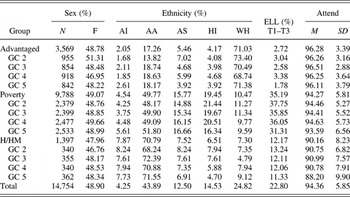
The first part of the study focused on the entire sample of N = 14,754 students who completed standardized achievement tests in math and reading at any point during the 3 school years. This sample was split into three mutually exclusive groups based on two major indicators of risk: (a) H/HM, composed of children who were classified as H/HM at any point in the 3 years (9.5% of the sample); (b) Poverty, composed of children who were identified as low-income (qualifying for free or reduced price meals) at any point in the 3 years, but who were not H/HM (66.3%), and (c) Advantaged, composed of the remaining children in the sample (24.2%). Students who were identified as H/HM at any point during the studied time interval were classified as H/HM because of possible errors of omission in identifying H/HM students during a specific school year. (The district did not have the capacity to continuously monitor students for H/HM status in order to accurately assess exact chronicity or timing of H/HM status, a challenging task given the transient nature of homeless children's lives and school attendance.) Table 1 presents the demographic and school enrollment characteristics for the groups and entire sample by GC.
Demographic and enrollment characteristics of H/HM, poverty, and advantaged groups

Note: H/HM, homeless/highly mobile; GC, grade cohort; F, female; AI, American Indian; AA, African American; AS, Asian; HI, Hispanic; WH, White; ELL, English language learner; Attend, averaged attendance.
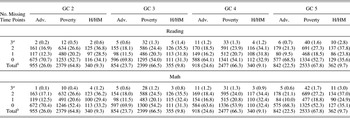
As one would expect in a large urban district with high levels of mobility and poverty, many children had missing data for a specific test administration. Table 2 shows the patterns of missing data by GC and risk level across three waves of assessment. The majority of students in the poverty and advantaged groups had complete data across all four GCs. The majority of H/HM students did not have complete data. To maximize the information collected in this study, we used statistical procedures that allowed us to include all participants who had data for at least one time point (see below). Because of missing data, we were unable to fully examine retention rates. However, across all risk levels, less then 1% of students were retained a grade between the first and second assessment waves. Analogous retention rates were found between the second and third assessment waves. Thus, we treated all students as if they advanced one grade each school year.
Missing data frequencies (percentages) by GC and risk status across three assessment waves

Note: GC, grade cohort; Adv., advantaged students; H/HM, homeless/highly mobile.
aA very small percentage of students who are missing all three time points on one achievement outcome are included in the whole sample descriptives because they have data on the other achievement outcome. However, only students who had at least one time point were included in the analysis.
bThe percentages for the total are based on the total frequency within the GC.
Measures
Risk
In the MPS district, homelessness and high mobility status is determined in accordance with the language of the McKinney Vento legislation, as reauthorized in 2002 as part of the No Child Left Behind Act of 2001, and the federal guidance issued shortly after the legislation was enacted. Children meet the McKinney Vento definition of H/HM if their families live in any of the following conditions: (a) in a shelter, motel, vehicle, or campground; (b) on the street; (c) in an abandoned building, trailer, or other inadequate accommodation; or (d) doubled up with friends or relatives because they cannot find or afford housing. Students who live in these conditions at any point during the school year are identified as H/HM at the Student Placement Center, schools, or shelters by specially trained MPS or shelter staff. An additional question (“Are you staying in a shelter or other temporary housing?”) is included on the enrollment form to assist staff in identifying H/HM students new to the district or to the school. An affirmative answer is followed up with a more detailed family/youth self-identification questionnaire. In addition, students who report changes in residential address three or more times in a 12-month period are identified as H/HM.
Poverty status was defined by student eligibility for free or reduced-price meals. A student is eligible for free or reduced-price meals if the student's family meets income guidelines set by the U.S. Department of Agriculture: below 130% of the official federal poverty line for free lunch and below 185% of the poverty line for reduced price lunch. For the period July 1, 2004, through June 30, 2005, 130% of the poverty line was $24,505 for a family of four, and 185% was $34,873.
A risk index was created to approximate students' exposure to H/HM or poverty at any point during the 3 school years. Groups were coded as follows: 2 = advantaged group, 1 = poverty group, and 0 = H/HM group.
Academic achievement
Academic achievement in the first 2 years of the study was assessed using the Northwest Achievement Levels Tests (NALT; Northwest Evaluation Association, 2003). In the spring of 2004 and 2005, the NALT reading and math assessments were given to district students in Grades 2–7 as standardized paper and pencil tests. These tests are adaptive assessments, in that each student receives a form of the test appropriate to his or her achievement level as determined by prior assessment. Estimates of the appropriate level were made from results of the prior year NALT or state tests for students who were enrolled in MPS the previous year. Students new to the district took a short “locator” assessment to place them in the initial level of assessment. All items in the NALT are multiple choice and are chosen from a large item bank by expert reading and math teachers to match the state requirements. NALT raw scores are converted to scale scores using item response theory (IRT) scaling procedures. National norms with means, standards errors, and reliability and validity coefficients are available from the publisher (Northwest Evaluation Association, 2005). MPS has conducted a study of concurrent validity demonstrating NALT reading scores had high correlations with the Minnesota Comprehensive Assessment (MCA) Test of Reading in Grade 3 (N = 3,785) and Grade 5 (N = 3,383), with correlation coefficients of .87 and .88, respectively (Heistad & Spicuzza, Reference Heistad and Spicuzza2000).
In the fall of 2005, the NALT items were administered using Computer Adaptive Level Testing (CALT). The CALT uses questions from the same reading and math item bank as the NALT, but the adaptive procedure is computer driven rather than based on different paper and pencil forms. Following the locator test, each student receives three testlets of 13 items each. If a student scores extremely well on the first testlet, s/he is given a more difficult testlet for the second group of 13 items. If the student has difficulty with the first testlet, s/he is given an easier set of 13 items. The CALT branches again after the second testlet. Most students in T3 were assessed with the CALT. However, some students receiving special education services were allowed to take the paper and pencil NALT, and students receiving limited English proficiency services were permitted to use the paper version of the math items, which are translated into Hmong, Spanish, and Somali. Based on IRT, the scale scores of the NALT and CALT are comparable, and we treated the scores as if they came from the same measure administered multiple times. A recent MPS study reported high correlations (all above .80) between fall NALT/CALT and spring MCA-Series II reading assessments and fall NALT/CALT and spring MCA-Series II math assessments for all third through eighth grade students who took these tests in the 2005–2006 school year (Minneapolis Public Schools, 2006). We used the number of months that elapsed between achievement tests as a time metric to account for the uneven spacing of assessment periods.
Demographics and enrollment characteristics
Demographic variables reported in this study were collected as part of the official enrollment process. At enrollment, parents or guardians fill out forms that include designation of children's sex and primary ethnicity according to five category options. For H/HM students who are not staying in shelters, the enrollment data is gathered at the Student Placement Center and at the individual school sites. For H/HM students staying in shelters, the enrollment data is gathered directly from families by district staff working at the largest family shelter in Minneapolis or by shelter staff at 36 other shelter organizations familiar with district enrollment requirements.
ELL status was derived from intake assessments of English language proficiency and eligibility for ELL programs. The status was coded using a binary coded dummy variable (0 = ELL, 1 = not ELL). This school district has had a significant influx of immigrant students in recent years and gradually has adapted its services to the diversity of the new student body. Thus, as with the risk index, we created the ELL index based on eligibility for ELL programs at any point during the three academic years.
Attendance data was gathered through the district-wide student information system. All teachers were required to take attendance daily, and an attendance clerk at each school monitored to see that all attendance data fields were filled out completely. Given that enrollment periods of H/HM students vary considerably, we used percentage scores (average number of days attended divided by number of days enrolled), which were then averaged across the three school years to give an indicator of attendance rate. This approach, employed by MPS research staff, captures poor, sporadic attendance, and does not penalize H/HM students who may move to or from a different school district during a school year and thus may have a lower maximum number of days attended.
Data analyses
Linear mixed models (LMMs) for entire sample
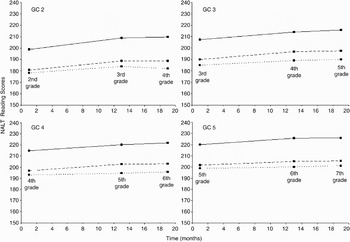
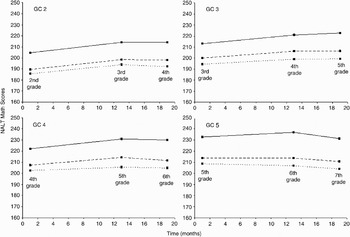
The first analysis was based on the entire sample and examined the relation between risk exposure and academic achievement over time, controlling for sex, ethnicity, ELL status, and attendance. Growth curves were fit using LMMs (Fitzmaurice, Laird, & Ware, Reference Fitzmaurice, Laird and Ware2004, chap. 8) separately for each GC (GC 2–5) and for each response variable (reading and math achievement). Observed means suggested the need for nonlinear trajectories (see Figure 1 and 2). As there were only three time points and thus limited degrees of freedom, we used a transformation of the time metric rather than a quadratic polynomial model to account for nonlinear change. This transformation was t ij = loge(monthsij), where i is the participant subscript (i = 1, … , N) and j is the wave subscript (j = 1, … , n i). The t ij transformation is quite flexible, accommodating near-linear trajectories and the simplest form of nonlinear trajectories (Long & Ryoo, in press; Royston, Ambler, & Sauerbrei, Reference Royston, Ambler and Sauerbrei1999).
The observed means of reading achievement for (—) advantaged, (– – –) poverty, and (- - -) homeless and highly mobile groups over time by grade cohort (GC).

The observed means of math achievement for (—) advantaged, (– – –) poverty, and (- - -) homeless and highly mobile groups over time by grade cohort (GC).

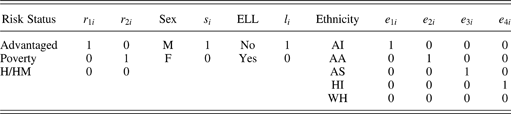
The LMM was specified using a series of binary coded dummy variables for risk exposure (advantaged, poverty, H/HM), sex (female, male), ELL status (ELL, non-ELL), and ethnicity (Amerian Indian, African American, Asian, Hispanic, White). Attendance was a continuous variable and thus not dummy coded. Dummy variables for risk (r 1i, r 2i), sex (s i), ELL (l i), and ethnicity (e 1i, e 2i, e 3i, e 4i,) were assigned values of 0 or 1 according to the scenario in Table 3. As Table 3 indicates, the last level of all variables was set to the reference level against which all other levels were compared.
Dummy coding of categorical covariates for the growth curve analysis
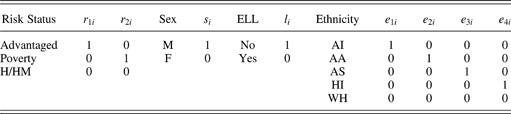
Note: ELL, English language learner; H/HM, homeless/highly mobile; AI, American Indian; AA, African American; AS, Asian; HI, Hispanic; WH, White.
With the dummy variables defined above, and with attendance denoted by atti, we defined y ij as the reading or math score for the ith individual at the jth wave of measurement (reading and math were analyzed separately and each GC was analyzed separately). Thus, the LMM used in the analysis was

In Equation 1, the betas are fixed effects where β0 is the intercept; β1–β9 are the associations between the covariates and the intercept, that is, the intercept by covariate interactions; β10 is the slope; and β11–β19 represent the associations between the covariates and the slope, that is, the slope by variable interactions. The error term, ɛij, has a random effects structure that is either ɛij = b 0i + e ij or ɛij = b 0i + b 10it ij + e ij, where b is the random effects and e ij is the random error, the latter having a diagonal variance–covariance matrix σ2Ii. The random effects and error are assumed to be normally distributed and have mean value of zero. The random effects are assumed to be uncorrelated with random error, and they have covariance structure, G, which is a 2 × 2 matrix when both b 0i and b 1i are included and a scalar when only b 0i is included (i.e., G = var(b 0i)).
As the number of required random effects was unknown, we tested the need for inclusion of the random effects in the full (conditional) model before testing the fixed effects (Diggle, Reference Diggle1988; Verbeke & Molenberghs, Reference Verbeke and Molenberghs2000, chap. 9). We first estimated the variance components matrix including both random effects (i.e., the 2 × 2 G matrix) using Equation 1 (all fixed effects were included). If the statistical test of var(b 1i) was not significant, only the random intercepts term (i.e., b 0i) was left in the model; otherwise, both random effects terms were left in the model. Then the model was reestimated. Finally, with the number of random effects determined by the first step, the fixed effects in Equation 1 were tested.
All analyses were carried out using PROC MIXED of SAS Version 9.1 with maximum likelihood estimation. With incomplete data, maximum likelihood estimates marginal means under the assumption that the missing data mechanism is missing at random (MAR). In the context of our analysis, MAR implies that random missingness at any one time point may be conditional on any of the control variables or previous time points. Although the MAR assumption is very difficult to evaluate (see Fitzmaurice et al., Reference Fitzmaurice, Laird and Ware2004, chap. 14), descriptive analysis (not presented) of missingness conditional on the above variables appeared to be consistent with the MAR assumption.
In the first analysis, interest focused mainly on effects of risk as the other variables were control variables. Thus, we were most interested in the risk by intercept fixed effects, β1 and β2, and the risk by slope fixed effects, β11 and β12. Because of the multiple dummy variables, an omnibus test for each variable was computed followed up by specific tests when needed.
LMMs for H/HM students
The second analysis considered only the H/HM risk group. The goal of this analysis was to examine variability of individual growth curves and reference the academic achievement of the H/HM participants to national norms. Individual variability was represented by variability of intercepts when only b 0i was in the model and by variability of intercepts and slopes when b 0i and b 1i were in the model. Similar to the first analysis, growth curves were fit using LMM and the need for random effects was determined before testing the fixed effects. The same control variables were used but the focus was on the extent to which the control variables accounted for variability in intercepts and/or slopes. The LMM was the same as Equation 1 but with the risk dummy variables omitted (only H/HM participants were included). In addition to estimating the fixed effects and variance components (G matrix and σ2) with maximum likelihood, individual random effects were estimated using empirical Bayes procedures (e.g., Verbeke & Molenberghs, Reference Verbeke and Molenberghs2000, chap. 7). The individual random effects were used to compare the achievement of our sample to the achievement of a national norm group.
Results
To address Objective 1, the first set of analyses focused on examining the effects of risk on academic achievement trajectories in the entire school district sample. The second set of analyses focused on Objective 2, examining variability of academic achievement trajectories among H/HM students.
Academic achievement in H/HM, poverty, and advantaged groups
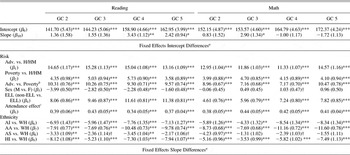
Table 4 shows the results of the growth curve analysis for reading and math achievement. The table shows the parameter estimates and standard errors in parentheses. The Equation 1 effects are listed in the first column (fixed effects and variance components). The results in the table are those of the trimmed models so that only the significant variance components are shown. (Omitted variance components denotes model trimming in the first step.) As the bottom of the table indicates, both random effects terms were included for the analysis of GC 2 and 3 (math and reading), whereas only the random intercept term was included for the analysis of GC 4 and 5 (math and reading). In addition, the intercept and slope parameter estimates for the third risk comparison (advantaged group vs. poverty group) are included, as this was the predictor variable of prime interest. Given the large sample size and multiple tests, a result of p < .05 was considered “marginal,” whereas a result of p < .01 was considered statistically significant.
Parameter estimates (standard errors) for the entire sample's reading and math achievement

Note: GC, Grade Cohort; Adv., Advantaged students; H/HM, homeless/highly mobile; M, male; F, female; ELL, English language learner; AI, American Indian; AA, African American; AS, Asian, HI, Hispanic; WH, White.
aTests of fixed effects are F tests.
bParameter estimates not accompanied by a beta term are based on follow-up tests.
cAttendance was a continuous variable.
dTests of variance components are z tests.
†p < .05. **p < .01.***p < .001.
Reading
The left side of Table 4 shows the results for reading achievement by GC. The table indicates there were intercept effects for all the predictors, including risk, demonstrating that there were risk intercept differences after controlling for sex, ethnicity, ELL status, and attendance rate. Across all four GCs, H/HM students had significantly lower levels of initial reading achievement than the poverty group and the advantaged group of students. In addition, economically disadvantaged students had significantly lower levels of initial achievement than the advantaged group of students. In general, girls, non-ELL students, White students, and children with higher attendance rates demonstrated significantly higher levels of reading achievement across all four GCs.
There were far fewer significant slope effects (see left side of Table 4). A significant risk by slope interaction was found only for GC 5. The advantaged group of students showed significantly steeper growth in reading achievement than either disadvantaged group. In contrast, the reading trajectory of economically disadvantaged and H/HM students did not differ from each other in their rate of change. In terms of covariates, a significant ethnicity by slope interaction emerged for GC 2 and 4, and a significant ELL by slope interaction emerged for GC 4. Figure 1 shows the observed mean reading trajectories for each risk group in each GC.
The covariance of intercepts and slopes, cov(b 0i, b 10i), was significant only for GC 3 with the estimated correlation  , indicating a weak negative association. In other words, students who showed lower levels of reading achievement in third grade (at the onset of the study) had steeper growth over the subsequent school years, and vice versa.
Math
The right side of Table 4 shows the significant effects for math achievement by GC. As with the reading results, there were many more significant effects for intercept than slope. Risk by intercept interactions were significant across all four GCs, controlling for sex, ethnicity, ELL status, and attendance rate. H/HM students had significantly lower levels of initial math achievement than the poverty group and the advantaged group of students, whereas the poverty group demonstrated significantly lower levels of initial achievement than the advantaged group. Overall, ELL status, minority status, and lower attendance rate, but not sex, predicted significantly lower initial levels of math achievement.
The only significant predictor of slopes was risk at GC 3 and GC 4 (see right side of Table 4). The advantaged group of students showed a significantly steeper growth of math achievement than both the poverty and H/HM groups, whereas trajectories for the two economically disadvantaged groups did not differ in their rate of change. Figure 2 shows the observed mean math trajectories for each risk group in each GC.
The covariance of intercepts and slopes, cov(b 0i, b 10i), was significant only for GC 2 and GC 3 with the estimated correlations  and −.22, respectively. Weak negative associations between intercepts and slopes indicate that students who showed lower initial levels of math achievement in the two youngest cohorts had steeper growth over the subsequent school years, and vice versa.
Academic achievement in H/HM
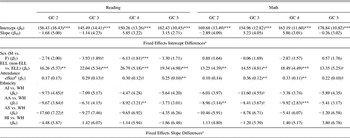
Variability in achievement within the H/HM students was more closely examined in relation to the four covariates included in the study as well as to national norms. The results are shown in Table 5. Again, the presented results are those of the trimmed model so that only the significant variance components are shown. As the bottom of the table indicates, the only analysis that included both random effects (intercept and slope) terms was the analysis for GC 3 math. All other analyses included only the random intercepts term.
Parameter estimates (standard errors) for H/HM students' reading and math achievement

Note: GC, grade cohort; Adv., advantaged students; H/HM, homeless/highly mobile; M, male; F, female; ELL, English language learner; AI, American Indian; AA, African American; AS, Asian; HI, Hispanic; WH, White.
aTests of fixed effects are F tests.
bAttendance was a continuous variable.
cTests of variance components are z tests.
†p <. 05. **p < .01. ***p < .001.
Reading
The left side of the Table 5 shows the significant intercept effects for reading achievement by GC. Girls showed significantly higher initial reading levels only for GC 3. As expected, students with ELL status had significantly lower initial levels of reading achievement across all four GCs, whereas those with higher attendance rate had significantly higher reading levels in GC 5. White students had higher initial reading levels than African American students in GC 4.
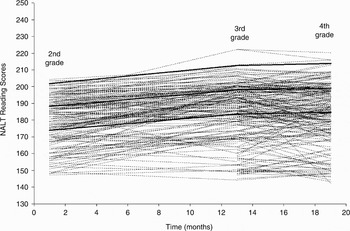
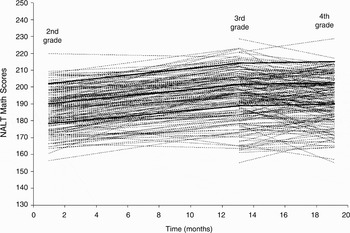
Most importantly for the purpose of these analyses, the variance estimates of the intercepts were significant for all GC levels (see the bottom of Table 5). That is, there was significant variability of initial reading achievement scores, controlling for all the covariates at each GC level. Figure 3 illustrates the variability of observed reading achievement scores in all H/HM students in GC 2, superimposed with lines representing the national mean and 1 SD above and below the national mean. The GC 2 is used as a representative example, as variability of other GCs looked very similar.
The observed means of reading achievement over time for highly mobile (H/HM) students in the second grade cohort. The national mean and 1 SD above and below the national mean are represented by the solid lines.

Math
The left side of the Table 5 shows the significant intercept effects for math achievement by GC. There were no sex differences in initial math achievement levels. Similar to reading, students with ELL status had significantly lower initial levels of math achievement across GC 2, GC 3, and GC 4, whereas those with higher attendance rates had significantly higher math levels in GC 3 and GC 4. White students had significantly higher initial math levels than African American students in GC 2 and GC 4. The only significant predictor of math achievement slope was ELL status in GC 4.
The variance estimates of the intercepts were significant for all GC levels, indicating significant variability of initial math achievement scores, controlling for all of the covariates (see the bottom of Table 5). In addition, the variance estimates of the slopes were significant in GC 3. Figure 4 illustrates the variability of observed reading achievement scores in all H/HM students in GC 2, superimposed with lines representing the national mean and 1 SD above and below the national mean. The GC 2 is used as a representative example, as variability of other GCs looked very similar.
The observed means of math achievement over time for H/HM students in second grade cohort. The national mean and 1 SD above and below the national mean are represented by the solid lines.

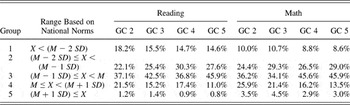
We further examined the variability of achievement in the H/HM subsample using predicted growth curves for each participant that were computed based on the estimated random effects using the aforementioned Empirical Bayes method. For each GC level and each response variable, we tallied the number of participants in the H/HM sample whose individual intercept estimates would be equal to or higher than national norm group benchmarks. We decided to compare children using only estimates of intercepts because there were no consistent slope variability effects across cohorts, indicating that initial differences represented by intercept variability were preserved over time. We used the national norm mean and standard deviation for a specific grade, semester, and year of test administration to identify groups of H/HM students whose estimated academic performance fell (a) below (mean − 2 SD), (b) between (mean − 2 SD) and (mean − 1 SD), (c) between (mean − 1 SD) and mean, (d) between mean and (mean + 1 SD), and (e) above (mean + 1 SD). Table 6 shows the percentage of the sample in each of the five groups. For the purposes of this analysis, we defined children as academically resilient if their estimated achievement scores occurred within a resilient range (1 SD below the national mean or higher); however, we also provide findings for a higher threshold of performance (at the national average or higher).
Percentage of H/HM students with achievement estimates within groups based on national norms

Note: GC, grade cohort; M, SD, national mean and standard deviation for a specific grade, semester, and year of test administration.
Reading
The variability of estimated reading trajectories was examined in relation to national norms (see the left side of Table 6). Averaged across all four GCs, approximately 58% of estimated reading trajectories fell in the resilient range (1 SD below the national mean or higher), whereas approximately 17% scored at or above the national mean. The percentage of H/HM students with estimated achievement above the national mean declined progressively from 22.7% in GC 2 to 11.8% in GC 5. Moreover, a large majority of H/HM students had estimated reading trajectories below the national average (see Figure 3). About 85% of students in the older three GCs and about two-thirds of the youngest GC had estimated achievement below national averages for grade. More than 40% of H/HM students' estimated reading trajectories fell 1 SD below the national mean. Although no student showed estimated reading achievement growth 2 SD above the national mean, around 15% of the estimated trajectories fell below 2 SD from the national mean.
Math
The variability of estimated math trajectories was examined in relation to national norms (see the right side of Table 6). Analogous to reading trajectories, averaged across all four GCs, approximately 63% of estimated math trajectories fell in the resilient range (1 SD below the national mean or higher). Across all four GCs, about 23% of H/HM students had estimated math achievement scores above the national mean level; however, this percentage declined progressively from 29.4% in GC 2 to 16.5% in GC 5. More students had estimated math growth at or above the national mean than had reading growth at that level; nevertheless, a majority of all students had estimated math achievement below the national average (see Figure 4). It is noteworthy that the percentage of H/HM students with estimated achievement below the national mean increased progressively for older GCs. More than one-third of H/HM students had estimated math trajectories that fell below 1 SD from the national mean. Although no student showed estimated math achievement growth 2 SD above mean, about 10% of estimated trajectories fell below 2 SD from the national mean.
Discussion
Homelessness and high mobility as a risk for low academic achievement
This study examined the significance of H/HM status for longitudinal patterns of academic achievement. Findings support the hypothesis that children who are homeless or highly mobile are at greater risk for low academic achievement relative to other low-income students as well as more advantaged students in this large urban school district. H/HM status emerged as a significant predictor of academic trajectories, echoing Gutman, Sameroff, and Cole's (Reference Gutman, Sameroff and Cole2003) finding that cumulative risk significantly influences growth of grade point average from 1st to 12th grade. Results indicating lower initial achievement scores on standardized tests for reading and math were consistent with a risk gradient. Across all four GCs, academic achievement was lower among poor children on free/reduced lunch and even lower among H/HM students. The effect of risk exposure on initial reading and math levels was significant, controlling for common covariates of academic achievement. In other words, homelessness and high mobility status was found to be an additional risk factor for early school success over and above the significant effects of sex, ELL status, attendance rates, and ethnicity. The gap in achievement between H/HM students and their low-income and advantaged peers was present as early as second grade and persisted through elementary school. This study suggests that in a large, urban district, H/HM children are facing higher risk for school failure than children who come from low-income but residentially stable families. In addition, in the whole district-wide sample, boys appeared to have higher risk for lower reading achievement scores than girls, whereas ELL status and low attendance rate were associated with risk for lower achievement both in reading and math. Minority status also was a risk factor for lower achievement in both academic areas, although achievement differences between Asian and White students were less robust.
In three GCs, disadvantaged status also predicted achievement growth. In the oldest, fifth GC, H/HM, and low-income students had significantly slower rates of reading growth than more advantaged children. As children transitioned into older grades and faced increasingly demanding reading curricula, the gaps between the reading abilities of disadvantaged and advantaged students widened. The two disadvantaged groups also demonstrated significantly slower growth of math achievement than more advantaged children in the third and fourth GCs. Even though risk status was not significantly associated with the growth of math achievement in the fifth GC, the average math achievement, according to observed means, appeared to decrease in the H/HM group and showed no gains in the low-income group over the first two time points. Taken together, results from this study suggest that the math achievement gaps between disadvantaged and advantaged students in the district widened in older GCs. However, lower initial achievement was correlated with steeper achievement gains in the younger GCs, consistent with the possibility of some “catching up” in early grades. Achievement growth appears to be particularly vulnerable to the effects of socioeconomic risk as children move to higher grade levels, perhaps because of more difficult school work, increasing time demands from nonschool activities, peer influences, or declining motivation (Sirin, Reference Sirin2005). This effect may not be unique to the experience of homelessness and high mobility. However, given that the initial levels of H/HM children's achievement are already significantly lower than those of low-income students, H/HM students may be more affected by the slower rate of achievement growth.
The increase in achievement across the two spring assessments (T1 and T2), 1 year apart, was followed by a deceleration between the second spring and subsequent fall assessment (T2 and T3). This finding is consistent with the seasonal pattern of learning identified by Alexander, Entwisle, and Olson (Reference Alexander, Entwisle and Olson2001), who documented a slower intraindividual rate of change in academic achievement across the summer months. Alexander and colleagues also reported that the seasonal pattern varied with socioeconomic status (SES), with low-SES children showing almost no gains during the summer. Observed means in our study indicate that children in the H/HM and poverty groups in the youngest cohort showed a slight decrease in reading achievement between the second spring and fall semesters, whereas all three groups in the second, fourth, and fifth GCs showed summer-related declines in math achievement. Future studies need to examine the seasonal effect on achievement in children exposed to various levels of risk and adversity. Because of residential instability, H/HM children may be particularly affected by a lack of educational opportunities during the summer. If so, academically oriented summer curricula may prove to be an important component for intervention strategies aimed at reducing achievement gaps for this vulnerable group.
In sum, both the reading and math achievement of H/HM children fell significantly behind their low-income, but residentially more stable peers, as well behind their more socioeconomically advantaged peers. Achievement gaps that reflected the risk gradient persisted throughout elementary school years, and in several GCs, gaps widened between disadvantaged and advantaged students. These findings corroborate a mounting concern regarding the early academic achievement of H/HM children, who seem to be at particular peril for underachievement (Haber & Toro, Reference Haber and Toro2004; Masten et al., Reference Masten, Sesma, Si-Asar, Lawrence, Miliotis and Dionne1997; Rog & Buckner, Reference Rog and Buckner2007). Given the developmental importance of early school success for later adaptation (Masten et al., Reference Masten, Burt, Coatsworth, Cicchetti and Cohen2006), findings of this study suggest a need for more targeted intervention programs to boost early academic achievement. The unique adversities faced by H/HM children will need to be considered in designing such programs. Interventions must consider strategies to address initial achievement disparities and also the rate at which these children gain new knowledge. Moreover, interventions need to focus on overall achievement issues of large, urban school districts with a high proportion of students who are poor and/or homeless and highly mobile and the concomitant gaps between district achievement and national norms. Schools and school districts with an overwhelmingly disadvantaged student body may face systemic challenges that could exacerbate the risks posed by individual disadvantage (Lewis, James, Hancock, & Hill-Jackson, Reference Lewis, James, Hancock and Hill-Jackson2008; Rumberger, Reference Rumberger2007). Public school students in this urban district are socioeconomically diverse, including professional and high-income families residing in some neighborhoods. However, a substantial proportion of the families are living in poverty, with all of the risks associated with poverty, including lower quality housing, health care, environmental safety, and limited economic and social capital.
Resilience and maladaptive trajectories of H/HM students
Despite the striking overall risk evident in H/HM students, there was marked variability of initial reading and math achievement levels within the H/HM sample. In contrast, there was no significant variability in the rates of reading achievement growth within each GC of H/HM subsample and no significant variability in the rates of math achievement growth in three GCs of the H/HM subsample. Thus, initial academic disparities persisted over the three school years. Stability of achievement emerged even earlier in the H/HM sample than in the district-wide sample, where lack of variability was noted only in the two oldest cohorts. These findings are congruent with the growing attention to early preventive interventions that target reductions in the initial differences and the importance of efforts to accelerate academic growth once large differences emerge (Arnold & Doctoroff, Reference Arnold and Doctoroff2003; Foster & Miller, Reference Foster and Miller2007).
This study also demonstrates that basic demographic covariates did not show robust effects with respect to academic achievement of H/HM students. H/HM girls showed better reading achievement only in the fourth GC, lacking the steady advantage that female students demonstrate in the district-wide sample. Whereas ELL status presented a similar risk for reading and math underachievement in H/HM students, low attendance rates seemed to have a more sporadic effect on H/HM students' achievement in comparison to district-wide findings. Finally, only in a few GCs did H/HM African American students have lower achievement than H/HM White students. Overall, minority status was not as robust a predictor of achievement in H/HM students as it was in the district-wide sample. The cumulative adversities and risks associated with pathways to homelessness or high mobility may overwhelm the differences related to minority status. H/HM in low-income families are associated with many risk factors for achievement, including interparental conflict and neighborhood violence, environmental toxins, poor child nutrition, health and health care, foster care placement, child maltreatment or neglect, and parent problems related to drug use, health, or mental health problems (Haber & Toro, Reference Haber and Toro2004; Rog & Buckner, Reference Rog and Buckner2007; Rumberger, Reference Rumberger2003).
Results corroborated expectations of observable academic resilience as well as risk. Although many H/HM students had achievement scores below national means, or substantially below this level, there were many H/HM children showing reasonably good or above average test patterns. Approximately 60% of H/HM students in each GC demonstrated resilience in their academic trajectories, defined in terms of testing within 1 SD of national averages or higher. Even with a stringent criterion for resilience of scoring at the national average level or better, about 20% of H/HM students manifested resilience in their achievement test performance. Research is needed to understand the processes by which H/HM children achieve successful academic trajectories in relation to both less adaptive peers from similar backgrounds and equally successful children who are not contending with all the adversities and disadvantages that accompany homelessness or high mobility. Research on processes contributing to variable trajectories has the potential to guide efforts to facilitate academic achievement in H/HM students and to address related educational disparities.
Unfortunately, the proportion of students showing trajectories of high resilience over time progressively declined across elementary school GCs. Although 23% and 29% of H/HM students in the second GC demonstrate reading and math trajectory scores at or above national means, only 12% and 17% do so in the fifth GC. Future studies need to examine the factors that contribute to this grade-related decline in the proportion of resilient academic trajectories.
Approximately 40% of H/HM students within each GC had reading and math scores lower than 1 SD below the national means. Moreover, in each GC approximately 15 and 10% of H/HM students scored lower than 2 SD below national averages on reading and math achievement tests, respectively. Understanding what contributes to such low levels of academic achievement is a crucial next step in addressing achievement disparities, especially because this study reveals little variability in the rate of academic growth among H/HM students, meaning that initial gaps tend to persist across different grades. Given known links between school failure and increases in externalizing and internalizing behavior problems and school drop-out rates (Dishion et al., Reference Dishion, Patterson, Stoolmiller and Skinner1991; Maguin & Loeber, Reference Maguin and Loeber1996; Patterson et al., Reference Patterson, Forgatch, Yoerger and Stoolmiller1998), these achievement gaps should be addressed as early as possible before deleterious cascade effects occur.
Overall, H/HM students performed better on math than reading achievement tests, and this difference was particularly salient for the highest and lowest achievement trajectories. It is particularly concerning that 18% of H/HM students in the second GC had reading skills that were lower than 2 SD below national test norms. Results also indicate that ELL status did not account for this problem. These scores suggest serious literacy issues or disengagement, either of which could undermine achievement in other academic domains and increase risk for school drop out.
In conclusion, the findings of this study highlight the diversity of academic achievement trajectories among H/HM students. Substantial numbers of H/HM individuals show surprisingly good achievement and progress over time, and yet many do not. Different processes are likely to be involved in the academic trajectories of children who perform below national norms compared to those performing consistently above national averages. Children whose math and reading scores are lower than 2 SD below national averages may face distinct academic risks and difficulties, with markedly different needs than children who are doing well. The heterogeneity found in H/HM students' achievement suggests that diverse strategies may be needed to promote achievement in H/HM children.
Limitations
Although this study provides a rare, longitudinal examination of risk and academic achievement in a large sample of H/HM students, it suffers from several important limitations. Details were lacking in the data regarding the onset and length of homelessness and nature of mobility. Thus, it was not possible to examine how the timing and chronicity of homelessness and high mobility may have affected achievement trajectories. The indicator of risk relied solely on the district identification of homeless and highly mobile students and eligibility for free or reduced-price lunch. In addition, we were able to control an important, but limited set of covariates currently available in the district data system. The study lacked the depth or richness of information on risk/promotive or vulnerability/protective influences that ideally would be included in studies designed to examine the individual, family, and societal processes leading to achievement differences. Gaining access to such data would entail either substantial changes in district-wide assessments or the prospective embedding of more intensive and focused studies within large studies such as this one. Either approach will be challenging, but it is important to move beyond description if the goal is to inform interventions and policies that will promote academic success in highly mobile children. Although this study is based on a large, representative, district-wide data set that capitalized on available data, future studies must find a way to reduce missing data rates inherent in longitudinal studies of H/HM student populations. Collaboration across several school districts or state-level tracking systems may lead to more complete data (e.g., attendance rate across the entire year) and better follow-up rates for H/HM students who transfer to schools outside of the district. Moreover, procedures for standardized testing need to be revised in consideration of H/HM students' attendance to more reliably capture the academic progress of this disadvantaged group.
Conclusion
Status as H/HM poses serious risks for academic achievement. Initial academic achievement gaps for H/HM students tend to persist over time, and may worsen among older GCs. At the same time, there is evidence of striking variability in the achievement of H/HM students, with a wide range of resilient and maladaptive trajectories. This study highlights the heterogeneity among H/HM children and underscores the need for research on the processes that may account for observed academic resilience as well as vulnerability and failure. Additional research is needed to examine the interplay of factors that may contribute to the multifinality (Cicchetti & Rogosch, Reference Cicchetti and Rogosch1996) of academic pathways observed here among highly mobile students, ideally focused on multiple levels of analysis (Cicchetti & Curtis, Reference Cicchetti and Curtis2007). Moreover, it is unlikely that districts routinely assess the kind of differences in children, families, teachers, classrooms, or schools that may matter the most. Longitudinal studies with assessments specifically designed to understand key vulnerability or protective processes are needed. It will also be important to examine the behavioral symptoms and patterns of psychopathology that may accompany the academic trajectories observed here because psychopathology and academic achievement often covary or influence one another over time (Masten et al., Reference Masten, Long, Roisman, Burt, Obradović and Roberts2005, Reference Masten, Burt, Coatsworth, Cicchetti and Cohen2006). Given the developmental importance of school success for general adaptive functioning and the link between school failure and homelessness in adults (Bassuk et al., Reference Bassuk, Buckner, Weinreb, Browne, Bassuk and Dawson1997), studies that identify processes fostering academic resilience among highly mobile students may be critical for interventions to promote positive development, reduce achievement gaps, and prevent crossgenerational homelessness. Our hope is that by establishing robust evidence of both longitudinal risk and resilience using a large, representative sample, this study will stimulate a new wave of more process-oriented studies of homeless and highly mobile children's development.