
Introduction
Polarized resonant soft x-ray scattering (RSoXS) uses mass, chemical, and orientational contrast to provide quantitative morphological information about polymers beyond hard x-ray scattering. Early work demonstrated that RSoXS can reveal mesoscale domain spacings in microphase-separated polymer thin films by taking advantage of chemical contrast at the 1s → π* transition (C=C).[Reference Virgili, Tao, Kortright, Balsara and Segalman1] Film thicknesses were near 50 nm, highlighting that RSoXS enables transmission measurements that are not possible with 10 keV x-rays. Further work revealed characteristic length scales associated with the microstructure of a variety of materials, such as polymer/fullerene mixtures and conjugated block copolymers.[Reference Guo, Lin, Witman, Smith, Wang, Hexemer, Strzalka, Gomez and Verduzco2–Reference Ye, Rongpipi, Litofsky, Lee, Culp, Yoo, Jackson, Wang, Gomez and Gomez15]
Working at edges that correspond to excitations of anisotropic orbitals, such as π orbitals, leads to a sensitivity on local orientation correlations if the x-rays are linearly polarized.[Reference Tumbleston, Collins, Yang, Stuart, Gann, Ma, You and Ade3,Reference Mezger, Jérôme, Kortright, Valvidares, Gullikson, Giglia, Mahne and Nannarone16 –Reference Collins, Cochran, Yan, Gann, Hub, Fink, Wang, Schuettfort, McNeill and Chabinyc23] As such, working in resonance with, for example, the carbon K-edge (~285 eV) can generate contrast, if a net alignment of orbitals exists within a domain, and if this net alignment differs between domains. Pioneering work revealed scattering from conjugated polymers and blends that varies azimuthally in intensity with respect to the polarization angle, as well as an x-ray energy dependence.[Reference Collins, Cochran, Yan, Gann, Hub, Fink, Wang, Schuettfort, McNeill and Chabinyc23] This scattering anisotropy, however, is challenging to interpret.[Reference Litofsky, Lee, Aplan, Kuei, Hexemer, Wang, Wang and Gomez22] For example, it is not clear what the absolute value of the anisotropy corresponds to. Reducing the scattering anisotropy against scattering vector q at an x-ray energy in resonance with 1s → π* excitations reveals characteristic length scales due to mesoscale order when domains have chains oriented in different ways.[Reference Litofsky, Lee, Aplan, Kuei, Hexemer, Wang, Wang and Gomez22,Reference Vakhshouri, Smith, Chan, Wang, Salleo, Wang, Hexemer and Gomez24] Nevertheless, predicting the scattering vector dependence is not trivial.
We have previously shown a simple model to predict scattering anisotropy from model structures.[Reference Litofsky, Lee, Aplan, Kuei, Hexemer, Wang, Wang and Gomez22] We explicitly represent crystalline domains with transition dipole moments (TDMs) aligned perpendicular to the backbone, as expected for conjugated polymers. Amorphous domains are represented by isotropic TDMs. Thus, scattering intensities are modulated by the alignment of TDMs with respect to the x-ray polarization, effectively by modulating the contrast. Predictions of scattering anisotropy of homopolymers and block copolymers reveal characteristic length scales in both materials and signatures of the chain orientation within domains; qualitatively, our predictions compare well with RSoXS data.[Reference Litofsky, Lee, Aplan, Kuei, Hexemer, Wang, Wang and Gomez22]
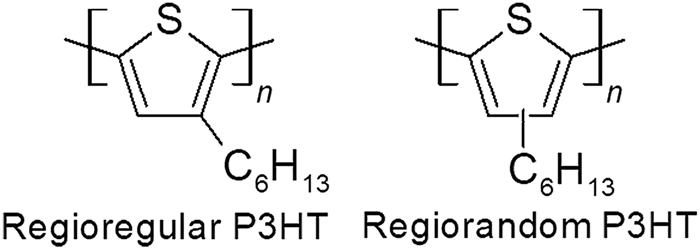
Here, we use our simple model to predict scattering anisotropy from a semicrystalline conjugated polymer as a function of crystallinity (local order). Our models show that scattering anisotropy should be maximized when the crystallinity is 50%. We verify these predictions using polarized RSoXS experiments of blends of regioregular and regiorandom poly(3-hexylthiophene-2,5-diyl) (P3HT, Fig. 1), where the blend composition dictates the crystallinity. Working at the 1s to π* transition (~285 eV) shows a maximum in scattering anisotropy when the crystallinity is 50.5%, or at a blend composition of 9:1 by mass of RR:RRa P3HT.
Chemical structures of regioregular and regiorandom P3HT (RR P3HT and RRa P3HT, respectively).

Materials and methods
Samples for RSoXS were prepared as described previously.[Reference Guo, Lin, Witman, Smith, Wang, Hexemer, Strzalka, Gomez and Verduzco2] Silicon wafers were cleaned using a non-ionic surfactant, followed by 20 min of sonication in acetone and then isopropanol, followed lastly with 20 min of ultraviolet light ozonation. Poly(3,4-ethylenedioxythiophene):poly(styrenesulfonate), PEDOT:PSS (Clevios P, Heraeus) was spincoated on cleaned silicon wafers at 4000 rpm for 120 s, leading to a thickness of about 65 nm. Substrates were transferred to a nitrogen glovebox. RR P3HT (Sigma Aldrich, M n = 19.5 kg/mol, Đ = 1.8 ) and RRa P3HT (Reike Metals, batch BS23-07, M n = 37.1 kg/mol, Đ = 2.2) were weighed in air and then brought into the glovebox for dissolution (10 mg/mL in chlorobenzene, stirred at 45°C overnight in a sealed container prior to spincasting). Molecular weights and dispersities were calculated through gel-phase chromatography using a polystyrene standard calibration. The percent regioregularity was calculated using 1H NMR by comparing the RR and RRa peaks. Results are tabulated in Supplementary Table S1.
After deposition by spincasting, films were removed from the glovebox and floated off the substrate in deionized water; they were consequently picked up with 5 mm × 5 mm silicon frames with a 1 mm × 1 mm, 100 nm thick Si3N4 window (Norcada NX5100A; 5 mm × 5 mm silicon frame; 1 mm × 1 mm 100 nm thick Si3N4 window). Samples were then dried for 3 h under vacuum and annealed in a hot plate at 165°C in a nitrogen glovebox for 20 min. RSoXS measurements were done at beamline 11.0.1.2 at the Advanced Light Source at Lawrence Berkeley National Laboratory.[Reference Gann, Young, Collins, Yan, Nasiatka, Padmore, Ade, Hexemer and Wang25] A transmission geometry was used under vacuum at the carbon K-edge energy (285 eV) with linearly polarized x-rays; data were corrected for dark current and beam flux.
Data were integrated azimuthally and plotted versus scattering vector [q = 4πsin(θ/2)/λ, θ is scattering angle, λ is the wavelength] and were corrected for dark counts. Additionally, data were integrated at orthogonal polar angles to determine the anisotropy ratio and plotted versus scattering vector.
Percent crystallinities of all polymer blends were determined by differential scanning calorimetry (DSC) using heating and cooling rates of 10°C/min from −50°C to 280°C. To minimize the effects of thermal history, the second and third heat cycles were used for analysis. Percent crystallinity was calculated as reported by Snyder:  $x_{\rm c} = (\Delta H/\Delta H_0)(T_{\rm m}^0 /T_{\rm m})*100$ where x c, ΔH, and T m are percent crystallinity, melting enthalpy, and melting temperature of the polymers, respectively, and ΔH 0 and
 $T_{\rm m}^0$ are melting enthalpy and melting temperature of P3HT with 100% crystallinity (39 J/g and 507 K).[Reference Snyder, Nieuwendaal, DeLongchamp, Luscombe, Sista and Boyd26,Reference Koch, Heeney and Smith27]
Results and discussion
Simulations of polarized RSoXS
Through a previously developed approach, we can calculate the predicted scattering of various polymer structures.[Reference Litofsky, Lee, Aplan, Kuei, Hexemer, Wang, Wang and Gomez22] Briefly, we begin with model structures of crystalline or semicrystalline polymers in 2D and consider scattering at the carbon absorption edge. We assign a TDM to each pixel within the polymer chains, with this TDM having an orientation perpendicular to the chain backbone, as is typical for the C 1s to π* transition (~285 eV). Model structures are aligned in a single direction, as a single grain, but we have previously shown that single grain and globally isotropic (multi-grain) structures yield the same predicted scattering anisotropy. This is due to the enhanced scattering at an energy resonant with TDMs in the direction of the x-ray polarization.[Reference Litofsky, Lee, Aplan, Kuei, Hexemer, Wang, Wang and Gomez22] Taking the Fourier transform of our model structure provides a reciprocal-space image, and from there, we can integrate the 2D Fourier transform across all polar angles to obtain the structure factor as a function of scattering vector q. The anisotropy in scattering is apparent by comparing intensities at orthogonal polar angles.
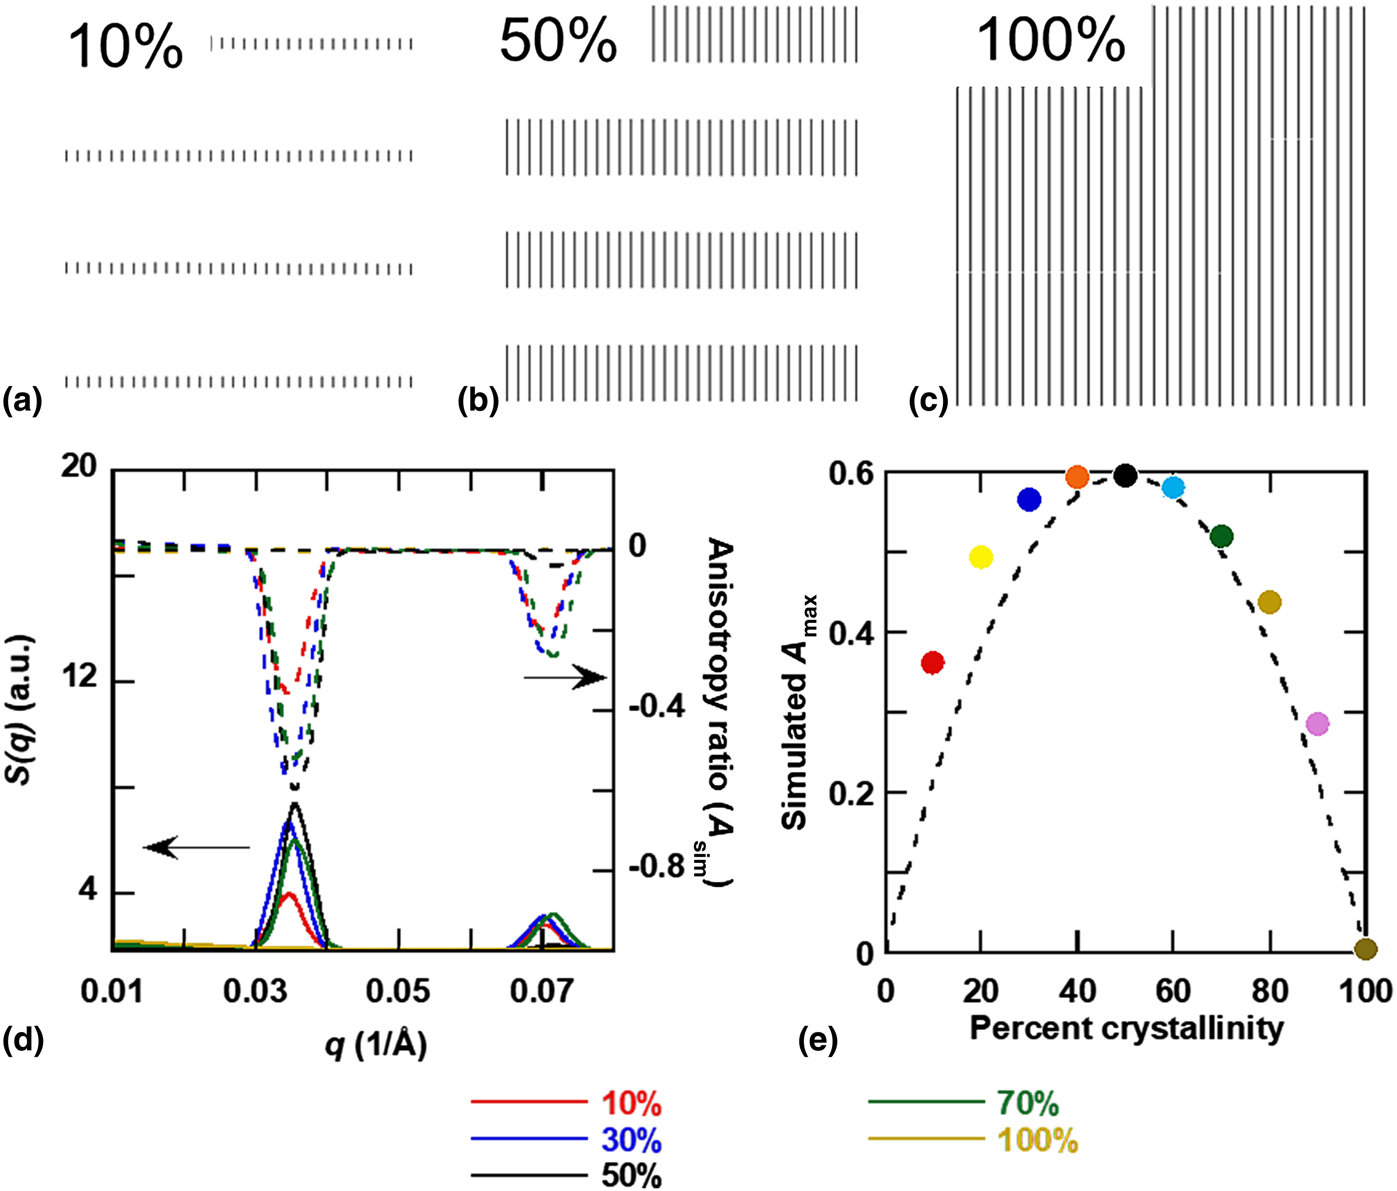
If crystals within domains are aligned with respect to interfaces, then crystallization will dictate a local net orientation of chain backbones and the amount of crystallinity in the sample will impact scattering anisotropy.[Reference Tumbleston, Collins, Yang, Stuart, Gann, Ma, You and Ade3, Reference Litofsky, Lee, Aplan, Kuei, Hexemer, Wang, Wang and Gomez22, Reference Gann, Young, Collins, Yan, Nasiatka, Padmore, Ade, Hexemer and Wang25, Reference Zhu, Tuchband, Young, Shuai, Scarbrough, Walba, Maclennan, Wang, Hexemer and Clark28, Reference Carpenter, Hunt and Ade29] It is tempting to assume a direct correlation between stronger local order or higher crystallinity with stronger scattering anisotropy.[Reference Tumbleston, Collins, Yang, Stuart, Gann, Ma, You and Ade3] We can examine this using our simple scattering model of anisotropy. Our previous work showed that indeed adding variability in domain size, spacing, or backbone orientation decreases scattering anisotropy.[Reference Litofsky, Lee, Aplan, Kuei, Hexemer, Wang, Wang and Gomez22] We can also directly modulate the crystallinity from 10% to 100%, by changing the relative fraction of the crystalline and amorphous domains (Fig. 2), and predict the scattering. We only modulate the crystal width and allow the length of crystals to be long, to simulate a fibril-like crystallization motif.
Examples of model structures used to simulate a change in crystallinity. Among the crystallinities used are (a) 10%, (b) 50%, and (c) 100%. (d) Simulated structure factor S(q) and scattering anisotropy A as a function of scattering vector q. (e) Magnitude of the anisotropy maximum is shown as a function of simulated percent crystallinity with quadratic fit shown as the dashed line [simulated A max = Ax c(1 − x c), A = 2.36]. Anisotropy is maximized at 50% crystallinity.

The simulated scattering as the structure factor S(q) is shown in Fig. 2(d). The anisotropy ratio is calculated as[Reference Litofsky, Lee, Aplan, Kuei, Hexemer, Wang, Wang and Gomez22]
 $$A_{{\rm sim}}\lpar q \rpar = \displaystyle{{S_{\gamma + 0^\circ} \lpar q \rpar -S_{\gamma + 90^\circ} \lpar q \rpar } \over {S_{\gamma + 0^\circ} \lpar q \rpar + S_{\gamma + 90^\circ} \lpar q \rpar }}$$
where A sim(q) is the simulated anisotropy ratio as a function of q, and S θ+0°(q) and S θ+90°(q) are the predicted scattering along the parallel and perpendicular directions to the tilt of the chain backbone (in this case γ = 0). The anisotropy ratio for samples that vary in crystallinity is shown in Fig. 2(d). For both the structure factor S(q) and the anisotropy ratio, the peaks are strongest when the crystallinity is 50%. Orientational contrast is maximized when equal amounts of crystalline and amorphous domains exist. Indeed, 100% crystalline structures do not show any anisotropy, because there is no contrast in the q range of interest (small-angle regime). The trend in scattering anisotropy is analogous to how contrast depends on composition, as ϕ(1 − ϕ), where ϕ is the volume fraction of one phase. Because we only consider the effect of local order on the scattering contrast and ignore effects of depolarization,[Reference Stone and Kortright30] the maximum in anisotropy with crystallinity is analogous to Babinet's principle of reciprocity between the scattering pattern generated from an object and a hole of the same shape.[Reference Born and Wolf31] Thus, the line in Fig. 2(e) is given as Ax c(1 − x c), where A is a constant and x c is the crystallinity, and we will use this fit to compare with experimental data below.
Polarized RSoXS experiments
We now experimentally test predictions of scattering anisotropy with respect to crystallinity. We modulate the crystallinity in P3HT by blending RR P3HT and RRa P3HT, given that RR P3HT is about 60% crystalline and RRa P3HT is fully amorphous.[Reference Lee, Aplan, Seibers, Xie, Culp, Wang, Hexemer, Kilbey, Wang and Gomez32–Reference Tremel, Ludwigs and Ludwigs42] Previous work suggests RRa P3HT mixes with the amorphous phase of RR P3HT, without incorporating into crystals.[Reference Wang, Rivnay, Himmelberger, Vakhshouri, Toney, Gomez and Salleo43,Reference Chu, Wang, Fu, Choi, Park, Srinivasarao and Reichmanis44] Thus, the motivation for adding RRa P3HT is to minimize the chance for macrophase separation while providing an avenue to modulate the crystallinity.
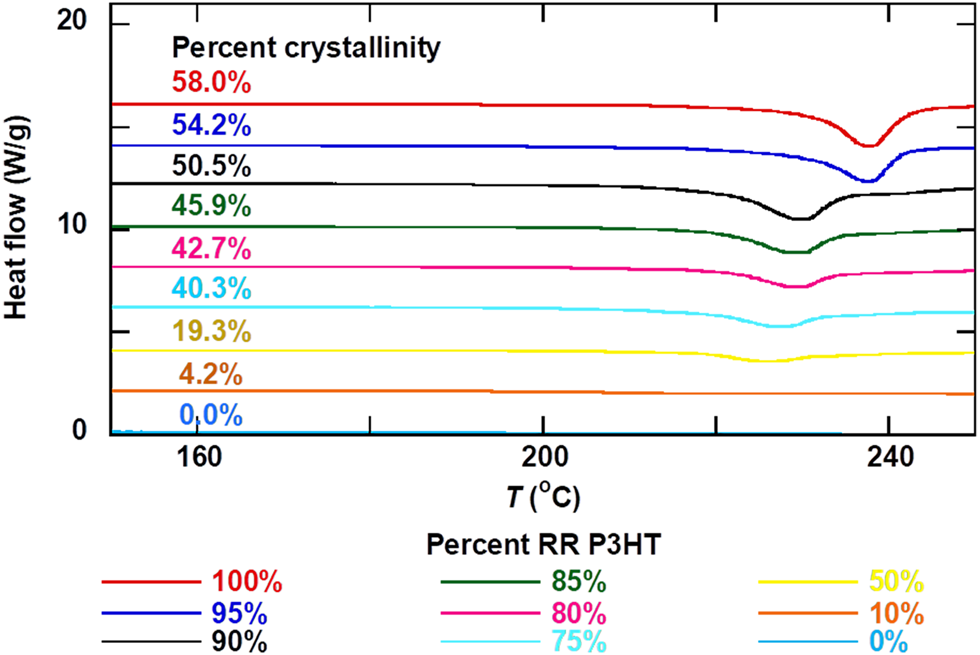
Using DSC, we determine the percent crystallinity in blends of RR and RRa P3HT. Thermograms are shown in Fig. 3. The percent crystallinity was determined from the heat of melting as described by Snyder (see experimental section) and can be seen in Supplementary Fig. S1 and Table S2.[Reference Snyder, Nieuwendaal, DeLongchamp, Luscombe, Sista and Boyd26] The crystallinity extracted from DSC is highest for neat RR P3HT, as expected, at 58.0%. For simplicity, we assume that the crystallinity in bulk blends is the same as thin films. The crystallinity declines linearly with amount of RRa P3HT, suggesting that RRa P3HT does not crystallize in the blends. At 90% RR P3HT loading, the crystallinity is approximately 50% (50.5%), which is where we find the highest scattering anisotropy from our scattering simulations [Fig. 2(d)].
DSC traces of RR/RRa P3HT blends. DSC traces used to determine absolute percent crystallinity.

Having developed a series of materials that systematically vary in crystallinity, we examine these samples as films using polarized RSoXS. Scattering data from films cast from 10 mg/mL chlorobenzene solutions with about 50 nm thicknesses are shown in Supplementary Fig. S2. Anisotropic scattering patterns are apparent, and these patterns rotate with x-ray polarization[Reference Vakhshouri, Smith, Chan, Wang, Salleo, Wang, Hexemer and Gomez24] but are independent of sample rotation.[Reference Litofsky, Lee, Aplan, Kuei, Hexemer, Wang, Wang and Gomez22] Supplementary Fig. S3 shows azimuthally integrated scattering profiles. We further reduce the data as the scattering anisotropy as a function of scattering vector q using the scattering parallel and perpendicular to the electric field of the incident x-rays with
 $$A\lpar q \rpar = \displaystyle{{I_{\gamma + 0^\circ} \lpar q \rpar -I_{\gamma + 90^\circ} \lpar q \rpar } \over {I_{\gamma + 0^\circ} \lpar q \rpar + I_{\gamma + 90^\circ} \lpar q \rpar }}$$
where A(q) is the anisotropy ratio and I(q) is the scattering intensity at a specific polar angle (for our samples, γ is nearly constant, between 5∘ and 7∘, Supplementary Table S3). The anisotropy ratio ranges from 1 to −1, where −1 indicates uniform chain alignment perpendicular to the interface between the semicrystalline and amorphous regions and 1 indicates parallel chain alignment with respect to this interface. The peak locations indicate the domain spacing between crystals.[Reference Litofsky, Lee, Aplan, Kuei, Hexemer, Wang, Wang and Gomez22]
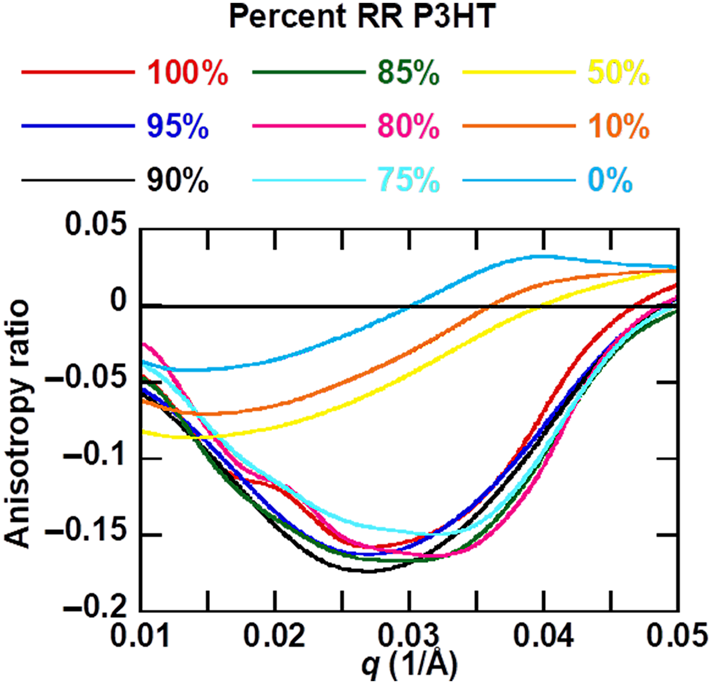
For all RR/RRa P3HT blends, the scattering anisotropy is mostly negative, corresponding to chain backbones aligned perpendicular to the crystal interface (consistent with a microfibril crystallization motif).[Reference Litofsky, Lee, Aplan, Kuei, Hexemer, Wang, Wang and Gomez22, Reference Vakhshouri, Smith, Chan, Wang, Salleo, Wang, Hexemer and Gomez24] The peak in the absolute value of the anisotropy starts at around q = 0.03 Å−1 for the higher RR blends and shifts towards lower q at lower RR loadings (Fig. 4). This domain spacing of 0.03 Å−1 corresponds to 21 nm, very close to the domain spacing between crystals that has been previously reported for RR P3HT using this same approach.[Reference Litofsky, Lee, Aplan, Kuei, Hexemer, Wang, Wang and Gomez22] As the amount of RRa P3HT is increased, the peak shifts to lower q, from about 0.03 to 0.017 Å−1. This shift to lower q corresponds to an increased spacing between crystals, as the amount of amorphous component is increased. The anisotropy shown in Fig. 4 is from films cast from chlorobenzene, but casting films from 1,2,4-trichlorobenzene results in even stronger anisotropy, as shown in Supplementary Fig. S4 (casting from chloroform results in lower anisotropy from P3HT films, as reported previously[Reference Litofsky, Lee, Aplan, Kuei, Hexemer, Wang, Wang and Gomez22]).
Anisotropy ratio as a function of q for blends of RR and RRa P3HT. The anisotropy ratio is maximized at 90% RR/10% RRa P3HT, corresponding to a 50.5% crystalline sample.

Even in samples with no crystallinity, there is a slight negative peak in the anisotropy ratio. One possibility is that side chains crystallize in these RRa samples.[Reference Pankaj and Beiner45] Another possibility is the presence of a nematic phase or anisotropic packing without crystallization, which has been speculated in other RRa-conjugated polymers.[Reference Steyrleuthner, Di Pietro, Collins, Polzer, Himmelberger, Schubert, Chen, Zhang, Salleo and Ade46]
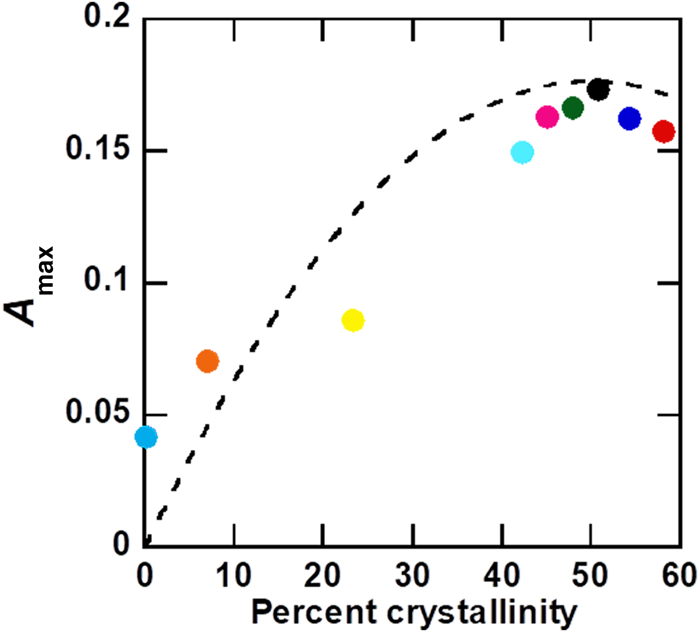
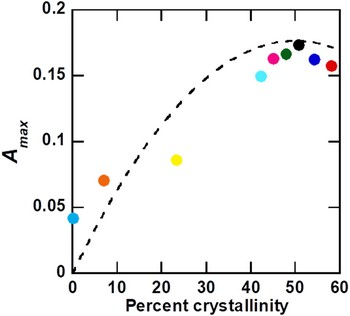
Figure 5 shows the maximum scattering anisotropy A max obtained from polarized RSoXS as a function of crystallinity. A max is highest for samples with 90% RR P3HT, which corresponds to 50.5% crystallinity. The dotted line in Fig. 5 is the curve fit to our simulation results shown in Fig. 2(d) with a scaling factor of 0.29 to aid in comparison. The scaling factor is needed because we do not account for defects that reduce predicted anisotropy in our model structures, such as variations in backbone angles within crystals, spacings between crystals, and misalignment in orientation between adjacent crystals.[Reference Litofsky, Lee, Aplan, Kuei, Hexemer, Wang, Wang and Gomez22] We have good agreement between scattering simulations and experiment, despite assuming that bulk crystallinities from DSC are the same as crystallinities in thin films that are cast from chlorobenzene and annealed at 165°C for 20 min. We speculate that crystallinities in P3HT are limited by the fibril-like crystal motif and chain entanglements, such that the maximum crystallinity is achieved relatively quickly at high temperatures[Reference Vakhshouri, Smith, Chan, Wang, Salleo, Wang, Hexemer and Gomez24,Reference Vakhshouri and Gomez47–Reference Jimison, Himmelberger, Duong, Rivnay, Toney and Salleo51] and further annealing has small effects on further crystallization. Thus, our work supports our simple simulations as a predictive tool of scattering anisotropy and highlights how the strength of the scattering anisotropy ratio depends on orientational contrast rather than total anisotropy or local order.
Magnitude of maximum anisotropy (from RSoXS) plotted against percent crystallinity (from DSC). Maximum anisotropy is at 50.5% crystallinity, corresponding to 90% RR/10% RRa P3HT. Dotted line shows a scaled quadratic fit to simulated anisotropy shown in Fig. 2(e).

Summary
In summary, we demonstrate that RSoXS scattering anisotropy is a result of orientational contrast between domains and is therefore not monotonically related to the total degree of order in the sample. A simple model supports our analyses of scattering data, and both simulation and experiment show a maximum in scattering anisotropy with 50% crystallinity. This is analogous to the maximum in scattering contrast between domains with respect to the volume fraction. Thus, polarized RSoXS can move beyond chemical and mass contrast, to examine local variations in chain orientation, and reveal subtle but important structural features of semicrystalline polymers used in organic electronics and other applications.
Supplementary material
The supplementary material for this article can be found at https://doi.org/10.1557/mrc.2019.119.
Acknowledgments
Financial support from the National Science Foundation under Award DMR-1626566 is acknowledged. Financial support from the Office of Naval Research under Grant N000141410532 is also acknowledged. The Advanced Light Source is supported by the Director, Office of Science, Office of Basic Energy Sciences, of the U.S. Department of Energy under Contract No. DE-AC02-05CH11231.