


1 Introduction
Motivated by large-scale fluid flows in the Earth’s ocean and atmosphere, and in the atmospheres of the gas-giant planets, all of which are strongly influenced by the planetary rotation and stable density stratification, we use quasi-geostrophic (QG) theory (see § 2) to study a set of vortex interaction problems of fundamental interest. They are particularly relevant to the recent discovery, by the Juno spacecraft, of circular arrays of vortices surrounding the poles of Jupiter (Adriani et al. Reference Adriani, Mura, Orton, Hansen, Altieri, Moriconi, Rogers, Eichstdt, Momary, Ingersoll, Filacchione, Sindoni, Tabataba-Vakili, Dinelli, Fabiano, Bolton, Connerney, Atreya, Lunine, Tosi, Migliorini, Grassi, Piccioni, Noschese, Cicchetti, Plainaki, Olivieri, ONeill, Turrini, Stefani, Sordini and Amoroso2018). As is well known, QG theory is the simplest mathematical model that self-consistently captures the essential dynamics of such flows, in which the potential vorticity (PV) distribution evolves nonlinearly by advection and from which the advecting velocity field is obtainable, together with the pressure and temperature fields, by PV inversion (Hoskins, McIntyre & Robertson Reference Hoskins, McIntyre and Robertson1985), solving an elliptic problem for given PV at each time step.
In flows of this kind, the PV field tends to self-organise into elongated structures such as jet streams and shear lines, or into compact structures such as vortices (e.g. Williams Reference Williams1978; Dritschel & McIntyre Reference Dritschel and McIntyre2008). In this paper, we investigate the linear stability and nonlinear evolution of an idealised shear line in the form of a torus of uniform PV, embedded in an otherwise uniformly rotating and linearly stratified three-dimensional fluid. We also investigate cases in which, at the outset, a compact vortex is introduced at the centre of the torus. Such cases turn out to be of special interest for Jupiter.
The torus is found to be generally unstable, depending on the ratio
 $R_{0}/r_{0}$
of its major (centreline) radius
 $R_{0}$
to its minor (cross-sectional) radius
 $r_{0}$
, and on the strength and size of the central vortex if any. For
 $R_{0}/r_{0}\gtrsim 5$
, the instability causes the torus to self-organise into an array of similar-sized vortices lying approximately on a circle. The number
 $m$
of vortices is typically equal to the azimuthal mode number of the most unstable mode of the torus. The value of
 $m$
increases with the radius ratio
 $R_{0}/r_{0}$
. The circular vortex array may itself be unstable and is sometimes dubbed ‘Thomson’s vortices’ after the seminal work of Thomson (Reference Thomson1883), who considered the stability properties of a circular array of identical, equally spaced point vortices, with no central vortex, governed by the two-dimensional Euler equations. (Henceforth, though, we use self-explanatory terms such as ‘circular vortex array’, or ‘circular
 $m$
-vortex array’ as appropriate.)
Thomson showed that his circular
 $m$
-vortex array is a steadily rotating equilibrium state, stable to small disturbances for
 $m\leqslant 7$
(marginally so for
 $m=7$
) and unstable for
 $m>7$
. Dritschel (Reference Dritschel1985) extended Thomson’s study to finite-sized, uniform-vorticity two-dimensional vortices governed by Euler’s equations, still with no central vortex, showing that
 $m=7$
vortices are then unstable and that
 $m<7$
vortices become unstable at a critical vortex size that increases with decreasing
 $m$
. Prior to that, Morikawa & Swenson (Reference Morikawa and Swenson1971) had extended Thomson’s point-vortex study by including a central point vortex and by generalising to the QG shallow-water model, which contains Euler’s equations as a special case. More recently, a corresponding set of problems including finite-volume as well as point vortices were addressed by Reinaud (Reference Reinaud2019) within the same three-dimensional, linearly stratified QG framework as in the present paper. Reinaud found that, in the absence of a central vortex, only
 $m\leqslant 5$
point vortices are stable while
 $m\geqslant 6$
are unstable, in contrast with Thomson’s results. Reinaud also found unstable finite-volume vortex configurations for any given
 $m$
when the vortices are larger than a critical size, which again increases with decreasing
 $m$
.
Precursors to the present torus problem include the work of Dritschel (Reference Dritschel1988) and Kossin & Schubert (Reference Kossin and Schubert2001) on its two-dimensional counterpart, an annulus of uniform PV, studying its early-time nonlinear evolution, and the work of Morel & Carton (Reference Morel and Carton1994) on the stability of an annulus plus a finite-sized central vortex.
In this paper we show that for
 $m\geqslant 3$
the three-dimensional QG torus self-organises into an approximately circular
 $m$
-vortex array, of approximately equal-sized vortices, which itself appears to be stable for just two values
 $m=4$
or
 $m=5$
on the evidence from long-time numerical integrations. The addition of a like-signed central vortex may stabilise arrays for which
 $m>5$
, in agreement with Reinaud (Reference Reinaud2019). In cases where the
 $m$
-vortex array is unstable, we find a rich variety of strongly nonlinear behaviours, including a case with
 $m=8$
where the central vortex undergoes chaotic outward migration and becomes the outermost vortex.
The paper is laid out as follows. First we recall the standard QG equations in § 2. This is followed by a treatment of the linear stability properties of the torus in § 3, with and without a central vortex. In cases of instability, the long-time nonlinear evolution is studied in § 4. Finally, some conclusions and perspectives for future research are offered in § 5, including a brief discussion of the cases
 $m=5$
and
 $m=8$
observed on Jupiter, near its south and north poles, respectively, in which stabilising central vortices are present.
2 Mathematical set-up
We consider a continuously stratified, rapidly rotating flow using QG theory under the Boussinesq approximation. In this study the fluid domain is taken to be infinite in all directions. The vertical direction
 $z$
coincides with the direction of gravity and the axis of the background rotation. The flow is inviscid and adiabatic. We define the Rossby number
 $Ro=U/(fL)$
and the Froude number
 $Fr=U/(NH)$
, where
 $U$
is a typical horizontal velocity scale,
 $f$
is the Coriolis frequency, assumed constant,
 $L$
is a typical horizontal length scale,
 $N$
is the buoyancy or Brunt–Väisälä frequency and
 $H$
is a typical vertical length scale. The Rossby number may also be seen as the ratio of a typical relative vertical vorticity
 $U/L$
to the planetary vorticity
 $f$
, while the Froude number may also be seen as the ratio of a typical horizontal vorticity
 $U/H$
to the buoyancy frequency
 $N$
. The QG model results from an asymptotic expansion in
 $Ro$
assuming
 $Fr\sim Ro\ll 1$
.
For simplicity we assume both
 $f$
and
 $N$
are constant. By using new coordinates in which the vertical coordinate is stretched by the ratio
 $N/f$
, the equations of motion become independent of both
 $f$
and
 $N$
. Hence the results presented in this paper are valid for all constant
 $N$
and
 $f$
.
The QG equations of motion consist of an inversion problem giving the streamfunction
 $\unicode[STIX]{x1D713}$
in terms of the QG PV,
 $$\begin{eqnarray}\frac{\unicode[STIX]{x2202}^{2}\unicode[STIX]{x1D713}}{\unicode[STIX]{x2202}x^{2}}+\frac{\unicode[STIX]{x2202}^{2}\unicode[STIX]{x1D713}}{\unicode[STIX]{x2202}y^{2}}+\frac{\unicode[STIX]{x2202}^{2}\unicode[STIX]{x1D713}}{\unicode[STIX]{x2202}z^{2}}=q,\end{eqnarray}$$
which is Poisson’s equation in Cartesian coordinates, together with an equation expressing material conservation of QG PV,
 $$\begin{eqnarray}\frac{\unicode[STIX]{x2202}q}{\unicode[STIX]{x2202}t}+u\frac{\unicode[STIX]{x2202}q}{\unicode[STIX]{x2202}x}+v\frac{\unicode[STIX]{x2202}q}{\unicode[STIX]{x2202}y}=0,\end{eqnarray}$$
where
 $$\begin{eqnarray}u=-\frac{\unicode[STIX]{x2202}\unicode[STIX]{x1D713}}{\unicode[STIX]{x2202}y}\quad \text{and}\quad v=\frac{\unicode[STIX]{x2202}\unicode[STIX]{x1D713}}{\unicode[STIX]{x2202}x}\end{eqnarray}$$
is the advecting geostrophic horizontal velocity – see Vallis (Reference Vallis2006) for details, and also Hoskins et al. (Reference Hoskins, McIntyre and Robertson1985, § 5b). The vertical velocity (appearing at second order in
 $Ro$
) is not involved in the advection of
 $q$
.
3 Linear stability
3.1 The basic state
We consider a torus centred at the origin and spanned by
 $n_{l}\gg 1$
horizontal layers of equal thickness
 $\unicode[STIX]{x1D6FF}z$
. Within the
 $k$
th horizontal layer, the torus boundary is represented by two contours, one at the inner boundary
 ${\mathcal{C}}_{k}^{-}$
and the other at the outer boundary
 ${\mathcal{C}}_{k}^{+}$
. There are therefore
 $n_{c}=2n_{l}$
contours altogether bounding the torus. The contours
 ${\mathcal{C}}_{k}^{\mp }$
lying at height
 $z_{k}$
with
 $|z_{k}|<r_{0}$
are initially circular with radii
 $r_{e}^{\mp }(z_{k})=R_{0}\mp \sqrt{r_{0}^{2}-z_{k}^{2}}$
. We denote by
 $\boldsymbol{r}_{e,k}^{\mp }(\unicode[STIX]{x1D703})$
the position vector of a point on the unperturbed circular contour
 ${\mathcal{C}}_{k}^{\mp }$
at azimuthal angle
 $\unicode[STIX]{x1D703}$
.
3.2 The disturbance equation
We next consider infinitesimal radial perturbations of the form
 $$\begin{eqnarray}r_{k}^{\mp }(\unicode[STIX]{x1D703},t)=r_{e}^{\mp }(z_{k})+\frac{\unicode[STIX]{x1D702}_{k}^{\mp }(\unicode[STIX]{x1D703},t)}{r_{e}^{\mp }(z_{k})},\end{eqnarray}$$
where
 $\unicode[STIX]{x1D702}_{k}$
has units of area (Dritschel Reference Dritschel1995). Owing to symmetry, we may express
 $\unicode[STIX]{x1D702}_{k}^{\mp }$
as
 $$\begin{eqnarray}\unicode[STIX]{x1D702}_{k}^{\mp }(\unicode[STIX]{x1D703},t)=\hat{\unicode[STIX]{x1D702}}_{k}^{\mp }\text{e}^{\unicode[STIX]{x1D70E}t+\text{i}m\unicode[STIX]{x1D703}},\end{eqnarray}$$
for each mode number
 $m$
. It should be noted that mode
 $m=1$
corresponds to a horizontal displacement of entire contours.
For an axisymmetric flow, in the linearised equations, the evolution of the disturbance area
 $\unicode[STIX]{x1D702}_{k}^{\mp }$
is governed by
 $$\begin{eqnarray}\left.\begin{array}{@{}c@{}}\begin{array}{@{}c@{}}\displaystyle {\displaystyle \frac{\unicode[STIX]{x2202}\unicode[STIX]{x1D702}_{k}^{\mp }}{\unicode[STIX]{x2202}t}}+\unicode[STIX]{x1D6FA}_{k}^{\mp }{\displaystyle \frac{\unicode[STIX]{x2202}\unicode[STIX]{x1D702}_{k}^{\mp }}{\unicode[STIX]{x2202}\unicode[STIX]{x1D703}}}={\displaystyle \frac{\unicode[STIX]{x2202}F_{k}^{\mp }}{\unicode[STIX]{x2202}\unicode[STIX]{x1D703}}},\end{array}\\ \begin{array}{@{}rcl@{}}\displaystyle F_{k}^{\mp }(\unicode[STIX]{x1D703})\; & =\; & \displaystyle -\mathop{\sum }_{l=1}^{n_{c}}\unicode[STIX]{x0394}q_{l}\left(\int _{0}^{2\unicode[STIX]{x03C0}}\unicode[STIX]{x1D702}_{l}^{+}(\unicode[STIX]{x1D703}^{\prime })G_{k,l}(|\boldsymbol{r}_{e,k}^{\mp }(\unicode[STIX]{x1D703})-\boldsymbol{r}_{e,l}^{+}(\unicode[STIX]{x1D703}^{\prime })|)\,\text{d}\unicode[STIX]{x1D703}^{\prime }\right.\\ \; & \; & \displaystyle -\left.\int _{0}^{2\unicode[STIX]{x03C0}}\unicode[STIX]{x1D702}_{l}^{-}(\unicode[STIX]{x1D703}^{\prime })G_{k,l}(|\boldsymbol{r}_{e,k}^{\mp }(\unicode[STIX]{x1D703})-\boldsymbol{r}_{e,l}^{-}(\unicode[STIX]{x1D703}^{\prime })|)\,\text{d}\unicode[STIX]{x1D703}^{\prime }\right),\end{array}\end{array}\!\!\right\}\end{eqnarray}$$
where
 $\unicode[STIX]{x1D6FA}_{k}^{\mp }$
is the constant basic-state angular velocity around contour
 ${\mathcal{C}}_{k}^{\mp }$
,
 $\unicode[STIX]{x0394}q_{l}$
is the PV jump across contour
 ${\mathcal{C}}_{l}^{\mp }$
(for a uniform-PV torus, all of the
 $\unicode[STIX]{x0394}q_{l}$
are equal), and
 $G_{k,l}(r)$
is the Green’s function giving the influence of a point in layer
 $l$
on a point in layer
 $k$
separated by a distance
 $r$
(see appendix A in Dritschel (Reference Dritschel2002) as well as Dritschel (Reference Dritschel1995) and Reinaud & Dritschel (Reference Reinaud and Dritschel2002) for the derivation of (3.3)).
3.3 The eigenvalue problem
Substituting
 $\unicode[STIX]{x1D702}_{k}$
and
 $\unicode[STIX]{x1D702}_{l}$
by their expressions in equation (3.2) leads to an eigenvalue problem involving a real matrix of size
 $2\times n_{c}$
squared – for each azimuthal mode number
 $m$
. The eigenvalues
 $\unicode[STIX]{x1D70E}$
are generally complex. The real part
 $\unicode[STIX]{x1D70E}_{r}$
is the growth rate while the imaginary part
 $\unicode[STIX]{x1D70E}_{i}$
is the frequency. Since the original system is Hamiltonian, if
 $\unicode[STIX]{x1D70E}$
is an eigenvalue, then so are
 $-\unicode[STIX]{x1D70E}$
,
 $\unicode[STIX]{x1D70E}^{\ast }$
and
 $-\unicode[STIX]{x1D70E}^{\ast }$
, where
 $^{\ast }$
denotes complex conjugation.
Without loss of generality, we take the uniform PV in the torus to be
 $q_{0}=2\unicode[STIX]{x03C0}$
(all PV jumps
 $\unicode[STIX]{x0394}q_{l}$
are then equal to
 $q_{0}$
). This defines a PV-based time scale
 $T_{PV}=6\unicode[STIX]{x03C0}/q_{0}=3$
, which physically corresponds to the rotation period of a spherical vortex of PV
 $q_{0}$
. The volume of the torus is exactly
 $V_{0}=2\unicode[STIX]{x03C0}^{2}R_{0}r_{0}$
. Without loss of generality we set
 $r_{0}=0.5$
so that the total vertical extent of the torus is
 $h_{0}=1$
. The layer thickness is then
 $\unicode[STIX]{x1D6FF}z=h_{0}/n_{l}=1/n_{l}$
.
3.4 Results
The results presented are obtained using the highest vertical resolution,
 $n_{l}=51$
. Smaller values of
 $n_{l}$
were used for testing and give closely similar results. Each contour
 ${\mathcal{C}}_{k}^{\mp }$
is discretised by an equal number of nodes,
 $n_{p}=400$
.
The growth rates
 $\unicode[STIX]{x1D70E}_{r}$
of the unstable modes are summarised in figure 1 for
 $1.2\leqslant R_{0}/r_{0}\leqslant 12$
. An increment in relative radius
 $R_{0}/r_{0}$
of
 $\unicode[STIX]{x0394}(R_{0}/r_{0})=0.2$
is used between cases. The frequencies of the modes are generally non-zero, and so the disturbances propagate while amplifying. We find that, for each
 $m$
, at most only one eigenvalue is found with
 $\unicode[STIX]{x1D70E}_{r}>0$
. This allows us to refer to
 $m$
as the ‘mode’ of instability.
Notably, the vertical eigenstructures of the modes are, with few exceptions, upright or quasi-barotropic in the sense of being nearly independent of
 $z$
, hence nearly free of vertical shear. The mid-levels near
 $z=0$
are generally most amplified, but the vertical variation is weak apart from near the top and bottom of the torus, where the amplitudes diminish.
The growth rates and frequencies of the modes for
 $R_{0}/r_{0}=7.2$
are summarised in table 1. The unstable modes, sorted in order of decreasing
 $\unicode[STIX]{x1D70E}_{r}$
, are
 $m=5$
, 6, 4, 7, 3 and 2.
Overall, we find that unstable modes with increasing azimuthal mode number
 $m$
appear sequentially as
 $R_{0}/r_{0}$
increases. Thus thick tori with small
 $R_{0}/r_{0}$
are most unstable to low
 $m$
, while thin tori are most unstable to relatively high
 $m$
. As
 $R_{0}$
increases, the perimeter of the torus increases, allowing more room to fit disturbances of a characteristic wavelength
 $\unicode[STIX]{x1D706}$
. Qualitatively,
 $m\propto R_{0}/r_{0}$
. When
 $R_{0}/r_{0}\gg 1$
, figure 1 indicates that a number of modes have closely comparable growth rates. This is important for the nonlinear dynamics discussed in § 4.
The growth-rate curves
 $\unicode[STIX]{x1D70E}_{r}$
versus
 $R_{0}/r_{0}$
have a similar shape for each mode
 $m>1$
. Indeed, for each
 $m$
except
 $m=1,2$
, there is a region of neutral stability
 $\unicode[STIX]{x1D70E}_{r}=0$
for
 $R_{0}/r_{0}$
less than a threshold which depends on
 $m$
. This means that most modes are neutrally stable for thick tori. The value of this threshold in
 $R_{0}/r_{0}$
increases with
 $m$
, nearly proportionally.
For
 $m=2$
, our results indicate that
 $\unicode[STIX]{x1D70E}_{r}\rightarrow 0$
as
 $R_{0}/r_{0}\rightarrow 1$
, the limit where the innermost edge of the torus shrinks to a point. As
 $R_{0}/r_{0}$
increases,
 $\unicode[STIX]{x1D70E}_{r}$
first reaches a maximum then slowly decreases to
 $0$
as
 $R_{0}/r_{0}\rightarrow \infty$
.
Finally, the relatively weak
 $m=1$
instability is associated, exceptionally, with a vertical shearing of the torus, in which the mid-section at
 $z=0$
is displaced relative to the edges at
 $z=\pm r_{0}$
(as deduced from the vertical eigenstructure). The
 $m=1$
instability also occurs when a central vortex is present (see below), and can be much stronger in this case. There is no analogue of this instability in the two-dimensional case of a vorticity annulus; then
 $m=1$
corresponds to a uniform displacement of the entire vortex and is thus neutrally stable (Dritschel Reference Dritschel1986).
Growth rates
 $\unicode[STIX]{x1D70E}_{r}$
of the unstable modes versus the torus normalised radius
 $R_{0}/r_{0}$
for
 $1\leqslant R_{0}/r_{0}\leqslant 12$
, with
 $\unicode[STIX]{x0394}(R_{0}/r_{0})=0.2$
. Symbols indicate the azimuthal mode number of the mode:
 $m=1\;(\times )$
, 2 (●), 3 (▪), 4 (♦), 5 (▴), 6 (○), 7 (▫), 8 (♢), 9 (▵), 10 (▾), 11 (▹), 12 (◂). The vertical line marks the case
 $R_{0}/r_{0}=7.2$
which is further detailed in table 1.

Mode numbers
 $m$
, growth rates
 $\unicode[STIX]{x1D70E}_{r}$
and frequencies
 $\unicode[STIX]{x1D70E}_{i}$
of the six most unstable modes (arising as complex conjugate pairs) for
 $R_{0}/r_{0}=7.2$
.

3.5 The influence of a central vortex
We next consider the influence of a spherical vortex of uniform PV
 $q_{c}$
and of radius
 $r_{c}=r_{0}$
located at the centre of the torus. The sphere then has the same vertical extent as the torus. The linear stability method is readily extended to include an extra contour in each layer bounding the central vortex – see Reinaud & Dritschel (Reference Reinaud and Dritschel2002) for the general framework.
Four cases are considered with
 $q_{c}/q_{0}=1,~-1,~3$
and
 $-3$
. We consider tori with radius ratios
 $2.2\leqslant R_{0}/r_{0}\leqslant 12$
. The limiting case
 $R_{0}/r_{0}=2$
corresponds to when the central vortex touches the innermost edge of the torus.
The growth rates of the unstable modes are presented in figures 2 and 3, the latter showing a zoom of the small
 $R_{0}/r_{0}$
region where growth rates are significantly larger. First of all, the results converge as
 $R_{0}/r_{0}$
increases since (i) the influence of the central vortex weakens as
 $R_{0}/r_{0}$
increases, and (ii) a spherical vortex alone is stable and is expected to be stable for a distant toroidal PV distribution (
 $R_{0}/r_{c}\gg 1$
). Results, however, differ for small to moderate values of
 $R_{0}/r_{0}$
. The modes most affected by the presence of the central vortex have
 $m\leqslant 3$
. The curves
 $\unicode[STIX]{x1D70E}_{r}$
versus
 $R_{0}/r_{0}$
are almost identical for
 $m\geqslant 4$
, with a slight increase in
 $\unicode[STIX]{x1D70E}_{r}$
for decreasing
 $q_{c}/q_{0}$
. An opposite-signed central vortex is destabilising, while a like-signed one is stabilising, except for small
 $R_{0}/r_{0}$
.
For a like-signed central vortex, the peak growth rates are shifted to larger
 $R_{0}/r_{0}$
, but a second instability emerges at small
 $R_{0}/r_{0}$
as shown in figure 3, which focuses on the range
 $2.02\leqslant R_{0}/r_{0}\leqslant 3$
. In this range of
 $R_{0}/r_{0}$
, in particular near the limiting case
 $R_{0}/r_{0}=2$
, several unstable modes with large growth rates appear. Recall that, when
 $R_{0}/r_{0}=2$
, the central vortex touches the innermost edge of the torus. These unstable modes are therefore associated with the strong shear created in the gap between the sphere and the torus. This shear enables waves propagating on the two vortices to phase-lock and therefore grow. The shear is opposite and therefore stabilising for an opposite-signed central vortex. Finally, figure 3 shows that thick tori surrounding a central vortex can be unstable to mode
 $m=1$
. This mode predominantly displaces the central vortex towards a portion of the inner edge of the torus, the whole disturbance having relatively little vertical shear.
Growth rates
 $\unicode[STIX]{x1D70E}_{r}$
of the unstable modes versus the torus normalised radius
 $R_{0}/r_{0}$
for
 $2.2\leqslant R_{0}/r_{0}\leqslant 12$
, with
 $\unicode[STIX]{x0394}(R_{0}/r_{0})=0.2$
, and for a central spherical vortex of radius
 $r_{c}=r_{0}$
. The PV ratio between the central vortex and the torus is (a)
 $q_{c}/q_{0}=1$
, (b)
 $q_{c}/q_{0}=-1$
, (c)
 $q_{c}/q_{0}=3$
and (d)
 $q_{c}/q_{0}=-3$
. Symbols indicate the azimuthal wave number of the mode:
 $m=1$
 $(\times )$
, 2 (●), 3 (▪), 4 (♦), 5 (▴), 6 (○), 7 (▫), 8 (♢), 9 (▵), 10 (▾), 11 (▹), 12 (◂).

Growth rates
 $\unicode[STIX]{x1D70E}_{r}$
of the unstable modes versus the torus normalised radius
 $R_{0}/r_{0}$
for (a)
 $q_{c}/q_{0}=1$
and (b)
 $q_{c}/q_{0}=3$
covering the range
 $2.02\leqslant R_{0}/r_{0}\leqslant 3$
, with
 $\unicode[STIX]{x0394}(R_{0}/r_{0})=0.02$
. Symbols are the same as used in figure 2.

4 Nonlinear evolution
We next investigate the nonlinear evolution of the torus for various values of
 $R_{0}/r_{0}$
. We first consider the torus alone, then include a central vortex.
4.1 Numerical method
Numerical simulations are conducted using the purely Lagrangian contour surgery algorithm (Dritschel Reference Dritschel1988; Dritschel & Saravanan Reference Dritschel and Saravanan1994) developed for unbounded QG flow in Dritschel (Reference Dritschel2002). Time integration is performed using a fourth-order Runge–Kutta algorithm with a PV-controlled time step
 $\unicode[STIX]{x0394}t=2\unicode[STIX]{x03C0}/(20\max (|q_{0}|,|q_{c}|))$
which is the standard setting. Node redistribution and contour surgery are periodically carried out (approximately every eight time steps) to maintain resolution and to limit the complexity of the contours. We use a dimensionless node-spacing parameter of
 $\unicode[STIX]{x1D707}=0.15$
and a large-scale length
 $\ell =d_{0}=2r_{0}=1$
, the diameter of the torus section. From these, for consistency, the surgical cutoff length is
 $\unicode[STIX]{x1D6FF}=\unicode[STIX]{x1D707}^{2}\ell /4=5.625\times 10^{-3}$
. These are standard parameter choices (Dritschel Reference Dritschel1988). The torus is represented by contours in 51 layers in all numerical experiments, unless stated otherwise. Initial conditions are the basic state plus numerical noise only, unless stated otherwise.
4.2 Torus evolution
We first consider a thick torus with
 $R_{0}/r_{0}=2$
. The most unstable mode has
 $m=2$
and its normalised growth rate is
 $\unicode[STIX]{x1D70E}_{r}/q_{0}=3.86\times 10^{-2}$
. The nonlinear evolution of the torus is presented in figure 4. In this simulation, disturbances grow from the background numerical noise arising from truncation errors and the finite discretisation of the vortex. The mode
 $m=2$
clearly emerges as the torus deforms. Two opposite parts then approach and eventually merge, creating a bridge of PV. The subsequent evolution is complex and the three-dimensional structure of the vortex becomes highly convoluted. The inner region initially devoid of PV at the centre of the torus cannot disappear since, at each height, the area of this region is conserved. Instead, it becomes split and further fragmented in time from
 $t=50$
onwards. At late times, due to contour surgery, this area may escape to the exterior (not shown).
Evolution of a uniform-PV torus with
 $R_{0}/r_{0}=2$
. The view is from the top showing all of the bounding contours (at all heights
 $z$
) at
 $t=0,~40,~49$
and
 $61$
. The same view is used in subsequent figures of the flow evolution, unless otherwise stated. In panel (d) only contours in every fifth layer are shown. If all contours were included, then the figure would be almost black with contours.

Evolution of a uniform-PV torus with
 $R_{0}/r_{0}=4$
. Top view of the bounding contours at
 $t=0,~23,~29$
,
 $35$
,
 $40$
,
 $50$
,
 $60$
and
 $85$
. In panels (e–h) only contours in every fifth layer are shown. If all contours were included, then the figure would be almost black with contours.

Next consider a thinner torus with
 $R_{0}/r_{0}=4$
. The most unstable mode is now
 $m=3$
with
 $\unicode[STIX]{x1D70E}_{r}/q_{0}=5.94\times 10^{-2}$
. However, there are two competing instabilities:
 $m=4$
with
 $\unicode[STIX]{x1D70E}_{r}/q_{0}=4.70\times 10^{-2}$
, and
 $m=2$
with
 $\unicode[STIX]{x1D70E}_{r}/q_{0}=3.44\times 10^{-2}$
. Figure 5 shows the evolution in this case, perturbed only by numerical noise. The
 $m=3$
mode emerges first and dominates the evolution. The torus nearly breaks into three vortices but not before the main parts of the torus collapse and merge near the origin, leaving a small triangular hole there. The concentration of PV around the origin is compensated by the ejection of tongues of PV further away, primarily to conserve angular impulse
 $J=\iiint _{V}q(x^{2}+y^{2})\,\text{d}V$
. The tips of these tongues of PV begin to roll up at late times since the shear (or differential rotation) associated with the collapsed central region is too weak to keep them filamentary. The later evolution is complex; a large portion of PV merges into a large vortex near the centre encircled by a sea of secondary vortices and small-scale debris.
Evolution of a uniform-PV torus with
 $R_{0}/r_{0}=6$
. Top view of the bounding contours at
 $t=0,~20,~50$
and
 $140$
.

For larger
 $R_{0}/r_{0}\geqslant 6$
, the general topology of the late-time PV distribution changes significantly. Figure 6 shows the evolution of an unstable torus having
 $R_{0}/r_{0}=6$
. The three most unstable modes are
 $m=4$
with
 $\unicode[STIX]{x1D70E}_{r}/q_{0}=6.20\times 10^{-2}$
,
 $m=5$
with
 $\unicode[STIX]{x1D70E}_{r}/q_{0}=6.11\times 10^{-2}$
, and
 $m=3$
with
 $\unicode[STIX]{x1D70E}_{r}/q_{0}=4.85\times 10^{-2}$
. For illustration purposes and due to the close proximity of the growth rates of modes
 $m=4$
and
 $5$
, a small-amplitude disturbance is initially introduced to excite the most unstable mode
 $m=4$
. The torus self-organises into a four-vortex circular array within a sea of low-energy filaments and very small vortices. Unlike in the previous cases, the vortices remain far away from each other and do not merge together. The four vortices instead rotate around the centre of the domain in a quasi-stable manner until at least
 $t=1000$
, the end of the simulation. There is no indication that the quasi-periodic rotation of the four main vortices would cease or change significantly for longer integration times. The stability of the circular four-vortex array could have been anticipated from the linearly stable QG four-point-vortex case studied in Reinaud (Reference Reinaud2019).
The situation is similar for
 $R_{0}/r_{0}=7.2$
, with
 $m=5$
the most unstable mode (figure 7), again paralleling the linearly stable five-point-vortex case of Reinaud (Reference Reinaud2019). The growth rates of the six most unstable modes on a torus with
 $R_{0}/r_{0}=7.2$
were listed in table 1. In this case the
 $m=5$
mode is significantly more unstable than the closest competitors
 $m=6$
and
 $m=4$
, and dominates the nonlinear evolution even without the introduction of a small initial disturbance favouring it. Figures 7 and 8 show that a circular five-vortex array rapidly forms, then persists at least until the end of the simulation
 $t=1000\simeq 333\,T_{PV}$
, with no indication of significant change at later times.
Since
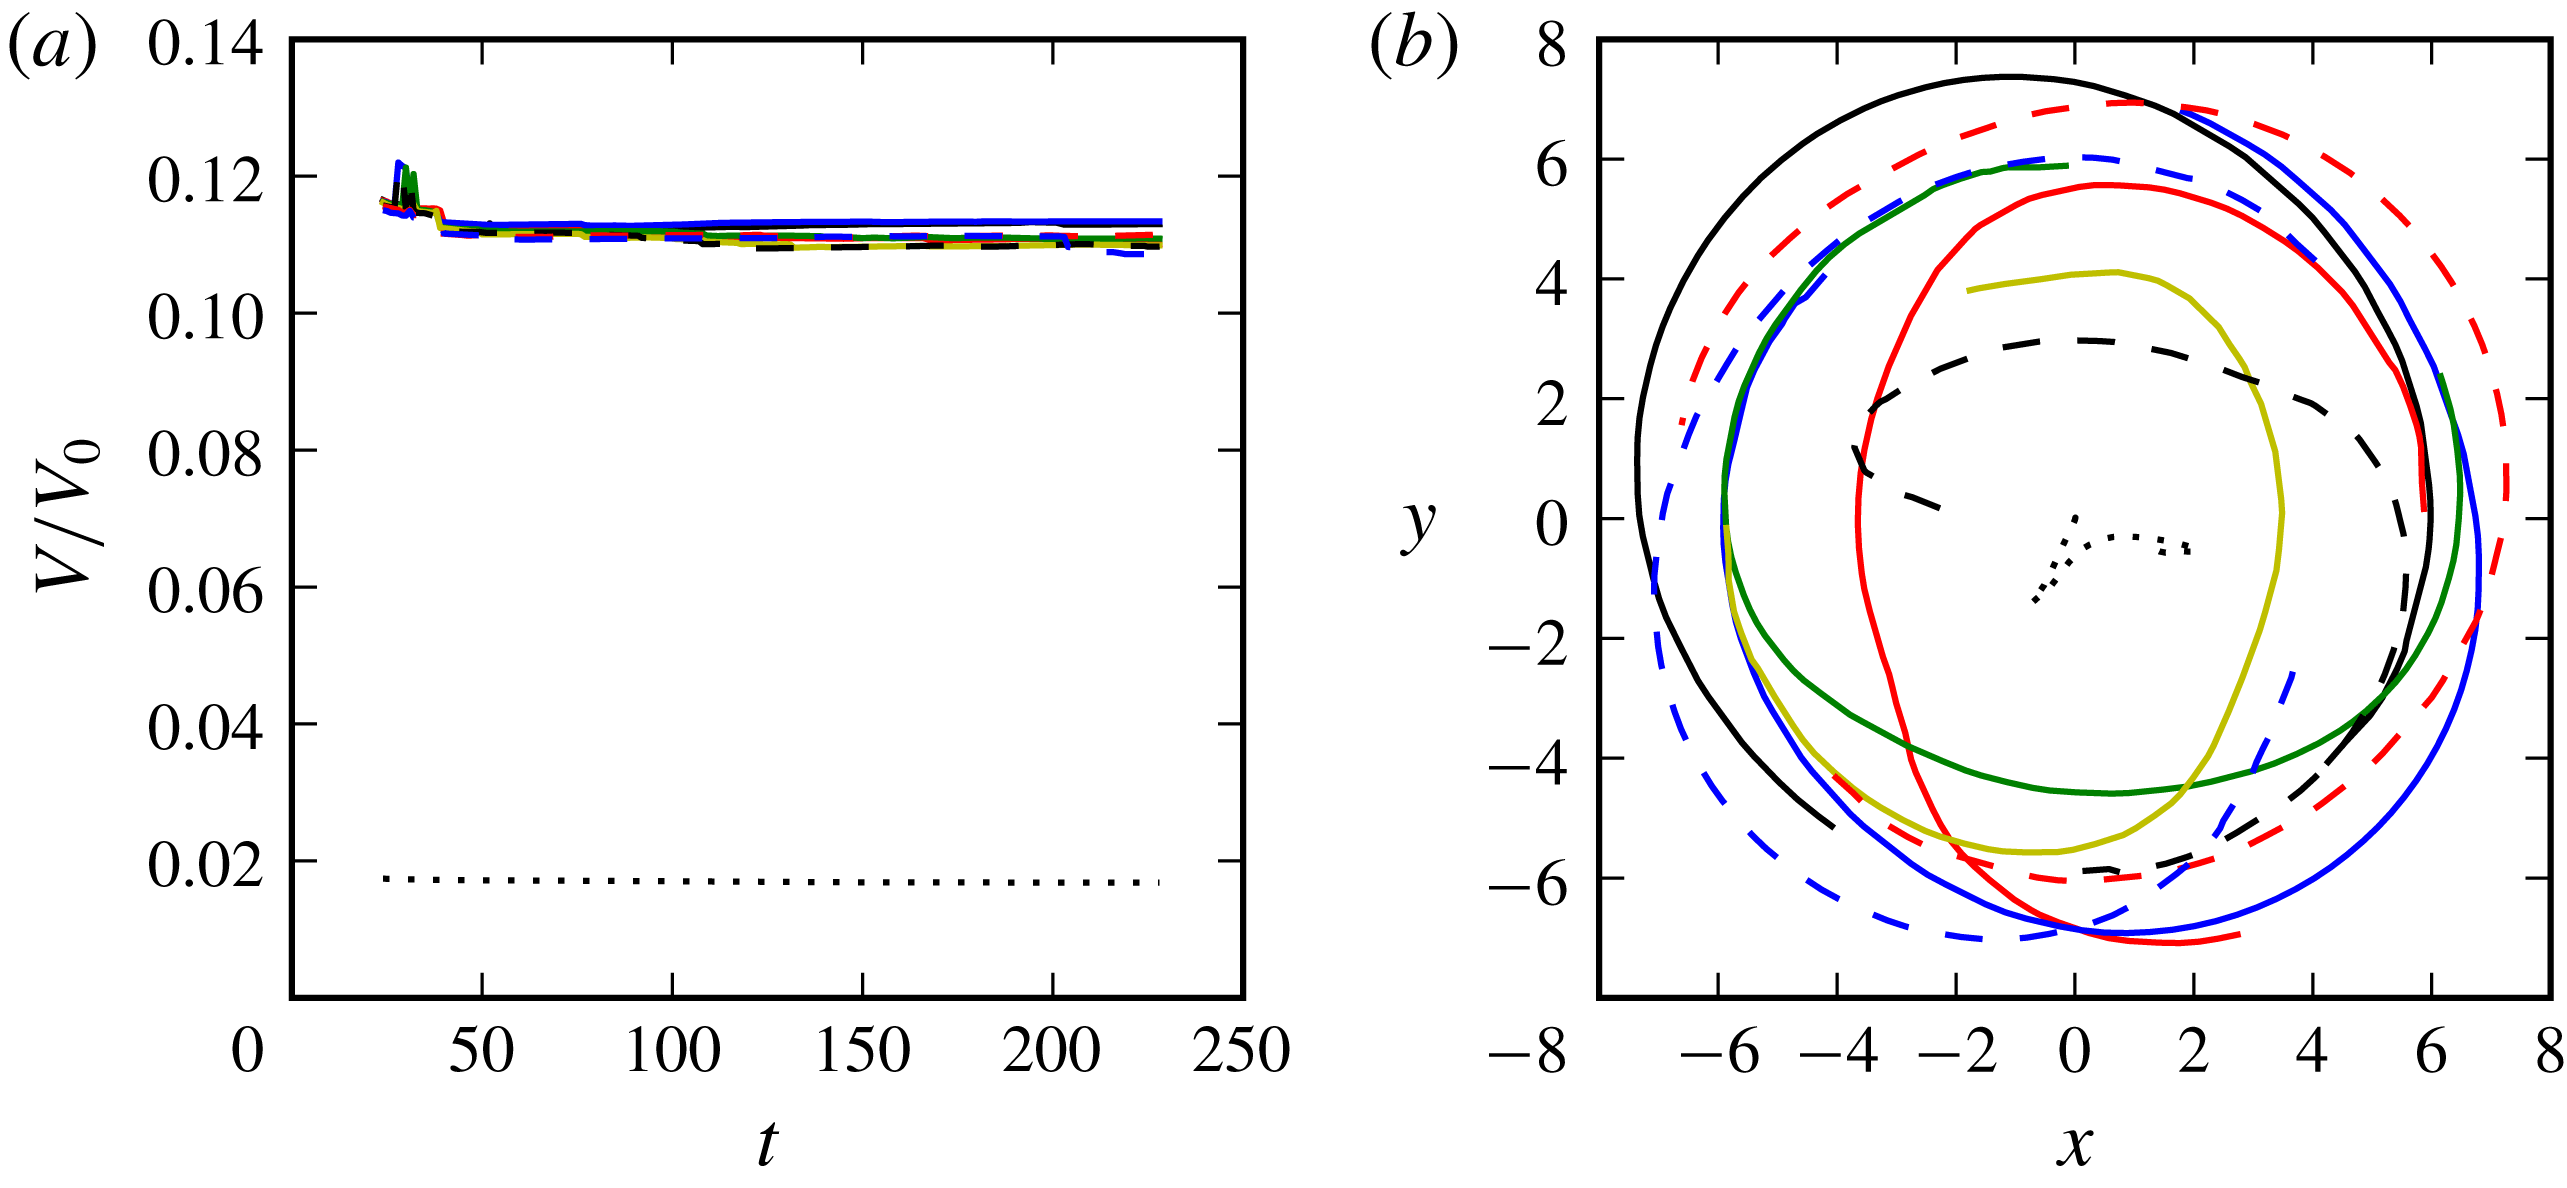
 $m=5$
is not the only unstable mode, other unstable modes play a role in the deformation of the torus. As a result, the five vortices which emerge differ in volume by up to 9 %. The evolution of the volumes of the five largest vortices identified in the simulation after the destabilisation of the torus is shown in figure 9. The structures are identified as contiguous regions of PV (horizontally and vertically). The fluctuations in volume are associated with the erosion or absorption of filaments and debris from and into the vortices. Figure 9 also shows the near-circular trajectories of the five vortex centroids, confirming the stable nature of the quasi-periodic rotation. The stability of the five-vortex array is striking considering that the volume fluctuations may be regarded as a significant perturbation to a configuration of five otherwise identical vortices.
Evolution of a uniform-PV torus with
 $R_{0}/r_{0}=7.2$
. Top view of the bounding contours at
 $t=0,~26,~129$
and
 $408$
.

Orthographic view of the PV field at an angle of
 $60^{\circ }$
from the vertical for the torus with
 $R_{0}/r_{0}=7.2$
at
 $t=100$
. The horizontal lines indicate the vertical extent of the domain of view, here
 $|z|\leqslant 0.5$
. Flow structures seen through the lower front face are slightly faded.

(a) Volume fraction
 $V/V_{0}$
of the five largest vortices formed by the instability of a torus with
 $R_{0}/r_{0}=7.2$
. (b) Near-circular trajectories of the vortex centroids for
 $40\leqslant t\leqslant 900$
.

Evolution of a uniform-PV torus with
 $R_{0}/r_{0}=8$
. Top view of the bounding contours at
 $t=0,~40,~90$
and
 $161$
.

Reinaud (Reference Reinaud2019) showed that a circular array of six identical point vortices is weakly unstable. The instability expresses itself as a small-amplitude oscillation in the radial coordinate of the point vortices, with neighbouring vortices in antiphase. For a torus, the most unstable mode is
 $m=6$
when
 $R_{0}/r_{0}=8$
, and the normalised growth rate is
 $\unicode[STIX]{x1D70E}_{r}/q_{0}=6.53\times 10^{-2}$
. But there are many competing modes, and the second most unstable mode is
 $m=5$
with
 $\unicode[STIX]{x1D70E}_{r}/q_{0}=6.32\times 10^{-2}$
. In order to favour the formation of six vortices and examine their long-time stability, we introduce a small disturbance with the spatial structure of the most unstable mode. The evolution is shown in figure 10. The initial stages are similar to the previous cases for
 $m=4$
and
 $5$
. The wave
 $m=6$
amplifies along the torus and rapidly leads to the formation of six vortices. However the six-vortex array is unstable and oscillates between two states, of which the first is a circular six-vortex array (as in figure 10
b) and the second a staggered six-vortex array, the vortices being displaced inwards and outwards alternately. In the second state (figure 10
c), the six vortices are close to forming a triangle.
Evolution of a uniform-PV torus with
 $R_{0}/r_{0}=10$
. Top view of the bounding contours at
 $t=0,~60,~105$
and
 $200$
.
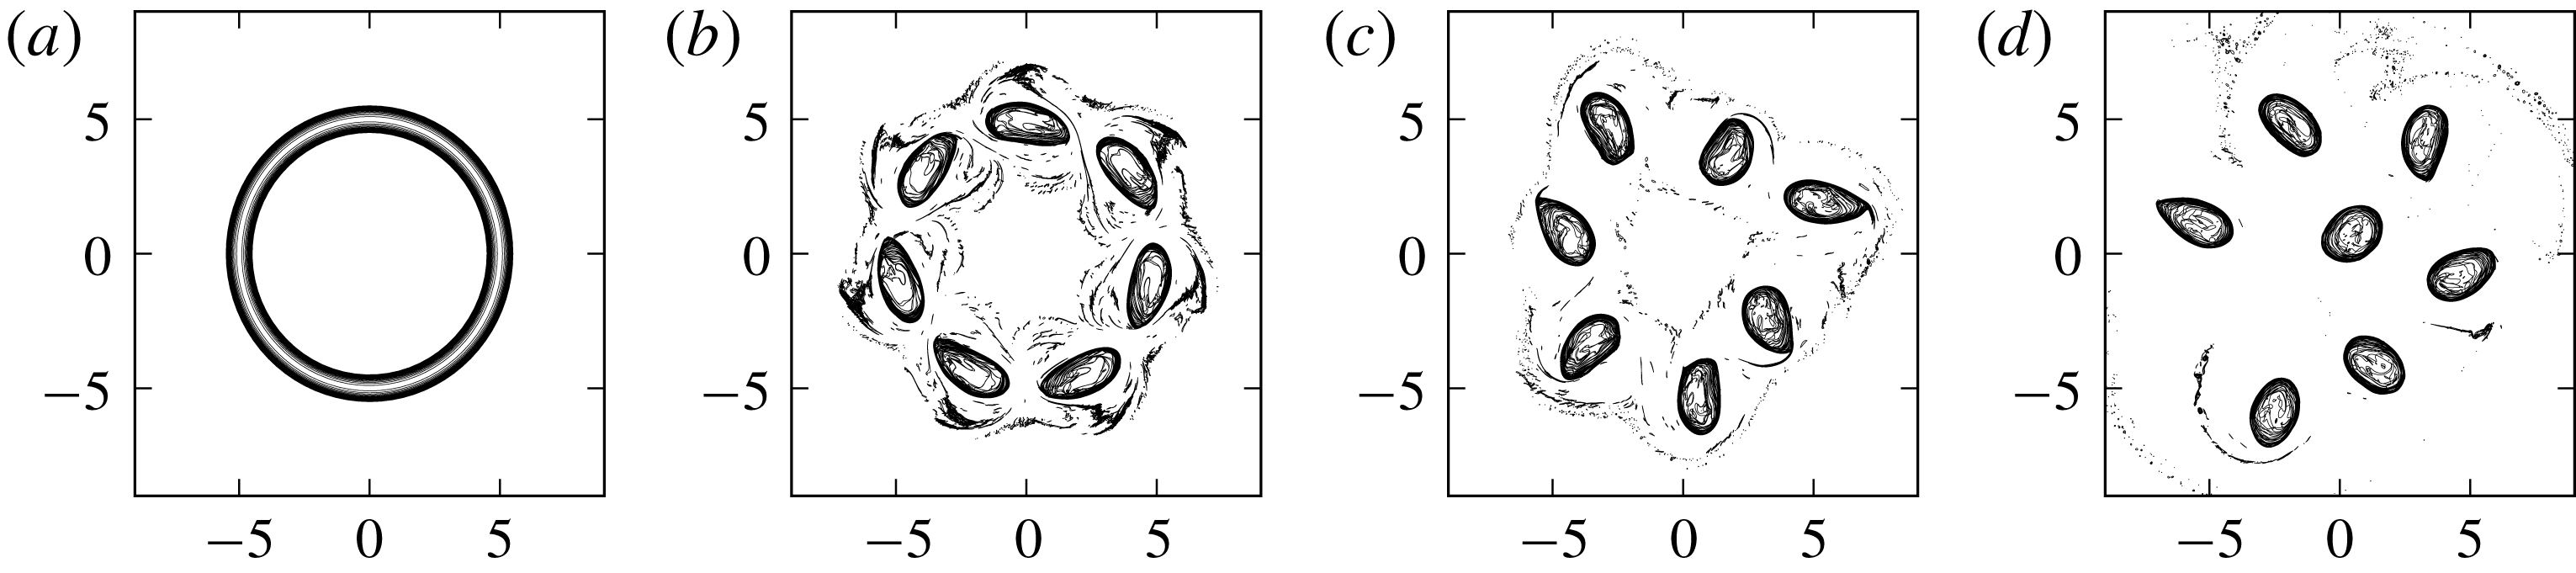
For
 $R_{0}/r_{0}=10$
, the most unstable mode has
 $m=7$
with
 $\unicode[STIX]{x1D70E}_{r}/q_{0}=6.67\times 10^{-2}$
. The second most unstable mode has
 $m=8$
with
 $\unicode[STIX]{x1D70E}_{r}/q_{0}=6.41\times 10^{-2}$
. For illustrative purposes, the
 $m=7$
mode is initially excited by a small-amplitude disturbance. The evolution of the flow is presented in figure 11. Growth of the
 $m=7$
mode leads to the formation of a circular seven-vortex array with vortices of roughly equal size. The array is unstable, however, again as anticipated from the point-vortex results of Reinaud (Reference Reinaud2019). The array undergoes a kind of irregular staggering (figure 11
c) followed by migration of one of the vortices towards the centre of the domain (figure 11
d). From then on, the configuration appears robust and persistent in time, with the same vortex staying near the centre.
Such persistence is consonant with the fact that a circular array of six identical point vortices together with an identical central vortex is linearly stable (Reinaud Reference Reinaud2019), even though, due to asymmetries, the arrangement of peripheral vortices is far from regular in figure 11(d). We note further that conservation of angular impulse
 $J$
implies that the motion of one of the vortices towards the centre must be accompanied by an overall outward motion of the others, or at least some of them. The peripheral vortices take turns at being the outermost vortex.
Evolution of a uniform-PV torus with
 $R_{0}/r_{0}=12$
. Top view of the bounding contours at
 $t=0,~20,~60,~82,~92,~112,~132$
and
 $200$
.

Orthographic view of the PV field at an angle of
 $60^{\circ }$
from the vertical for the torus with
 $R_{0}/r_{0}=12$
at
 $t=92$
.

(a) Volume fraction
 $V/V_{0}$
of the eight largest vortices formed by the instability of a torus with
 $R_{0}/r_{0}=12$
. (b) Trajectories of the vortex centroids for
 $60<t<170$
.

Finally, consider a torus with
 $R_{0}/r_{0}=12$
, the largest value examined. The six most unstable modes and their growth rates are listed in table 2. For illustrative purposes, we again initially introduce a small-amplitude disturbance corresponding to the most unstable mode
 $m=8$
. The evolution of the flow is presented in figures 12 and 13. Following the initial growth of the
 $m=8$
mode, a circular eight-vortex array is formed around
 $t=20$
, persisting until
 $t\simeq 75$
. At this stage the vortices stagger, with four vortices moving inwards and four outwards, alternately. The vortex configuration resembles a square for
 $90\lesssim t\lesssim 100$
. Then the relative motion of the vortices accentuates and becomes less regular, as shown in figure 12(f–h). The inward motion of four of the vortices is associated with the shedding of filaments.
The subsequent loss of volume within these vortices can be seen in figure 14(a). Figure 14(b) confirms the inward motion of these vortices. This motion is, however, irregular due to the accumulation of asymmetries. This causes some vortices to get close enough to each other to merge briefly before breaking apart. These interactions are known as ‘weak exchange’ or ‘partial merger’ depending on the volume of material exchanged by the two vortices (see Reinaud & Dritschel Reference Reinaud and Dritschel2002). At least seven instances of such interactions occur by
 $t=1000$
, the end of the simulation. The important point is that the eight vortices generated early on do not remain in a stable configuration, but nor do they readily merge with one another. Figure 14(a) shows that their volumes settle down to being roughly constant, and indeed that they stay within approximately 10 % of
 $V_{0}/8$
at least until
 $t=170$
.
Mode numbers
 $m$
, growth rates
 $\unicode[STIX]{x1D70E}_{r}$
and frequencies
 $\unicode[STIX]{x1D70E}_{i}$
for the six most unstable modes (arising as complex conjugate pairs) when
 $R_{0}/r_{0}=12$
.

When an initial eigenmode disturbance is not added, the evolution of the torus with
 $R_{0}/r_{0}=12$
is more complex (see figure 15). Recall from table 2 that in this case several modes with similar growth rates are unstable. The evolution shown in figure 15 is asymmetric due to a strong competition between modes. Here, disturbances grow from numerical noise, which depends on resolution, and hence the outcome of the instability also depends on resolution. The outcome can also depend on external forcing not included in the current work. We conclude that the evolution of thin tori is sensitive to disturbances within the surrounding flow. On the other hand, thicker tori, for which fewer modes are unstable and for which one mode has a growth rate significantly larger than the others, tend to evolve more symmetrically. As an example, the torus with
 $R_{0}/r_{0}=7.2$
in figure 7 self-organises into a persistent five-vortex array even in the absence of an initial eigenmode disturbance.
Evolution of the unstable uniform PV torus with
 $R_{0}/r_{o}=12$
perturbed by pseudo-random numerical noise only: top view on the vortex bounding contours at
 $t=20,~30,~40$
and 55.

4.3 Torus plus central vortex evolution
Reinaud (Reference Reinaud2019) found that a like-signed central vortex may stabilise a circular eight-vortex array. We next examine if this is also possible for finite vortices emerging from the instability of a torus when a central vortex is also present. We also explore other cases when the central vortex is not strong enough to stabilise the configuration but is still able to ensure quasi-regular behaviour to late times.
Evolution of a uniform-PV torus with
 $R_{0}/r_{0}=12$
and a spherical central vortex with
 $r_{c}/r_{0}=1$
and
 $q_{c}/q_{0}=1$
. Top view of the bounding contours at
 $t=0,~50,~100,~149,~237,~239,~243$
and
 $249$
.

(a) Volume fraction
 $V/V_{0}$
of the nine largest vortices formed from the torus in figure 16. (b) Trajectories of the vortex centroids for
 $24<t<228$
.
We first consider the same torus
 $R_{0}/r_{0}=12$
as in figure 12, but now with a spherical vortex of the same uniform PV
 $q_{c}=q_{0}=2\unicode[STIX]{x03C0}$
, and of radius
 $r_{c}=r_{0}$
. Hence the central vortex has a volume
 $V_{c}=V_{0}/(18\unicode[STIX]{x03C0})$
. The strength
 $q_{c}V_{c}$
of the central vortex is therefore small not only in comparison with the strength of the whole torus but also in comparison with one-eighth thereof, the order of magnitude for an individual vortex in the expected circular eight-vortex array. The evolution of the flow is shown in figure 16. Since the central vortex is weak, the overall evolution of the flow is closely similar to the previous case without a central vortex. The torus first forms a circular eight-vortex array, as expected (figure 16
b), followed by staggering (figure 16
c). Significant differences appear when the inward-moving four vortices get close to the central vortex. For a while, the central vortex remains almost equidistant from these four peripheral vortices, limiting their further inward motion. Owing to the build-up of asymmetries, two vortices eventually move further inwards while two back outwards. At a later stage of the evolution, the small central vortex becomes close enough to one of the large peripheral vortices and the two vortices partially merge, generating a slightly larger structure and a small secondary one. Nonetheless, the vortex volumes remain approximately constant, as shown in figure 17(a). The merged vortex moves towards the centre of the domain, while the other vortices organise into an irregular array around it (see figure 17
b). Similar behaviour has been observed in simulations using fewer layers, for both
 $n_{l}=21$
and
 $n_{l}=15$
.
Evolution of a uniform-PV torus with
 $R_{0}/r_{0}=12$
and a spheroidal central vortex with
 $V_{0}/V_{c}=16$
,
 $h_{c}/r_{0}=1$
and
 $r_{c}/r_{0}=1.88$
. Top view of the bounding contours at
 $t=0,~90,~130,~500,~700,~800,~900$
and
 $1000$
.

Next consider the effect of a larger, initially spheroidal central vortex with the same PV
 $q_{c}=q_{0}$
and half-height
 $h_{c}=r_{0}=0.5$
as before, but with a larger horizontal radius
 $r_{c}>r_{0}$
corresponding to an oblate spheroid such that
 $V_{c}=V_{0}/16$
, half the expected strength of a peripheral vortex. This results in a spheroid of horizontal radius
 $r_{c}=\sqrt{(3\unicode[STIX]{x03C0}/32)(R_{0}/r_{0})}r_{0}\simeq 1.88r_{0}$
. To favour the formation of eight peripheral vortices, the torus and central vortex are initially perturbed by the
 $m=8$
eigenmode.
The flow evolution is shown in figure 18. Comparing figure 18 with figures 12 and 16, we see that the evolution of the flow is similar to the previous cases, from the formation of the circular eight-vortex array followed by staggering and then irregular motion. The main difference from the case with no central vortex is the time scale over which the flow evolves after the formation of the eight-vortex array. In the present case with the larger, like-signed central vortex, the eight vortices formed from the torus appear by
 $t\simeq 24$
, but these only reorganise into a square-like configuration by
 $t\simeq 100$
. The configuration remains square-like (approximately) until
 $t\simeq 230$
. Eventually, due to the build-up of asymmetries, one of the peripheral vortices interacts strongly with the central vortex, and the two vortices start to rotate around each other. This is clearly visible in the vortex centroid trajectories shown in figure 19. Eventually, one the peripheral vortices moves close to the centre of the domain, taking the place of the initially central vortex, and the remaining vortices move in an irregular way without merging. The initially central vortex, which is smallest in size, moves furthest out and slowly migrates around the group of vortices as a whole.
(a) Volume fraction
 $V/V_{0}$
of the nine largest vortices formed from the torus in figure 18. (b) Trajectories of the vortex centroids for
 $25<t<388$
.

We next consider a larger central vortex with the same PV,
 $q_{c}=q_{0}$
, but with volume
 $V_{c}=V_{0}/8$
comparable to the volume of a peripheral vortex. This requires
 $r_{c}=\sqrt{(3\unicode[STIX]{x03C0}/16)(R_{0}/r_{0})}\,r_{0}\simeq 2.64r_{0}$
. In this case we use
 $R_{0}/r_{0}=11.8$
to ensure that the most unstable mode is
 $m=8$
. A circular eight-point-vortex array with an equal-strength, like-signed central vortex is linearly stable (Reinaud Reference Reinaud2019), so we expect to see the analogue of this here after the destabilisation of the torus. As in the previous case, we take the half height of the central vortex to be the same as that of the torus,
 $h_{c}=r_{0}$
, and again give it the same PV,
 $q_{c}=q_{0}$
. We only increase the horizontal radius
 $r_{c}$
to
 $r_{c}\simeq 2.64r_{0}$
. The initial configuration is weakly perturbed by the
 $m=8$
eigenmode.
The flow evolution is shown in figure 20. As previously, an eight-vortex array forms, but it now appears to remain stable for the entire period of integration up to
 $t=1000$
. The same is observed using a lower vertical resolution of
 $n_{l}=15$
layers. There is no evidence that the configuration formed will ever change significantly.
Evolution of a uniform-PV torus with
 $R_{0}/r_{0}=11.8$
and a spheroidal central vortex with
 $V_{0}/V_{c}=8$
,
 $h_{c}/r_{0}=1$
and
 $r_{c}/r_{0}=2.64$
. Top view of the bounding contours at
 $t=0,~110,~230$
and
 $1000$
.

In the last case studied, we examine a much thicker torus with a like-signed spherical central vortex. Recall that thick tori, for which the most unstable mode is either
 $m=2$
or
 $m=3$
, do not self-organise into regular vortex arrays (see figures 4 and 5 for
 $R_{0}/r_{0}=2$
and
 $4$
, respectively). Consider then a torus with
 $R_{0}/r_{0}=2.4$
and a central vortex with
 $h_{c}=r_{c}=r_{0}$
and
 $q_{c}=q_{0}$
. This equilibrium state lies in a region of the parameter space containing a large number of competing unstable modes arising from the strong shear between the central vortex and the inner side of the torus (see figure 3
a). The flow evolution at early times is shown in figure 21. The central vortex and the inner part of the torus deform mostly through a combination of modes
 $m=3$
and
 $2$
. Eventually the central vortex and torus merge, creating three bridges of PV at the edges of the deformed central vortex. The complexity of the flow then grows rapidly. The central vortex and the torus later merge into a large compound structure, most visible in figure 21(d–h). Notably, the early evolution in figure 21(a–c) is quasi-barotropic, as the contours at opposite heights nearly coincide. This is consistent with the vertical eigenstructures of the linearly unstable modes discussed in § 3.4. At later times, however, vertical asymmetries develop and accelerate the growth in complexity of the flow.
Evolution of a uniform-PV torus with
 $R_{0}/r_{0}=2.4$
, and a spherical central vortex with
 $r_{c}/r_{0}=1$
and
 $q_{c}/q_{0}=1$
. Top view of the bounding contours at
 $t=0,~11,~14,~22,~26,~30$
and
 $35$
. In panels (f–h) only contours in every fifth layer are shown. If all contours were included, then the figure would be almost black with contours.

5 Conclusion and discussion
We have investigated the formation of circular vortex arrays arising from the instability of a torus of uniform potential vorticity in an unbounded quasi-geostrophic (QG) flow under the Boussinesq approximation, with and without a central vortex. We have also investigated the subsequent nonlinear evolution.
We have first shown that a torus of uniform potential vorticity is unstable to azimuthally wavy disturbance modes, over a large range of torus radius ratios
 $R_{0}/r_{0}$
. The azimuthal mode number
 $m$
of the most unstable such disturbance increases with
 $R_{0}/r_{0}$
, roughly in proportion to it. The most unstable mode has azimuthal length scale comparable to
 $2r_{0}$
, the diameter of the cross-section of the torus.
In the nonlinear dynamics, an unstable mode with azimuthal wavenumber
 $m>3$
leads to the formation of a circular array of
 $m$
vortices initially lying along the mean radius of the torus. The configuration is stable for
 $m=4$
and 5 but unstable otherwise. For
 $m\geqslant 6$
the growth of a subharmonic instability staggers the vortices.
When a central vortex is introduced, the linear and nonlinear evolutions are modified. When the central vortex has the same sign of potential vorticity as the torus, and has a strength comparable to or larger than a vortex in the circular array, the array is kept stable apparently indefinitely. Weaker central vortices can still lead to quasi-regular vortex evolution without any merging, over long times, such as oscillatory staggering.
A question currently under investigation, and to be reported on in future work, is the effect of a vertical offset of the central vortex above or below the torus. In the Boussinesq model, which provides a good approximation for the ocean over modest height scales, the sign of the offset is immaterial. However, the Boussinesq model does not accurately account for the exponential density stratification typical of planetary atmospheres, including the Earth’s and Jupiter’s. The quasi-geostrophic model can account for this stratification by the introduction of a new length scale, the density scale height
 $H$
, while retaining the simplicity of an unbounded geometry (Scott & Dritschel Reference Scott and Dritschel2005). The sign of the offset then matters, as interactions decay more rapidly upwards but more slowly downwards (Hoskins et al.
Reference Hoskins, McIntyre and Robertson1985, equations (33); Scott & Dritschel Reference Scott and Dritschel2005). The formation and stability of circular vortex arrays are likely to depend on
 $H$
, especially when this height is comparable to the minor radius
 $r_{0}$
of the torus. This is ongoing research which will bring us a step closer to understanding, for instance, the formation and longevity of circular vortex arrays such as those recently observed near Jupiter’s poles (Adriani et al.
Reference Adriani, Mura, Orton, Hansen, Altieri, Moriconi, Rogers, Eichstdt, Momary, Ingersoll, Filacchione, Sindoni, Tabataba-Vakili, Dinelli, Fabiano, Bolton, Connerney, Atreya, Lunine, Tosi, Migliorini, Grassi, Piccioni, Noschese, Cicchetti, Plainaki, Olivieri, ONeill, Turrini, Stefani, Sordini and Amoroso2018).
Acknowledgements
The authors would like to thank M. E. McIntyre, especially for his helpful comments on an early draft of this paper that greatly improved the final version.



