
I. INTRODUCTION
NiTi shape memory alloys (SMAs) are functional materials which undergo martensitic transformations. Reference Otsuka and Waymann1,Reference Funakubo2 Depending on the Ni-content, they can show the one way effect (1WE) and pseudo-elasticity (PE). Reference Otsuka and Waymann1–Reference Frenzel, Wieczorek, Opahle, Maaß, Drautz and Eggeler4 SMAs are used in engineering and medical technology, Reference Van Humbeeck5,Reference Duerig, Pelton and Stöckel6 with good static Reference Pushin, Stolyarov, Valiev, Lowe and Zhu7–Reference Grossmann, Frenzel, Sampath, Depka, Oppenkowski, Somsen, Neuking, Theisen and Eggeler9 and cyclic toughness. Reference Robertson, Pelton and Ritchie10–Reference Fähler, Rößler, Kastner, Eckert, Eggeler, Emmerich, Entel, Müller, Quandt and Albe13 Fracture mechanisms in PE SMAs are of recent interest. Reference Baxevanis and Lagoudas14–Reference Baxevanis, Landis and Lagoudas24 Gollerthan et al. Reference Gollerthan, Herberg, Baruj and Eggeler15–Reference Gollerthan, Young, Neuking, Ramamurty and Eggeler17 used compact tension (CT) specimens to study the behavior of cracks in NiTi SMAs. Their experiments focused on the formation of the pseudoelastic zone around the crack-tip and showed that cracks always propagate into microstructures consisting of favorably oriented martensite variants. Synchrotron experiments revealed that stress-induced martensite forms in a region extending almost 2 mm at the front of the crack tip. Reference Gollerthan, Young, Baruj, Frenzel, Schmahl and Eggeler16 Thermography experiments showed the heat effects associated with the forward and reverse martensitic transformations. Reference Gollerthan, Young, Baruj, Frenzel, Schmahl and Eggeler16,Reference Gollerthan, Young, Neuking, Ramamurty and Eggeler17 The synchrotron experiments revealed the butterfly shaped elastic strain distribution around the crack-tip. Reference Young, Gollerthan, Baruj, Frenzel, Schmahl and Eggeler19 Finite element calculations of the PE zone around the crack-tip support the experimental results. Reference Baxevanis and Lagoudas14,Reference Baxevanis, Chemisky and Lagoudas21–Reference Freed and Banks-Sills26 Forward transformation during loading improves fracture toughness and reduces the size of the stress affected zone in front of the crack-tip. Reference Baxevanis and Lagoudas14,Reference Baxevanis, Chemisky and Lagoudas21–Reference Freed and Banks-Sills26 Reverse transformation during unloading can counteract this toughness enhancement. Reference Stam and Giessen25,Reference Freed and Banks-Sills26
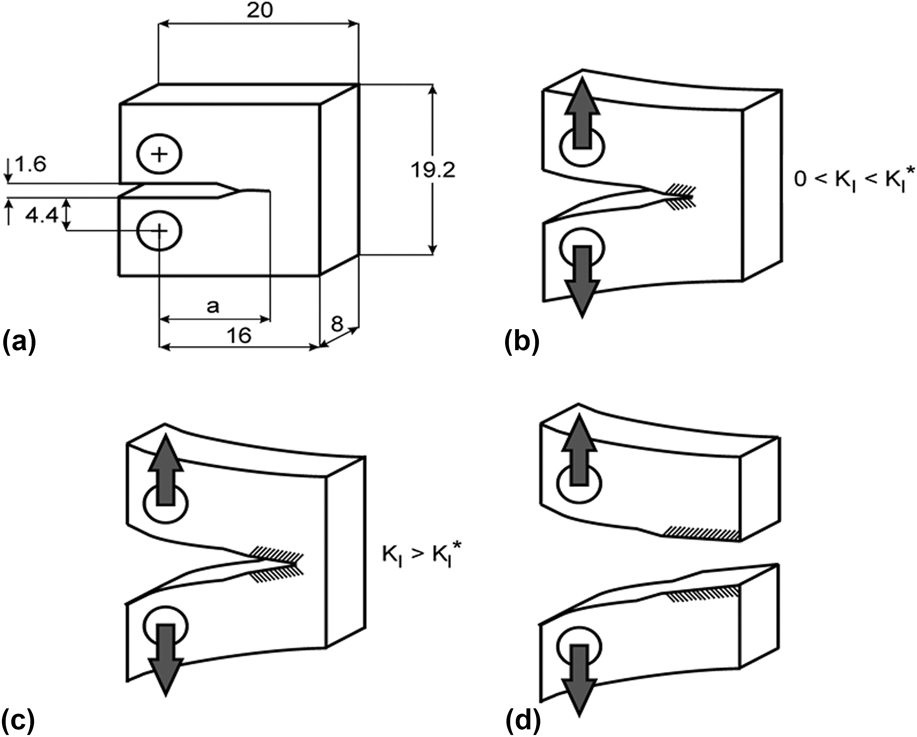
Figure 1 shows the schematic sequence of the main steps in testing fracture. Reference Gollerthan, Herberg, Baruj and Eggeler15 Above the critical stress intensity, K I*, the crack starts growing. Figure 1(a) shows the dimensions of our CT specimen. For 0 < K I < K I* only the grips are strained. The crack propagates when K I > K I*. Figure 1(c) shows the crack before rupture, and Fig. 1(d) shows the ruptured state. To understand crack propagation in SMAs we have to understand stress-induced martensitic transformation along with dislocation plasticity in the stress affected zone ahead of the crack-tip.
Fracture mechanics applied in the present work. (a) Geometry of our CT specimen, schematic illustration showing (b) mechanical loading prior to crack-growth (c) unstable crack-growth when K I* is reached, (d) fracture. The dashed regions represent the volume close to the fracture surface, which is investigated in the present work through XRD profile analysis. All numbers are scales in mm.

In the present work we investigate the ruptured CT-specimen shown in Fig. 1(d) using X-ray line profile analysis. We determine the extension of the true plastic zone around the primary crack-tip by determining the dislocation density in the plastically deformed material and the volume fraction of irreversible martensite as a function of the distance from the precracked primary crack-tip and the depth below the fracture surface. We show that adjacent to the fracture surface, where stress-induced martensite does not transform back to austenite, (i) the irreversible martensite is stabilized by enhanced dislocation densities in the austenite and martensite components and (ii) that this zone is about one order of magnitude smaller than the pseudoelastic zone determined by in situ synchrotron experiments on similar specimens. Reference Baxevanis and Lagoudas14,Reference Gollerthan, Young, Baruj, Frenzel, Schmahl and Eggeler16
II. EXPERIMENTAL
A. Sample
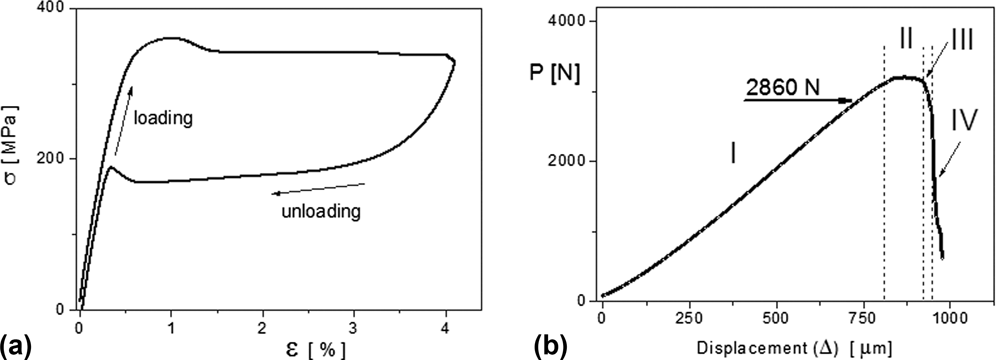
The present work was performed on a pseudoelastic NiTi material, described in more detail in Refs. Reference Gollerthan, Herberg, Baruj and Eggeler15 and Reference Gollerthan, Young, Baruj, Frenzel, Schmahl and Eggeler16. We used CT specimens of 50.7 at.% Ni showing pseudoelastic behavior at room temperature. A sharp crack-tip of about 1.08 mm length was produced by fatigue precracking. The crack propagation tests and conventional tensile tests were carried out in a tensile test machine of type Z100 equipped with a climate chamber to ensure a constant temperature of 20 °C. Displacements were determined using an extensometer of type MTS 632.13F-23. A typical stress–strain curve of our material is shown in Fig. 2(a). The stress–strain plateaus in Fig. 2(a) correspond to the formation of stress-induced martensite during loading and to the reverse transformation during unloading. The displacement controlled load–displacement, P–Δ, curve of our specimen is shown in Fig. 2(b). The figure shows a short stable crack-growth region, denoted as II. This is followed by the fast unstable crack-growth region III, where the load drops abruptly. In the last region, IV, the force is mainly compressive.
(a) Typical stress strain curve with the long pseudoplastic plateau at room temperature during loading in a uniaxial tensile test. (b) The applied load, P as a function of displacement, Δ of the grips in the CT specimen investigated in the present work.

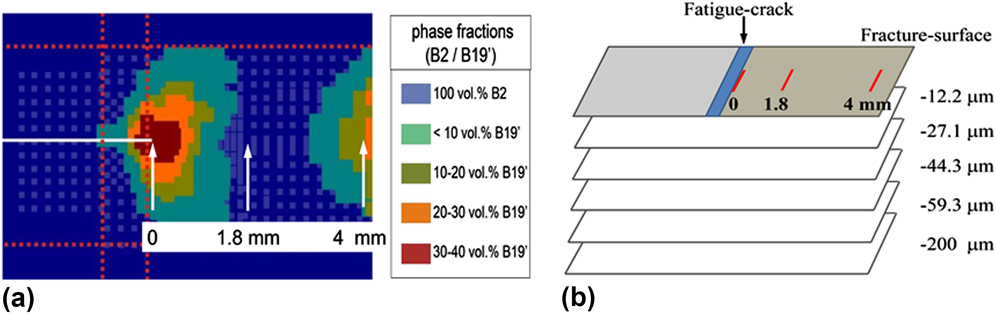
The in situ synchrotron experiments in Refs. Reference Gollerthan, Herberg, Baruj and Eggeler15 and Reference Gollerthan, Young, Baruj, Frenzel, Schmahl and Eggeler16 were done at 2860 N, below the critical load, where K I < K I*. The volume fractions of the pseudoelastic transformed martensite are shown in Fig. 7(a) in Ref. Reference Gollerthan, Young, Baruj, Frenzel, Schmahl and Eggeler16. A section of this figure is shown in Fig. 3(a). The primary crack-tip is indicated by the first vertical arrow on the left. The postmortem microbeam laboratory X-ray diffraction experiments were carried out at three positions along the fracture surface indicated by the three vertical arrows in Fig. 3(a) and repeated below the fracture surface shown schematically in Fig. 3(b).
(a) The spatial distribution of the volume fraction of transformed martensite, B2/B19′, around the crack-tip, in an identical CT specimen as the one investigated here, determined by high energy X-ray diffraction in Ref. Reference Gollerthan, Young, Baruj, Frenzel, Schmahl and Eggeler16. The specimen in Ref. Reference Gollerthan, Young, Baruj, Frenzel, Schmahl and Eggeler16 was strained up to the load of about 70% before the initiation of crack-growth. (b) The enlarged part of (a) around the crack-tip with indicating the positions where the present X-ray diffraction experiments were carried out on the fractured specimen. (By courtesy from the authors of Ref. Reference Gollerthan, Young, Baruj, Frenzel, Schmahl and Eggeler16.)

B. X-ray diffraction
The X-ray diffraction experiments were carried out using a double-crystal diffractometer with a symmetrically cut plane Ge primary monochromator using the (220) reflection. Reference Ungár, Ott, Sanders, Borbély and Weertman27 The Nonius FR 591 rotating copper anode (Nonius, Delft, the Netherlands) was operated at 4 kW with a fine line focus of 0.3 × 3 mm2 true focal size. A narrow slit in front of the monochromator was adjusted to eliminate Cu Kα2 radiation. After the monochromator a second slit of 0.2 × 2 mm2, close to the specimen, blocks parasitic scattering from the monochromator and reduces beam divergence normal to the incidence plane. The distance between the X-ray source and the specimen was 460 mm. This setup provides a monochromatic and almost parallel beam with a divergence less than about 0.025° in the plane of incidence. The footprint of the beam on the specimen was about 0.2 × 2 mm2. The diffracted beam was recorded using two curved image plates (IP) with a linear spatial resolution of 50 μm. The IPs were positioned at a distance of 200 mm from the stationary specimen, covering the angular range from 2θ = 30 to 140°. Since, in the present case, the narrowest diffraction peaks in all measured diffraction patterns were at least one order of magnitude broader than the instrumental breadth of 0.057°, there was no need for instrumental corrections. The position of the X-ray beam on the specimen surface was determined by using a low depth-resolution microscope coupled to a TV-screen.
At first the virgin fracture surface was measured. After finishing the three diffraction patterns at the three positions, the specimen was successively chemical etched to measure the diffraction patterns at different depths from the fracture surface as shown schematically in Fig. 3(b). The blue region is the fatigue precracking. The three red lines indicate the distance of measurement positions from the primary crack-tip. Depth profiling was done by stepwise removing layers of defined thicknesses by chemical etching. During etching the side and bottom faces of the specimen were covered by etchant resistant synthetic lack. The thickness of the removed layers was controlled by weighing the sample with an accuracy of 10 μg. The aim of thickness removal was 15 μm in 4 steps. Figure 4 shows the measured depths after layer removal. The actual measured values come quite close to the targeted 15 μm steps. After the 4 layers were removed, a thicker layer of about 200 μm was removed to reach a depth, significantly below the rupture surface.
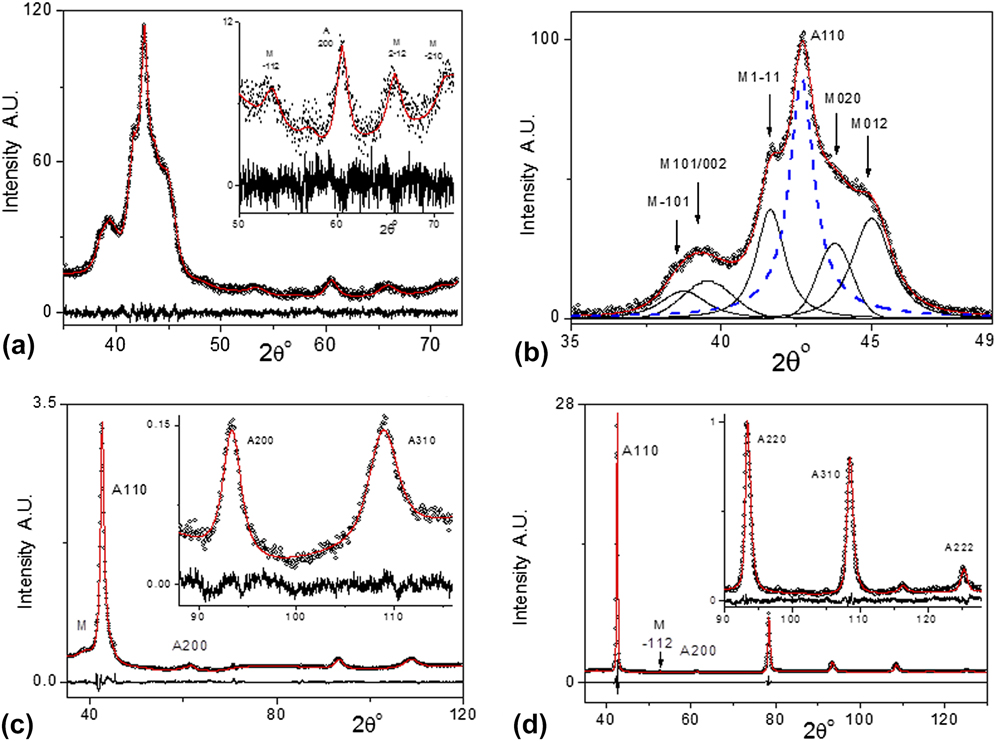
(a) The measured (open circles) and fitted (red line) diffraction pattern measured on the fracture surface at the primary crack-tip. The difference between the measured and fitted data is shown in the bottom of the figure. Here the fitting was carried out by the CMWP procedure. (b) A more detailed subdivision of the overlapping austenite and martensite peaks, where the sub-peaks corresponding to the five strongest B19′ martensite reflections shown as black solid lines and the 110 austenite peak as dashed blue line. (c) Measured (open circles) and fitted (red lines) diffraction patterns corresponding to the fracture surface at a distance of 4 mm from the primary crack-tip. (d) Measured (open circles) and fitted (red lines) diffraction patterns 59.6 μm below the fracture surface, below the primary crack-tip.

III. EVALUATION OF THE X-RAY DIFFRACTION PATTERNS
The diffraction patterns are evaluated by using the convolutional multiple whole profile (CMWP) procedure. Reference Ungár, Dragomir, Révész and Borbély28–Reference Ungár, Balogh and Ribárik30 The method is based on physically well-established profile functions theoretically calculated for different specific lattice defects, in particular for (i) coherently scattering domain size, (ii) dislocations, and (iii) various planar defects. The size profile function is given by the median, m, and the variance, σ, for the coherently scattering domain size. The strain profile function is given by the density, ρ, the contrast factors, C, and the arrangement parameter, M, of dislocations. The profile function of planar defects is given as the sum of a symmetric and antisymmetric Lorentz functions versus the density of the faults. Reference Ungár, Balogh and Ribárik30 The calculated diffraction pattern is produced by convoluting the defect related, theoretically calculated profile functions. The calculated and measured diffraction patterns are matched together by adjusting the physical parameters listed above. Instrumental effects are also convoluted in CMWP with the physical profiles. The background is determined either manually or by a background fitting. The calculated and measured patterns are matched by the combined Marquard-Levenberg and Monte-Carlo procedures to obtain the global minimum for the difference between the measured and calculated patterns. Reference Ribárik, Jóni and Ungár31 The CMWP procedure has the option to evaluate more than one phase in parallel. This is used to determine the microstructure in the austenite and the irreversible martensite phases separately and simultaneously.
A. Evaluation of the dislocation density
The Fourier transform of the strain profile can be written as Reference Ungár, Balogh and Ribárik30 :
 $$A_{hkl}^D\left( L \right) \cong \exp \left[ { - 2{\pi ^2}{g^2}{L^2}\left\langle {\varepsilon _{g,L}^2} \right\rangle } \right]\quad ,$$
where g is the absolute value of the diffraction vector, L is the Fourier variable, and
 $\left\langle {\varepsilon _{g,L}^2} \right\rangle$
is the mean-square strain. For dislocated crystals the mean-square strain was elaborated by Krivoglaz,
Reference Krivoglaz32
Wilkens,
Reference Wilkens, Simmons, de Wit and Bullough33
and Groma et al.
Reference Groma, Ungár and Wilkens34
:
 $$\left\langle {\varepsilon _{g,L}^2} \right\rangle \cong {{\rho C{b^2}} \over {4\pi }}f\left( \eta \right)\quad ,$$
ρ and b are the density and the Burgers vector of dislocations, C is the dislocation contrast factor
Reference Ungár and Tichy36–Reference Jóni, Al-Samman, Chowdhury, Csiszár and Ungár38
, and f(η) is the strain function. The function f(η) describes the L dependence of the mean-square-strain with η = L/R
e, where R
e is the effective outer cut-off radius of dislocations. The physical meaning of R
e here is the same as in the elastic stored energy of dislocations.
Reference Bailey and Hirsch35
R
e is rationalized as the dipole character of dislocations arrangements by introducing the arrangement parameter
 $M = {R_{\rm{e}}}\sqrt \rho$
.
Reference Wilkens, Simmons, de Wit and Bullough33
If M is smaller or larger than unity, the dipole character of dislocations is stronger or weaker. M correlates with the profile shape. For smaller or larger M values the tails of diffraction peaks become longer or shorter, respectively.
Reference Ribárik and Ungár29,Reference Ungár, Balogh and Ribárik30,Reference Wilkens, Simmons, de Wit and Bullough33
B. Evaluation of the volume fraction of the remnant martensite
The volume fraction of the irreversible martensite was determined as the ratio of the sum of peak areas of the
 $\bar 101$
, 101,
 $1\bar 11$
, 020, and 012 reflections of the B19′ phase relative to the peak area of the 110 peak of the B2 phase. The B19′ volume fraction at the fracture surface at the crack-tip was adjusted to the value corresponding to the dark-brown region in Fig. 3(a) as f ≅ 35(±10)% [Fig. 3(a) was kindly provided Gollerthan et al., see Fig. 7(a) in Ref. Reference Gollerthan, Young, Baruj, Frenzel, Schmahl and Eggeler16].
IV. RESULTS
Representative measured and CMWP calculated diffraction patterns are shown in Fig. 4. The diffraction pattern measured on the fracture surface at the primary crack-tip is shown in Fig. 4(a). The largest intensity around 2θ = 42.7° corresponds to the 110 reflection of the B2 austenite phase. The shoulders on its left and right sides are the
 $\bar 101$
, 101,
 $1\bar 11$
, 020, and 012 reflections of the B19′ irreversible martensite phase. The constituent CMWP calculated profiles of the B19′ phase (solid black lines) along with the CMWP calculated 110 profile of the B2 phase (dashed blue line) are shown in Fig. 4(b). Measured (open circles) and CMWP calculated (red lines) diffraction patterns corresponding to the fracture surface at 4 mm from the primary crack-tip and 59.6 μm below the fracture surface, below the primary crack-tip, are shown in Figs. 4(c) and 4(d), respectively.
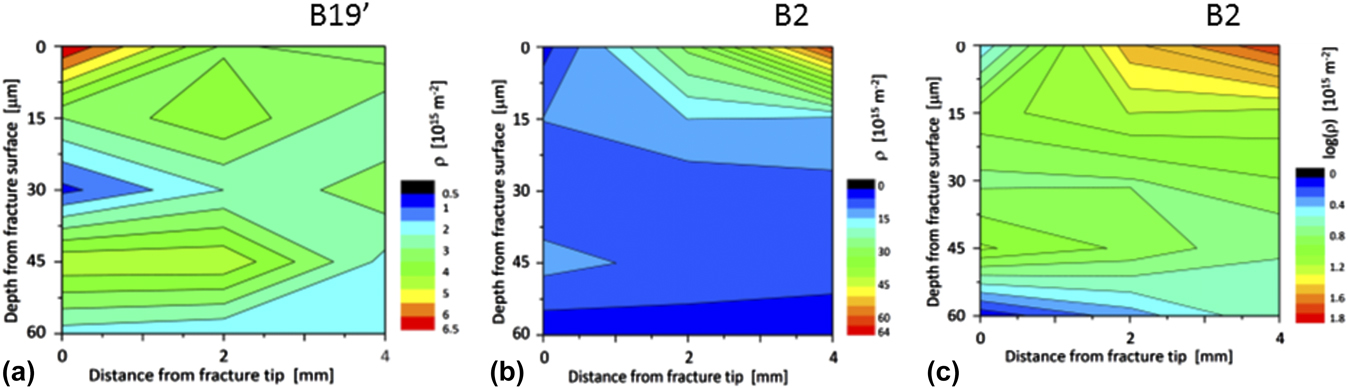
The depth profile of the dislocation density, ρ, in the B19′ remnant martensite phase is shown in Fig. 5(a). It is ρ ≅ 6.5 × 10¹⁵(±1 × 10¹⁵) m−2 at the primary crack-tip and stays large along the fracture surface between 3 and 4 × 10¹⁵(±0.5 × 10¹⁵) m−2. Below the fracture surface it decreases to about 1 × 10¹⁵(±0.5 × 10¹⁵) m−2 at a depth of 30 μm. Below this depth it is in the range between about 1 and 3 × 10¹⁵(±2 × 10¹⁵) m−2. The large experimental error in this depth range is due to the very low martensite fractions decreasing to less than 5%, see Fig. 6(a). The depth profile of ρ in the B2 austenite phase is shown in Figs. 5(b) and 5(c) in linear and logarithmic scales, respectively. Figure 5(b) shows that ρ in B2 is very large at the fracture surface and decreases rapidly with depth. Also, ρ is considerably smaller at the primary crack-tip along the fracture surface than at the far-end from it. The logarithmic scale Fig. 5(c) reveals that (i) at the primary crack-tip ρ ≅ 3 × 10¹⁵(±1 × 10¹⁵) m−2 and it increases with depth below the primary crack-tip to about ρ ≅ 10 × 1015(±2 × 10¹⁵) m−2. Below ∼50 μm ρ decreases to about ρ ≅ 1 × 10¹⁵(±0.5 × 10¹⁵) m−2. (ii) At the far-end from the primary crack-tip on the fracture surface ρ is ρ ≅ 64 × 1015(±5 × 10¹⁵) m−2 and it decreases gradually to about ρ ≅ 4 × 10¹⁵(±1 × 10¹⁵) m−2 at a depth of 60 μm. At the depths of about 200 μm below the fracture surface the dislocation density was obtained to be ρ ≅ 0.2 × 10¹⁵(±0.05 × 10¹⁵) m−2, which is equal to the dislocation density of the undeformed alloy.
(a) Dislocation density in the B19′ remnant martensite phase as a function of depth and distance from the primary crack-tip. (b) Dislocation density in the B2 austenite phase as a function of depth and distance from the primary crack-tip. (c) Dislocation density, in logarithmic scale, in the B2 austenite phase as a function of depth and distance from the primary crack-tip. The experimental error is ±2 × 10¹⁴ m−2 in the smaller and ±5 × 10¹⁵ m−2 in the larger dislocation density ranges, respectively.

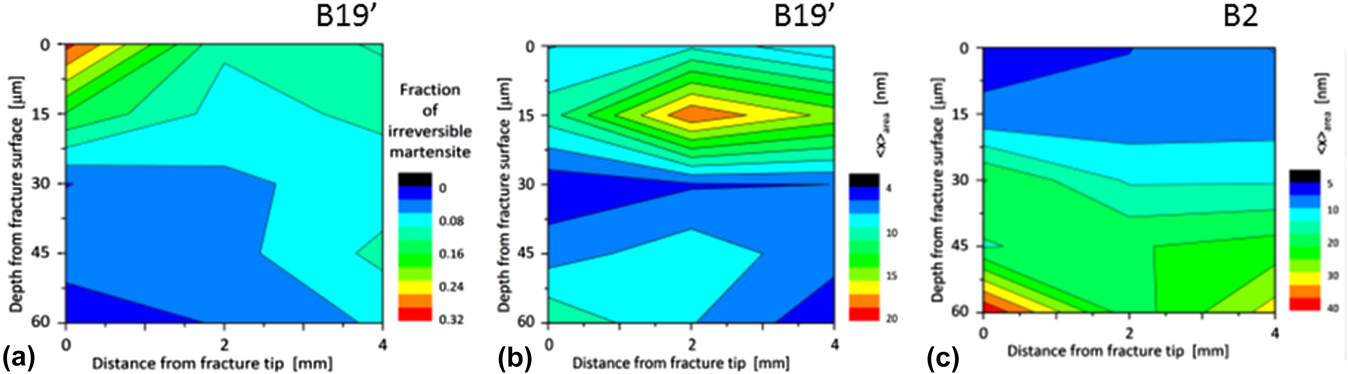
(a) The fraction of irreversible-martensite transformed during fracture as a function of depth and distance from the primary crack-tip. The experimental error is ±0.02 in the smaller and ±0.04 in the larger fraction values, respectively. (b) The area average mean crystallite size in the B19′ remnant martensite phase as a function of depth and distance from the primary crack-tip. (c) The area average mean crystallite size in the B2 austenite phase as a function of depth and distance from the primary crack-tip. The experimental error is ±2 nm in the smaller and ±5 nm in the larger 〈x〉area values, respectively.

The depth profile of the relative change of the volume fraction, f, of the remnant martensite is shown in Fig. 6(a). The figure shows that (i) f decreases almost to zero at a depth of about 60 μm from the fracture surface below the primary crack-tip, (ii) at the far-end of the fracture surface it is about f ≅ 0.15(±0.03) and does not decrease below about f ≅ 0.08(±0.02) even at a depth of 60 μm and (iii) halfway between the primary crack-tip and the far-end of the fracture surface it is about f ≅ 0.15(±0.03) but decreases relatively fast to a low level of about f ≅ 0.04(±0.02) and stays constant down to 60 μm below the fracture surface. 200 μm deep below the fracture surface no remnant martensite was detected by the present X-ray diffraction method.
The depth profile of 〈x〉area, in the remnant martensite is shown in Fig. 6(b). In plastically deformed bulk materials the X-ray determined 〈x〉area values best correlate with the subgrain size, which is usually smaller than the grain size in the material. Reference Ungár, Tichy, Gubicza and Hellmig39,Reference Zilahi, Ungár and Tichy40 Therefore, next we will call 〈x〉area the subgrain size. In B19′ it is between 6 and 8 nm at the fracture surface. It reveals a maximum halfway between the primary crack-tip and far-end of the specimen at a depth of ∼15 μm. At the depth of 30 μm goes down to about 5 nm. Below 30 μm the subgrain size values become uncertain because of the low volume fraction of B19′. The depth profile of the subgrain size in B2 is shown in Fig. 6(c). It is of the order of 5(±2) nm, at the primary crack-tip and gradually increases to a somewhat larger value of about 40(±10) nm with depth and distance from it.
V. DISCUSSION
A. Correlation between dislocation densities and the fraction of remnant martensite
In situ synchrotron X-ray diffraction experiments in Refs. Reference Gollerthan, Young, Baruj, Frenzel, Schmahl and Eggeler16 and Reference Young, Gollerthan, Baruj, Frenzel, Schmahl and Eggeler19 have shown that martensitic transformation extends as deep as ±2.5 mm from the fracture surface. The spatial distribution and the volume fraction of martensite transforming during loading is shown in Fig. 3(a) (by courtesy from Ref. Reference Gollerthan, Young, Baruj, Frenzel, Schmahl and Eggeler16). The present X-ray diffraction experiments were carried out on the fractured specimen and therefore all detected martensite is obviously remnant martensite. The fraction of irreversible martensite, shown in Fig. 6(a), drops fast to low levels smaller than about 10(±4)% at depths lower than 30 μm from the fracture surface. A comparison of Figs. 6(a) and 5(a) indicates that there is a strong correlation between the fractions and the dislocation densities in the remnant martensite phase. The high dislocation density in the B19′ phase suppresses the reverse transformation to austenite, which is expected while the CT specimen is unloaded during crack-propagation and the final fracture. At the same time, the dislocation density in the austenite phase seems to be in anticorrelation with the remnant martensite fraction, as indicated by comparing Figs. 5(b) and 6(a).
B. The effect of crack-growth rate on the fraction of remnant martensite and the dislocation densities in austenite and martensite
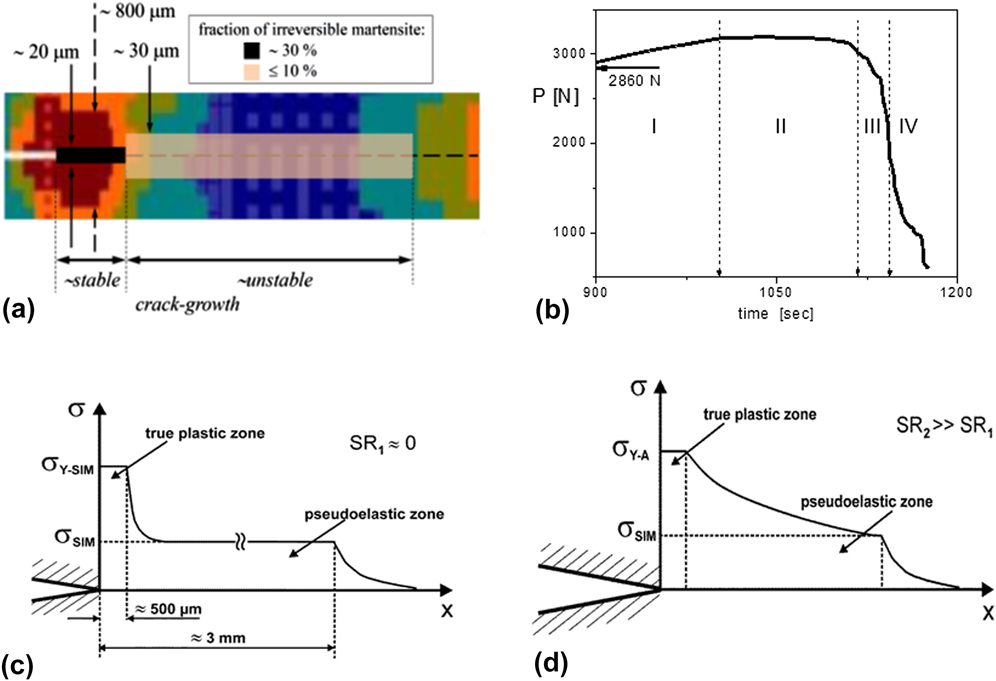
Crack-propagation and the formation of irreversible martensite are interpreted in terms of the load–displacement, P–Δ behavior, shown in Fig. 2(b). According to the deformation rate we define four characteristic sections: (I) an almost linear section where the load increases up to its maximum at about Δ ≅ 800 μm, (II) a plateau region with constant load where Δ is about 800 < Δ < 920 μm, (III) a short decrease of the load where Δ is about 920 < Δ < 950 μm, and (IV) above Δ ≅ 950 μm, where the load drops abruptly and the specimen breaks. Loading was performed displacement controlled and therefore the lengths of the regions are proportional to the time intervals in which the microstructural processes under investigation take place, especially in the first three regions. In region I the grips of the CT specimen are strained elastically and the load on the primary crack-tip increases. In region II, as suggested in Ref. Reference Gollerthan, Young, Baruj, Frenzel, Schmahl and Eggeler16, the crack propagates along with martensite formation of the specimen. Martensite formation in an extended volume around and in front of the crack was verified experimentally by the in situ X-ray diffraction experiments in Refs. Reference Gollerthan, Young, Baruj, Frenzel, Schmahl and Eggeler16 and Reference Young, Gollerthan, Baruj, Frenzel, Schmahl and Eggeler19. These in situ experiments proved that after unloading the strain-induced martensite transforms back to austenite. This is shown in Fig. 12(a) in Ref. Reference Gollerthan, Young, Baruj, Frenzel, Schmahl and Eggeler16 where no traces of the transformed martensite diffraction peaks were observed. In region III the load drops within an extremely short displacement path of the grips. According to crack-growth terminology, Reference Young, Gollerthan, Baruj, Frenzel, Schmahl and Eggeler19 stable crack-growth occurs in region II, whereas region III represents unstable crack-growth. The fracture test was conducted by displacement control at a displacement-speed of 8.33 × 10⁻⁷ m/s. Reference Gollerthan, Young, Baruj, Frenzel, Schmahl and Eggeler16 Figure 7(b) is the enlarged part of the load–displacement plot, where the displacement scale, Δ, is converted to time scale. It is plausible to assume that slow and fast crack-propagation occurred in the stable and unstable crack-growth regimes, i.e., in region II and in region III, respectively. We assume further that the stable and unstable crack-growth regions correspond to the regimes where substantial whereas somewhat smaller amounts of remnant martensite were detected. Figures 6(a) and 7(a) indicate that the lengths of these two regions are about 500 μm and 3 mm, respectively. Beyond about 3 mm from the primary crack-tip, at the far-end of the specimen, the CT-specimen loading is compressive which is not discussed here. The time periods corresponding to the stable, regime II, and unstable, regime III, crack-propagation, taken from Fig. 7(b), are about 120 and 25 s, respectively. These values provide crack-propagation rates of about v stab ≅ 3.2(±1) × 10−6 m/s and v unstable ≅ 1.2(±0.5) × 10−4 m/s in the stable and unstable crack-growth regimes, respectively. Crack-propagation in the unstable regime is more than one order of magnitude faster than in the stable one. The errors in crack-propagation rates are taken from the uncertainties of the boundaries of regimes in Fig. 7(b).
(a) Schematic drawing of the transformed (color scale used in Fig. 7(a) in Ref. Reference Launey, Robertson, Scott, Vien, Senthilnathan, Karthikeyan, Chintapalli and Pelton12 and in Fig. 3(a) here) and the irreversible martensite (black and light brown) along the fracture surface. (b) Enlarged part of the load–displacement plot in Fig. 2(b), with the displacement scale replaced by the time scale. (c) Schematic illustration of stress distributions in front pf the primary crack-tip for static loading or slow crack-propagation, (d) for fast and unstable crack-growth and for longer cracks. Note that σY-A in (d) is larger than σY-SIM in (c), σY-A > σY-SIM.

The in situ synchrotron and the post-mortem laboratory X-ray diffraction experiments revealed two different, however, complementary aspects of the forward and reverse transformation of stress-induced martensite in pseudoelastic SMA. The synchrotron experiments Reference Gollerthan, Young, Baruj, Frenzel, Schmahl and Eggeler16,Reference Young, Gollerthan, Baruj, Frenzel, Schmahl and Eggeler19 revealed the static spatial extension of transformed martensite when the load was below the critical level for crack-propagation. These experiments have shown that after unloading martensite transforms completely back to austenite. The present post-mortem depth profiling experiments revealed the presence of about 30% irreversible martensite extending into a depth of 15–20 μm below and about 500 μm along the path traveled by the crack-tip in the stable crack-propagation regime. In the unstable crack-propagation regime only about 10% or less remnant martensite could be found, which, however, extends to a deeper depth of about 60 μm from the fracture surface. As mentioned before, the spatial distribution of remnant martensite correlates with the dislocation density in the same, B19′, phase, however, it is in anti-correlation with the dislocation density in the parent, B2, austenite phase.
We interpret our results by taking two factors into account: the amount of stress σ at the primary crack-tip during crack-propagation and the effect of strain-rate (SR) on pseudoelasticity. Nemat-Nasser et al. Reference Nemat-Nasser, Choi, Guo and Isaacs41,Reference Nemat-Nasser and Guo42 observed a dependence of the mechanical behavior on SR in pseudoelastic NiTi. With increasing SR, the horizontal stress–strain plateau, associated with the formation of stress-induced martensite, see Fig. 2(a), become inclined. This effect is rationalized by the release of latent heat counteracting the transformation process. Furthermore, there is a critical strain-rate, SRcritical, where the transition stresses for stress-induced martensite, σSIM, reaches the yield stress, σY-A, of plastic deformation of the austenite parent phase. With increasing SR, σSIM increases beyond σY-A. Using the method of split Hopkinson pressure bar the critical strain rate in NiTi-SMAs was estimated to be SRcritical ≅ 1000 s−1. Reference Nemat-Nasser and Guo42 Using similar techniques Guo et al. Reference Guo, Su, Su and Chu43 found that at very high SRs the stress-induced pseudoelatic martensite formation becomes completely suppressed.
Freund et al. Reference Freund and Hutchinson44,Reference Freund, Hutchinson and Lam45 estimated the SR within the plastic zone in front of the primary crack-tip of a cleavage micro-crack in an iron single crystal as large as 106 to 107 s−1. They have shown that the SR is proportional to the crack-propagation velocity, ν, and inversely proportional to the elastic energy release-rate, G [see Eq. (1.2) in Ref. Reference Freund, Hutchinson and Lam45]. They noted that in macroscopic cleavage cracks G can be larger by two orders of magnitude, but even in such cases the SR will be in the range between 104 to 105 s−1. We can assume that the crack-propagation velocity in our experiment is about an order of magnitude smaller than in a macroscopic cleavage crack. In our case this would mean that the SR in the plastic zone at the primary crack-tip is of the order of 103 to 104 s−1. This value is close to the critical SR reported by Guo et al., Reference Guo, Su, Su and Chu43 i.e., SRcritical ≅ 1000 s−1.
The results of the present work are interpreted on the basis of a scenario where crack extension rates strongly increase, as the crack moves through regimes II to IV. This leads to different stress distributions in front of the propagating primary crack-tip. Figures 7(c) and 7(d) show the two different stress field distributions in regimes II and III schematically, as the crack-propagation proceeds. Figure 7(c) shows the situation for the entire crack-path range, as long as the crack proceeds in regime II. Here a short crack with stable and slow crack-propagation is assumed. Close to the primary crack-tip there is a zone consisting of plastically deformed, detwinned martensite extending over about 500 µm. This true plastic zone is associated with the yield stress of stress-induced martensite, σY-SIM. The lower stress plateau, σSIM, where stress-induced martensite forms, is the pseudoelastic zone where stress-induced martensite is present which, however, is plastically undeformed. Toward the end of regime III, the austenite phase is elastically loaded. As soon as the crack-tip moves on and leaves regime II, the loading stresses are drop down. In all regions along the crack path, at first the stresses increase, followed by stress relaxation. In the early stages of crack-propagation this stress increase and subsequent decrease is slow.
The situation changes completely when the crack proceeds into regime III. Here crack-propagation becomes unstable and fast. The far field stress distribution is still elastic and does not differ from the situation in Fig. 7(a). As stresses increase beyond σSIM, indicated by the dashed horizontal line for the lower stress plateau in Fig. 7(a), martensite starts to transform. The large SR conditions are producing adiabatic latent heat and the specimen heats up. The critical stress of stress-induced martensite is strongly temperature dependent, where the temperature dependence is of Clausius–Clapeyron type. As a consequence, stresses continuously increase closer to the crack-tip in regime III, as indicated schematically in Fig. 7(d). In this figure we consider a hypothetical situation where close to the crack tip no more stress-induced martensite can form because the self-heating raised the temperature above M d. (Here M d denotes the temperature above which no stress-induced martensite can form Reference Frenzel, George, Dlouhy, Somsen, Wagner and Eggeler3 ). Due to the partial inhibition of stress-induced martensite-formation the stress plateau, close to the crack-tip, raises to the yield stress of austenite, σY-A, as shown in Fig. 7(d). The schematic results in Fig. 7(d) must be interpreted with care, because temperatures should not increase to values high enough to fully suppress the formation of stress-induced martensite. However, it is clear that adiabatic heating makes the formation of stress-induced martensite more difficult and dislocation plasticity must be invoked to rationalize the plastic zone close to the crack-tip. Reference Grey46 This qualitative picture explains two experimental findings. First, the austenitic regions suffer stronger plastic deformation and show higher dislocation densities, as shown in Figs. 5(b) and 5(c). Second, at higher crack-propagation rates less martensite can be detected close to the rupture path, as shown in Fig. 6(a).
VI. CONCLUSIONS
In the present work the fracture surface regions of a broken miniature pseudoelastic NiTi CT specimen were investigated, along which the crack-tip propagated during the fracture mechanics experiment. X-ray line profile analysis was used to study the amount of martensite and the density of dislocations. Along the fracture surface, three locations were monitored, one close to the tip of the original fatigue precrack, one in the center of the fracture surface and one at the far end of the specimen. Careful step by step etching was used to remove thin layers of material parallel to the fracture surface to determine the depth profile of remnant martensite fractions and the dislocation densities in austenite and martensite. The results of the present study allow the following conclusions:
-
(1) X-ray line profile analysis can be used to identify the part of the stress affected zone in front of a crack-tip which is due to dislocation plasticity (true plastic zone size).
-
(2) Our results clearly show that the remnant martensite phase in front of the crack-tip of the pseudoelastic material, which does not transform back on unloading, is stabilized by large dislocation densities in the two phases.
-
(3) Our X-ray results were correlated with the dynamics of the load displacement data from the fracture mechanics experiment. In the stage where loads increase or remain constant (this is the regime of static loading and stable crack-growth), we observe smaller stress affected zones with higher dislocation densities and higher amounts of remnant martensite. In contrast, in regions where the load decreases but the speed of crack-propagation increases (unstable crack growth, fracture), pseudoelastic martensite formation becomes inhibited.
-
(4) The spatial extension of regions with remnant martensite are about one order or magnitude smaller than the volume affected by the formation of stress-induced martensite during crack-propagation as observed by Gollerthan et al. Reference Gollerthan, Young, Baruj, Frenzel, Schmahl and Eggeler16,Reference Young, Gollerthan, Baruj, Frenzel, Schmahl and Eggeler19
-
(5) The true plastic zone at the actual primary crack-tip and the spatial extension of remnant martensite extend only into a few grains around the primary crack-tip and below the fracture surface.
ACKNOWLEDGMENTS
T.U. is grateful to the Humboldt Foundation of Germany for supporting this research. JF, SG and GE acknowledge funding by the German Research Association (DFG) through project C1 of SPP 1544 (Ferroic Cooling). G.R. gratefully acknowledges the support of the János Bolyai Research. Fellowship of the Hungarian Academy of Sciences. The authors thank Dr. G. Csiszár for the assistance in carrying out the X-ray diffraction experiments.