




No CrossRef data available.
The Wrong Man is President! Overvotes in the 2000 Presidential Election in Florida
Published online by Cambridge University Press: 01 September 2004
Abstract
Using ballot-level data from the NORC Florida ballots project and ballot-image files, I argue that overvoted ballots in the 2000 presidential election in Florida included more than 50,000 votes that were intended to go to either Bush or Gore but instead were discarded. This was primarily due to defective election administration in the state, especially the failure to use a system to warn each voter when too many marks were on a ballot and allow the voter to make corrections. If the best type of vote tabulation system used in Florida in 2000—precinct-tabulated optical scan ballots—had been used everywhere in the state, Gore would have won by more than 30,000 votes. Florida's election experience points to the need to gather ballot-level data to evaluate the success of election reform efforts now underway in much of the United States.Walter R. Mebane Jr. has published numerous articles concerning topics in American politics, especially elections, and political methodology. An early version of this work was presented at a seminar at the University of Minnesota in April 2003. The author thanks Jason Conn, Anthony Keeney, and Mike Rosenberg for assistance, and Jasjeet Sekhon for helpful discussion.
Information
- Type
- SYMPOSIUM
- Information
- Copyright
- © 2004 American Political Science Association
Although some may argue that the Tilden-Hayes contest in 1876 was at least as bad, the 2000 presidential election was the worst election in American history. In the earlier case, not only did the Electoral College select someone who had not won a plurality of the national popular vote, but voting in Florida, Louisiana, and South Carolina was plagued by fraud. Congress appointed an electoral commission to decide the outcome; it split along partisan lines and chose Hayes. In 2000 the eventual winner in the Electoral College lost the popular vote by over 540,000 votes, and the Supreme Court stepped in with what most view as a highly politicized decision. As I review in this article, an examination of election ballots in the decisive state of Florida shows that in 2000 a plurality of the voters there intended to vote for the Democrat, Al Gore, and not the Republican, George W. Bush, notwithstanding the fact that the legal and political process produced a victory for Bush.
The story of Florida in 2000 is mostly not one of fraud but rather one of defective election administration. Across the state, tabulators simply failed to record all the intended votes. More than 50,000 voters who went to the polls on election day to cast a vote for either Bush or Gore had their intentions frustrated when, despite their efforts to produce valid ballots, they produced ballots that were discarded as spoiled: either undervotes or overvotes. Undervotes occurred when tabulation machines failed to discern that the voter had marked a choice on the ballot. In places in Florida that used punch card voting machines, undervotes were famously associated with “dimpled chads” and other manifestations of incompletely punched ballots.1
In the case of overvotes, multiple marks on the ballot made the voter's choice ambiguous.Across Florida, the rate and pattern of ballot spoilage in the 2000 election varied systematically with the tabulation method used in different localities. Some officials, such as Orange County elections supervisor Bill Cowles, argued that the blame for spoiled ballots ultimately rests with the voters, asking, “Where does their stupidity enter into the picture?”2
It is doubtful that voter stupidity varied with whether, say, poll workers advised voters of any errors on their ballots and gave each voter a chance to correct them. Such warnings demonstrably reduced the number of overvoted ballots. Florida's problems originated not with the voters but with the quality of election administration, which depends on the presence of such procedures.I begin by reviewing evidence showing that when discarded-but-intended votes are considered the 2000 election in Florida produced the wrong outcome. Then I offer my own analysis of available ballot-level data using a simple model to estimate the number of intended major-party votes included among the overvotes. Not all overvotes represent bona fide intentions to vote for either Bush or Gore. Some reflect intentions to vote for another candidate or to spoil the ballot on purpose, and some simply are haphazard punches or scribbles. The model I propose estimates the proportion of the overvotes that were intended to be a vote for either Bush or Gore, based on the vote indicated on each ballot for the U.S. Senate race and on how overvoted ballots compare to ballots that have a single choice marked for president.
My discussion emphasizes differences among the various vote tabulation procedures used in Florida in 2000. All but one of Florida's 67 counties used one of four tabulation methods: two machines, Votomatic and Datavote, for tabulating punch card ballots; and two ways of counting optically scanned ballots.3
Division of Elections 1999; Governor's Select Task Force 2001. Union County used paper ballots tabulated by hand.
In response to the 2000 election debacle, election administration was reformed throughout Florida.6
The reforms included replacing punch card and centrally scanned systems. One analysis of Florida's 2002 election concluded, “Replacement of central count optical scan and punch card voting systems with precinct count optical scan and touch screen systems dramatically reduced the level of overvotes and undervotes.”7 There is impetus to reform electoral procedures across most of the United States, motivated in part by the Help America Vote Act of 2002 (HAVA, Public Law 107-252).8 I conclude with a discussion of the kind of information that will be needed to evaluate whether HAVA and other reform efforts are moving American elections toward the goal of ensuring that every intended vote is counted.Florida 2000 Overvotes Reviewed
Investigators have extensively examined the effect that better election procedures in Florida might have had on Bush's official, 537-vote margin of victory over Gore. The butterfly ballot used in Palm Beach County caused more than 2,000 people to vote mistakenly for Pat Buchanan instead of Gore, and overvotes in two Florida counties came predominantly from Democrats, consequently diminishing Gore's vote total.9
It is well established that throughout Florida voting problems disproportionately affected blacks and Democrats.10News organizations have conducted the most thorough examinations of balloting in Florida, typically by reinspecting ballots that were not counted as part of the certified vote total.11
Damron, Campbell, and Roy 2000; Roy and Damron 2001b; Driscoll 2001; Henderson 2001; Merzer 2001a; Merzer 2001b; Merzer et al. 2001.
In light of the lawsuits and court-ordered recounts in the weeks following the election, these studies focused mainly on undervotes to demonstrate what would have happened if incomplete punches on punch card ballots had been evaluated by different standards.13
Depending on the standards used to determine whether a mark on a ballot should count as a vote and on the subset of Florida counties taken into account, the possible outcomes ranged from a narrow Bush victory to a narrow Gore victory.14The assumption prevailing in most of the what-if scenarios was that overvotes would have been ignored in any legal recount process. The U.S. Supreme Court decided to stop the recount because, according to the per curiam opinion, the process had fatal equal protection problems. This concern was based in part on seven justices' anticipation that the manual recount mandated by the Florida Supreme Court would ignore overvotes on which “a manual examination of the ballot would reveal the requisite indicia of intent.”15
Bush v. Gore, 531 U.S. 108 (2000).
Ibid.
The overvoted ballots on which the voter's intent could be clearly determined were principally cast using optical scan equipment. On such ballots, voters frequently filled in the oval for a candidate but then also wrote in the same candidate's name. In another common error on optical ballots, voters selected two candidates and then crossed one out or wrote a note requesting that the extra vote be ignored.18
Ibid.
In counties that used Votomatic punch card voting machines, recovering similar information written on ballots was not possible because none of the reinspection efforts examined the envelopes or ballot stubs used for write-in votes with such machines. For the NORC study, inspectors examined only duplicate ballots that may have been created to transcribe the write-in information. Any ballot on which a voter wrote in a name to try to correct an error would appear in the NORC data to be a ballot that selected multiple candidates.19
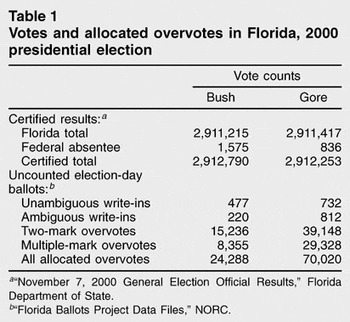
In all Florida counties, no matter what voting equipment was used, the number of overvotes for which a voter's intent could not be clearly determined in the reinspections greatly exceeds the number for which a clear determination may have been possible. Table 1 offers one perspective on this fact. The top of the table shows the final certified vote totals. The bottom uses the NORC data to separate into four categories all the overvotes on election-day ballots for which any sign of a preference between Bush and Gore could be determined. In all cases, ballots that have marks for both Bush and Gore, or for neither, are excluded. Unambiguous write-ins have a mark for either Bush or Gore, the same candidate's name written in and no other marks. Ambiguous write-ins also show a mark for either Bush or Gore and the same candidate's name written in but contain other marks as well. Two-mark overvotes show a mark for either Bush or Gore but have one other mark elsewhere on the ballot. Finally, multiple-mark overvotes have a mark for either Bush or Gore and more than one other mark.
Votes and allocated overvotes in Florida, 2000 presidential election

Counting all the overvotes that could be allocated to either Bush or Gore as if they were bona fide votes certainly changes the outcome: Gore gains a margin of more than 45,000 votes over Bush. Gore wins in this sense even if only a subset of the allocated overvotes is counted. The unambiguous write-ins in table 1 are not enough to overcome Bush's certified margin of 537 votes, but the total of all write-ins—a net gain of 847 for Gore—is sufficient. Note that some of the write-ins deemed ambiguous in this accounting might have been clear under standards used by other ballot reinspections, such as those reported by David Damron and Roger Roy.20
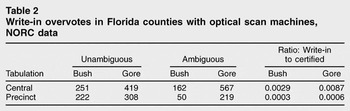
For instance, an optical ballot error that a voter tried to correct by both marking and writing in a candidate's name would be an ambiguous write-in in table 1.In counties that used optical scan equipment, Gore lost a higher proportion of votes than Bush to uncounted write-ins, and more uncounted write-ins occurred with central tabulation than with precinct tabulation.21
With the NORC data it is also possible to allocate write-in overvotes for counties that used Datavote punch card voting machines, although such overvotes are rare. The nine Datavote counties contain a total of nine unambiguous and twenty ambiguous write-in ballots. Madison County has fifteen of the allocated write-ins and Gilchrist County has seven.
The particular brand and model of the optical scan machine does not appear to have affected the pattern of allocated write-ins.
Write-in overvotes in Florida counties with optical scan machines, NORC data

Lake County, which has the highest absolute number of allocated write-ins (208 for Bush and 435 for Gore) and relatively large ratio values (0.0042 for Bush and 0.0119 for Gore), received media attention because its election canvassing board voted not to count ballots on which the same candidate's name was both marked and written in.23
But other counties where canvassing boards decided not to count such ballots, such as precinct-tabulated Okaloosa, have substantially smaller ratios (for example, 0.0006 for Bush and 0.0012 for Gore in Okaloosa).24 Unfortunate positioning of the write-in option on the Lake County ballot, a result of printing all the presidential candidates' names in a single column, may have contributed to write-in problems there.25As previous reports based on the NORC data have emphasized, most allocated overvotes appear not to be write-ins but instead simply ballots with two or more marks.26
For example, Bousquet and Tobin 2001.
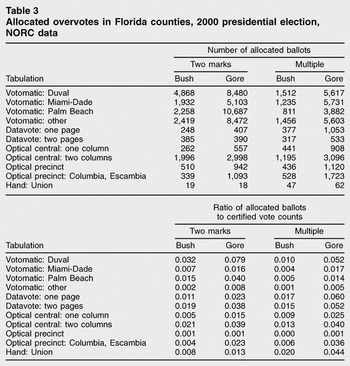
Allocated overvotes in Florida counties, 2000 presidential election, NORC data

As this table shows, the frequency of allocated overvotes with two or more marks varies significantly according to the type of election administration, especially the type of ballot, voting machine and tabulation protocol. Palm Beach, Duval, and Miami-Dade counties have the highest numbers of allocated overvotes of this type. In terms of ratios to certified vote counts, Duval County has the worst results among all counties for Gore but not for Bush. This is almost certainly due to Duval's two-page ballot, widely documented to have caused voting errors especially in areas predominantly populated by blacks.27
The ratios in Palm Beach and Miami-Dade counties are not especially large, notwithstanding Palm Beach County's disastrous butterfly ballot.28 The results in most Datavote machine counties are at least as bad. Datavote counties in which the candidates' names spanned two pages have higher frequencies of two-mark ballots than do those where all the candidates' names appeared on one page. In counties that used centrally tabulated optical scan machines and printed the candidates' names in two columns, the ratios are even larger.29Compare Agresti and Presnell 2002.
Counties that used precinct-tabulated optical scan machines typically have much smaller ratios. Columbia and Escambia counties are exceptions: their ratio results are as bad as those from Lake, the one county that used centrally tabulated optical machines and ballots with the candidates' names printed in a single column.30
Interestingly, of the counties that used centrally tabulated optical scan equipment, only in Lake County was the ratio of the Gore ratio to the Bush ratio larger for the two-mark allocated overvotes than for the multiple-mark allocated overvotes. This result supports reports that the small print on the ballot especially confused some voters who could not distinguish “Lieberman” from “Libertarian” and hence marked their ballots for both Gore and Libertarian Harry Browne (Damron and Shaw 2001).
Ibid.
Table 3 shows that several aspects of ballot design, the administration of polling places, and vote tabulation affected the occurrence of ambiguous ballots in Florida in 2000. Overvotes were least likely to occur, however, when each voter whose ballot had excessive marks was given a warning and a chance to make corrections.
Are Many Marks a Vote?
Which of these prima facie ambiguous ballots actually represent votes that were intended for one of the major party candidates? While there is no way to determine this with certainty for any individual ballot, it is possible to derive a useful estimate of the proportion of two-mark and multiple-mark ballots that convey a specific vote intention.
Previous discussions of two-mark overvotes have used plausible criteria to assess voter intent. An analysis of ballot image computer files from several counties that used Votomatic voting machines cites the most important pattern, which refers to votes cast in the U.S. Senate race involving Democrat Bill Nelson and Republican Bill McCollum. On presidential overvotes that contain a punch for Gore and also a valid Senate vote, the Senate vote is much more likely to be for Nelson than for McCollum.35
Other reports, focusing on either Palm Beach County36 or all of Florida,37 also use the Senate voting pattern as evidence that some of the overvotes represent clear voter intentions. Based on such evidence, several analysts conclude that two-mark ballots cost Gore enough votes to lose the election.38For example, Keating 2001; Engelhardt and McCabe 2001; Bousquet and Tobin 2001; Kunerth 2001.
Examining the Senate voting pattern on overvoted ballots is a good behavioral approach to the problem of discerning voters' intentions, but its application can be sharpened. The reports that use this approach fail to provide a baseline we might use to evaluate the numbers. For instance, Tyler Bridges's report uses ballot image data from eight Votomatic counties to compare two percentages: the percentage of voters who chose Gore and another candidate and also voted for Nelson, and the percentage of voters who chose Bush and another candidate and also voted for McCollum.39
The analysis shows a 75 percent coincidence in the Gore-Nelson case but only 45 percent for Bush-McCollum. This may suggest that a fair number of Gore overvotes represent frustrated voter intentions while most of the Bush overvotes are meaningless, but Bridges presents no clear standard against which to compare these numbers.A plausible and simple standard of comparison is readily available, however: We should compare the pattern in the overvotes to the pattern among the ballots that counted in the certified vote totals.
How does the pattern of Senate voting on two-mark and multiple-mark overvoted ballots compare to the pattern on valid ballots? Using the same kind of ballot image data used by Dan Keating for ten Votomatic counties,40
we can answer this question for one version of the behavioral measure.41The ballot image data files are available, with documentation, from the National Election Studies website: http://www.umich.edu/∼nes/florida2000/data/ballotimage.htm.
In every county, the proportions are smaller when there is more than one mark for president than when there is only one mark. The proportion of ballots that have a valid vote for a major party Senate candidate decreases as the number of marks for president increases. This pattern does not mean that two-mark and multiple-mark voters are that much more likely to vote for a third-party candidate. Rather the pattern mostly reflects a phenomenon Michael Herron and Jasjeet Sekhon documented using ballot image data for Broward and Miami-Dade counties: voters who overvote for president also tend to overvote for other offices.42
I interpret this pattern as indicating that some two-mark or multiple-mark ballots convey an intention to vote for one of the major party candidates, just as the singly marked ballots do. But also some are meaningless.This interpretation begins with the idea that there are two kinds of voters. Call them true voters and random voters. Assume that all voters who mark only one candidate for president are true voters, but only a fraction of those who make multiple marks are true voters. True voters always vote to convey a specific voting intention, even though they sometimes make mistakes. Random voters simply make marks at random. The conditional Senate voting behavior of the one-mark voters, given their presidential choices, is the standard for the behavior of the true voters in each county. Any discrepancy between that standard and the conditional Senate voting behavior of the two-mark or multiple-mark voters is due to the presence of random voters in those groups. The Appendix describes this idea in more precise mathematical terms.
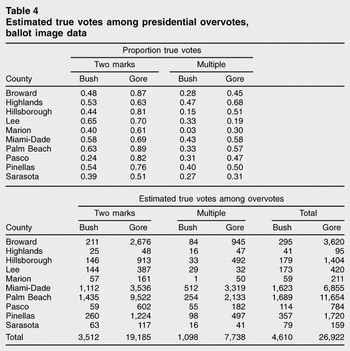
Using ballot image data to compute the proportion of true votes, denoted β, produces the results shown in table 4. The computed β ranges from a high value of 0.89 for the two-mark allocated Gore overvotes in Palm Beach County to a low of 0.03 for the multiple-mark allocated Bush overvotes in Marion County. In every case but one, β is greater for the allocated Gore overvotes than for the allocated Bush overvotes of the same type in the same county. In all but two cases β is greater for the two-mark ballots than for the multiple-mark ballots allocated to the same candidate in a county. By and large the results suggest that a higher proportion of the overvotes allocated to Gore rather than to Bush were true votes, and many more of the two-mark overvotes than of the multiple-mark overvotes were true votes.
Estimated true votes among presidential overvotes, ballot image data

The bottom part of table 4 shows the results of multiplying the number of allocated overvotes of each type by the corresponding β value, in order to estimate the number of true votes that were not counted because they were recorded as overvotes. The counties that have high raw numbers of allocated overvotes also tend to have high proportions of true votes among them. The result is a net gain from these ten counties of more than 22,000 votes for Gore over Bush.
Using the NORC data to apply this method to the other counties in Florida requires some imputation, because we lack information about the distribution of Senate voting behavior given a valid (i.e., one-mark) vote for either Bush or Gore. A reasonable approach is to use values taken from the counties where ballot image data are available.43
The proportion of one-mark ballots that have a valid vote for a major party Senate candidate does not vary much among the counties. The values range between 0.95 and 0.96 for Bush and between 0.93 and 0.95 for Gore. The exceptional county for both Bush and Gore is Miami-Dade, where for both candidates the proportion is 0.89. The results in that county reflect that an unusually high proportion of the one-mark ballots lack any valid vote for the Senate. The elevated rate of Senate nonvoting is evident in most of the precincts in the county. There is somewhat greater variation among the proportions of one-mark ballots on which the Senate vote is for the candidate of the same party as the chosen presidential candidate.
That is, I use the medians for the values P1 and S1 in equation (3) in the appendix.
To calculate the number of true votes, I aggregate the NORC data into categories based on the type of tabulation used in each county. Aggregating avoids statistical issues associated with the small numbers that occur in the smaller counties. The principal point of the analysis does not change when the data are handled slightly differently.
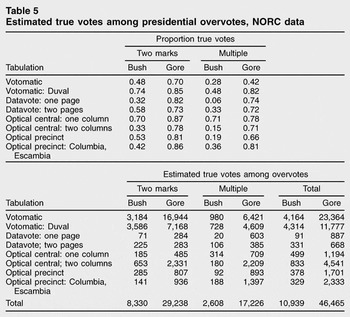
Table 5 reports the estimates of true votes among the overvotes in the NORC data. The set of counties that use Votomatic machines excludes Duval County, for which the proportions are reported separately. Columbia and Escambia counties are again treated separately from the other counties that used precinct-tabulated optical scan systems. As in the results based on the ballot image data, the proportion of true votes is higher among the ballots allocated to Gore than among the ballots allocated to Bush, and it is also higher among the two-mark ballots than among the multiple-mark ballots. The proportion of true votes is higher in Duval County than it is in the other Votomatic counties. The proportion of true votes for Bush is higher in Datavote counties that listed the candidates' names on two pages than in Datavote counties that had the names all on one page. For Gore the reverse pattern occurs. In contrast, the proportion of true votes for Bush is much higher in the centrally tabulated optical scan county that listed the candidates in a single column than it is in the counties that listed the candidates in two columns.
Estimated true votes among presidential overvotes, NORC data

In every category, the number of allocated overvotes estimated to be true votes for Gore is larger than the number estimated to be true votes for Bush. About 69 percent of all two-mark allocated overvotes and about 52 percent of the multiple-mark allocated overvotes are estimated to be true votes for either Bush or Gore. About 45 percent of the two-mark and multiple-mark overvotes allocated to Bush are estimated to be true votes, while about 68 percent of such overvotes allocated to Gore are estimated to be true votes. The overall net gain of 35,526 votes for Gore is more than enough to overcome Bush's certified margin of victory.
Dispositions versus Intentions
Do true votes as estimated in tables 4 and 5 in fact represent genuine intentions to vote for either Bush or Gore? The conditional Senate voting behavior to which the model refers is a good although imperfect measure of a voter's disposition to vote a certain way on the rest of the ballot, given how the voter behaved when voting for president. In making the conditional behavior of one-mark voters the standard to which the behavior of two-mark and multiple-mark voters is compared, we are asking whether voters in the latter two groups on average have the same dispositions as voters who cast valid presidential votes. The model used to produce tables 4 and 5 represents an effort to estimate the sizes of the subsets of two-mark and multiple-mark voters who have on average the same dispositions as one-mark voters.
A skeptic might concede that the model is useful for estimating the sizes of those subsets but still insist that it falls short of identifying the number of votes that were intended to go to either Bush or Gore. Having the same disposition to vote in a certain way for other offices, the skeptic might say, is not the same as having a specific intention to vote in a particular way for this one. The skeptic might point to studies such as those by Herron and Sekhon or Michael Tomz and Robert van Houweling.45
Herron and Sekhon present examples in which some voters seem to have intentionally failed to cast valid votes for some offices but not for others, in response to the leading candidate's race and the competitiveness of the election. Citing such work, the skeptic might argue as follows: We might use the office for which the most voters cast a valid vote as a basis for matching their dispositions and imputing votes for the other offices, but the fact remains that some of the voters to whom we have imputed valid votes specifically intended not to cast such a vote.There is a point beyond which no conceivable data can refute such a counterargument, but I think a case can be made for concluding that most of the estimated true votes reported in tables 4 and 5 reflect frustrated intentions to cast a valid vote and not willful efforts to cast a spoiled ballot. The case rests on the fact that while the dispositional mechanism the model captures is broadly similar across the various counties, the absolute frequency with which allocated overvotes occur varies tremendously from county to county.
Consider Palm Beach and Pinellas counties. Table 4 shows some differences between the counties in the proportions of true votes among the allocated overvotes, but the numbers are not all that different. In contrast, ratio results such as those in table 3 show that allocated overvotes occur in Palm Beach County at roughly five times the rate they occur in Pinellas County. Undoubtedly, the butterfly ballot used in Palm Beach caused many more voters to make mistakes there, but it is hard to believe that the ballot design caused more voters to spoil their ballots intentionally.
Perhaps the results for counties that use precinct-tabulated optical scan machines are the hardest test for the claim that I am measuring intentions and not merely dispositions. After all, the stylized story about those counties is that every voter who attempted to cast a ballot containing overvotes received a warning and was given a chance to submit another ballot. In fact, this ideal warn-and-correct scenario was less than perfectly implemented. Columbia County is not the only locality where defective procedures have been documented.46
For examples from Bay and Orange counties see Roy and Griffin 2001.
Election Reform
The official outcome of the 2000 presidential election in Florida was a complete disaster. Just taking into account the allocated overvotes that reflect genuine intentions to vote for either Bush or Gore, more than 57,000 voters who went to the polls on election day had their intentions frustrated. If none of the administrative defects that caused those intended votes not to be counted had existed, Gore would have won the state by more than 35,000 votes instead of losing by 537 votes. Taking these frustrated votes into account, the election was close, but not all that close—not exactly “poised on a knife edge,” as some have written.47
The administrative problems turned a clear Gore victory into a narrow loss.The administrative problems in Florida in 2000 go beyond the much maligned butterfly ballot in Palm Beach County. While the butterfly ballot certainly caused more overvotes, voter intentions were frustrated throughout the state. In proportional terms, a Datavote punch card voting machine with the candidates' names printed on two pages was just as bad as a butterfly ballot; a centrally tabulated optical scan system with the candidates' names printed in two columns was even worse.
Election administration reform in Florida since the 2000 election has taken such facts into account, and now all Florida counties are required to use precinct-tabulated equipment.48
We might ask, what would have happened in the 2000 election if such reforms had been in effect at the time? It is a fraught enterprise to consider such a counterfactual, but for the most straightforward, ballpark answer we should refer to table 3 and imagine that the frequency of allocated overvotes throughout the state is reduced to the level that typically occurs in precinct-tabulated optical scan counties. Among the latter set of counties (excluding Columbia and Escambia), the median ratio of overvotes to certified vote counts is 0.001. Using the ballpark method, the frequency of allocated overvotes in Votomatic counties—except Duval and Palm Beach—would typically have fallen by a factor of about five. In Duval and Palm Beach, assuming better designed ballots were also used there, overvotes would have been reduced by a factor of 50. In counties that used Datavote machines or centrally tabulated optical scan equipment, the reductions would have been by factors ranging from 10 to 60. The bottom line is that at least 90 percent of the allocated overvotes that were true votes would have been cast as valid votes. In that case, Gore would have won by approximately 30,000 votes.HAVA provides financial support for states to improve their election administration systems.49
Regarding vote tabulation, HAVA gives states financial incentives to eliminate punch card voting machines but does not require them to do so.50 HAVA does require, however, that any voting system used in federal elections after January 1, 2006, permit each voter to verify and correct the ballot.51Ibid.
HAVA, Title III, Sec. 301(a)(1).
Across the country, optical-scan ballots are counted in a variety of ways. Processes vary from state to state and, as in Florida in 2000, within states. Information provided by electionline.org and supplemented by a canvass of secretary of states' offices and Web sites shows that, as of early June 2003, 28 states used optical-scan equipment. Of these, 6 counted exclusively at a central location in the counties, 10 counted at the precinct level, and 12 did both.53
The remaining states either did not use optical-scan equipment, did not detail their counting technique, or allowed individual counties to determine their procedure in each election. As of early September 2003, 16 states (including Washington, DC) either exclusively used warn-and-correct systems or had active plans to change exclusively to such systems, 18 states lacked a clear plan to adopt the systems under HAVA, and 17 states definitely did not plan to adopt a warn-and-correct system.54 Most of the latter 17 states used paper ballots, which are generally found to have a low rate of errors.55 Note, however, that in table 3 the error rate for Union County, which used paper ballots, is as high as the rate in the optically scanned county that listed the candidates in a single column.HAVA calls for all states to obtain voting equipment that complies with federal standards, but those standards refer to the technical operating characteristics of the machines and “are not intended to define appropriate election administration practices.”56
Mechanical problems may have been responsible for some of the trouble in Florida in 2000. Most of the errors, however, stemmed from human behavior in response to the environment at polling places, including but not limited to the machines. Not only voter behavior but also how poll workers act on election day is important.Behavioral measures such as I have analyzed in this paper are a necessary part of any effort to evaluate whether HAVA and other initiatives are raising election administration throughout the country to an acceptable level. Studies have used the residual vote as a behavioral standard, primarily as a matter of feasibility.57
Brady et al. 2001; Caltech-MIT Voting Technology Project 2001; Knack and Kropf 2003; Tomz and van Houweling 2003; GAO 2001.
The analytical approach I have used, based on diagnosing the voting dispositions of individual voters, depends on information about votes cast for different offices on individual ballots. It is only by the most fortunate of largely accidental circumstances that some of the early investigators of the Florida 2000 election managed to obtain ballot-level information from a subset of Florida's counties. No policy mandated that such data be routinely preserved or made available.
No such policy currently exists, either in Florida or elsewhere, but it is nonetheless vitally important to collect such information systematically. A reduction of the residual vote is not enough to guarantee that meaningful votes are not lost. The median ratio of allocated overvotes to certified votes was only 0.001 in Florida counties that used precinct-tabulated optical scan systems, but the results in table 5 nevertheless suggest that many of those overvotes represent frustrated true votes. To refer to the familiar automated banking machine norm, would anyone accept a banking machine that threw away one cent out of every ten dollars a customer requested?
In today's large, polarized, and closely divided electorate, even an error rate of one in a thousand intended votes may be too high. Among the goals of election reform should be the standard that no meaningful vote goes uncounted. Ballot-level data are needed to monitor how closely that standard is being approached. To award another election to one candidate when the voters intended to choose another would be beyond outrageous.
Appendix
To describe precisely the procedure used to estimate the proportion of true votes among the allocated overvotes, let P1 denote the observed proportion of one-mark voters who cast a Senate vote for one of the major party candidates, and let P2 denote the observed proportion of two-mark voters who do so. Assume that P1 is the rate at which all true voters vote for a major party candidate. The rate at which random voters do so is an unknown quantity denoted H. P2 is an average of the rates P1 and H, weighted by the unknown proportion of true voters among the two-mark voters. Let β denote that proportion. Then

For the additional information needed to find β, let S1 denote the observed proportion of one-mark Bush voters who vote for McCollum instead of Nelson, and let S2 denote the observed proportion of two-mark Bush voters who do so. Assume that S1 is the rate at which all true Bush voters choose McCollum over Nelson. The rate at which random voters who happen to vote for either McCollum or Nelson end up voting for McCollum is an unknown quantity denoted R. S2 is an average of the rates S1 and R, weighted by the unknown proportion of true voters among the two-mark Bush voters who also voted for either McCollum or Nelson. Using α to denote that proportion,

Equation (1) implies α = βP1/P2, so substituting for α, equation (2) can be solved for β:

If we assume that the random voters who happen to have picked Bush are truly choosing at random between McCollum and Nelson, then it is reasonable to set R = 1/2. The other four quantities needed to compute β from equation (3) are all observed, so the stated model gives a practical procedure for computing the proportion of true votes among the two-mark overvotes allocated to Bush. It is straightforward to apply the procedure both to the overvotes allocated to Gore and to the allocated multiple-mark overvotes.
Inspecting the ballot-image data shows that there is a problem with this simple model because for Broward County S2 > S1 for Gore, and for Highlands and Hillsborough counties there is the analogous problem with the multiple-punch overvotes allocated to Gore. In terms of the model, this is possible only if S1 < R. To cover these exceptional cases we would need R ≥ 0.95 for the random voters who happened to have made marks for Gore. Such a high value for R would raise a question about how random the so-called random voters really are in these cases. The amount by which S2 exceeds S1 is small, however. Rather than complicate the model, I simply set (S2 − R)/(S1 − R) = 1 whenever S2 > S1.
References
REFERENCES
Agresti, Alan, and
Brett Presnell.
2002.
Misvotes, undervotes and overvotes: The 2000 presidential election
in Florida.
Statistical Science
17 (4):
436–40.Google Scholar
Apple, R. W., Jr.
2000.
News analysis: Nation's fault line divides justices, too.
New York Times,
December 10. http://www.nytimes.com/.
Arzua, Lila.
2001.
Elections officials saved numerous flawed ballots.
Miami Herald,
May 11.
http://www.miami.com/mld/miamiherald/.
Bonner, Raymond, and
Josh Barbanel.
2000.
Duval County: Democrats rue ballot foul-up in a 2nd county.
New York Times,
November 17. http://www.nytimes.com/.
Bousquet, Steve, and
Thomas C. Tobin.
2001.
Thousands of votes were rejected because of extra marks emphasizing
the voters' real choice.
St. Petersburg Times,
November 12. http://www.sptimes.com/.
Brady, Henry E.,
Justin Buchler,
Matt Jarvis, and
John McNulty.
2001.
Counting all the votes: The performance of voting technology in the
United States.
Berkeley:
University of California.
Bridges, Tyler.
2001.
Ballots offer clues on intent: Experts see patterns in the
overvotes.
Miami Herald,
May 11.
http://www.miami.com/mld/miamiherald/.
Caltech-MIT Voting Technology Project.
2001.
Voting: What is, what could be.
Pasadena and
Cambridge:
California Institute of Technology and
MIT.
http://www.vote.caltech.edu/Reports/july01/July01_VTP_%20Voting_Report_Entire.pdf.
Damron, David,
Ramsey Campbell, and
Roger Roy.
2000.
Gore would have gained votes.
Orlando Sentinel,
December 19. http://www.orlandosentinel.com/.
Damron, David, and
Roger Roy.
2001.
Both sides guessed wrong: In his best scenario, Gore would win by
171.
Orlando Sentinel,
November 12. http://www.orlandosentinel.com/.
Damron, David, and
Gwyneth K. Shaw.
2001.
Lake erred by tossing write-ins.
Orlando Sentinel,
January 28. http://www.orlandosentinel.com/.
Division of Elections.
1999.
Certified voting systems used in Florida.
Computer file prepared by the Division of Elections, Florida
Department of State. http://election.dos.state.fl.us.
Division of Elections
2003.
Analysis and report of overvotes and undervotes for the 2002 general
election pursuant to section 101.595, Florida Statutes.
January 31,
Division of Elections, Florida Department of State.
http://election.dos.state.fl.us/reports/pdf/03OverUnderVotes.pdf.
Driscoll, Amy.
2001.
Review of ballots by Herald suggests Gore recount effort would
have failed.
Miami Herald,
February 26.
http://www.miami.com/mld/miamiherald/.
Election Reform Information Project.
2002.
Election reform since November 2001: What's changed, what
hasn't, and why.
Electionline.org, University of Richmond.
http://www.electionline.org.
Election Reform Information Project
2003a.
electionline.org. http://www.electionline.org.
Election Reform Information Project
2003b.
Roads to reform: Planning for the Help America Vote Act.
http://www.electionline.org.
Engelhardt, Joel, and
Scott McCabe.
2001.
Election 2000: Over-votes cost Gore the election in Florida.
Palm Beach Post,
March 11. http://www.palmbeachpost.com/.
Federal Election Commission.
2002.
Voting System Standards.
http://www.fec.gov/pages/vssfinal/vss.html.
Fessenden, Ford.
2001.
Ballots cast by blacks and older voters were tossed in far greater
numbers.
New York Times,
November 12. http://www.nytimes.com/.
General Accounting Office (GAO).
2001.
Statistical analysis of factors that affected uncounted votes in the
2000 presidential election.
Washington, DC.
http://www.gao.gov/new.items/d02122.pdf.
Governor's Select Task Force.
2001.
Revitalizing democracy in Florida. March 1, 2001. Governor's Select
Task Force on Election Procedures, Standards and Technology, Florida.
Available at
http://election2000.stanford.edu/select.task.pdf.
Greenhouse, Linda.
2000.
Justices will decide whether hand recounts can be fair.
New York Times,
December 12. http://www.nytimes.com/.
Henderson, Tim.
2001.
The methods used to check the overvotes.
Miami Herald,
May 11.
http://www.miami.com/mld/miamiherald/.
Herron, Michael C., and
Jasjeet S. Sekhon.
2003.
Overvoting and representation: An examination of overvoted
presidential ballots in Broward and Miami-Dade Counties.
Electoral Studies
22 (1):
21–47.Google Scholar
Herron, Michael C., and
Jasjeet S. Sekhon.
Forthcoming.
Black candidates, and black voters: Assessing the impact of candidate
race on uncounted vote rates.
Journal of Politics.
Jergovic, Diana.
2003.
Interview with Diana Jergovic, the National Opinion Research Center
project director for the Florida ballots project.
Telephone conversation, May 7.
Kaplan, David A.
2001.
The accidental president.
New York:
William Morrow.
Keating, Dan.
2001.
Fla. “Overvotes” hit Democrats the hardest.
Washington Post,
January 27, Internet Edition.
Keating, Dan, and
Dan Balz.
2001.
Study: Recounts would have favored Bush. Gore's best bet for 2000
presidency: Statewide tally of all uncounted ballots in Florida.
Washington Post,
November 12, Internet Edition.
Knack, Stephen, and
Martha Kropf.
2003.
Voided ballots in the 1996 presidential election: A county-level
analysis.
Journal of Politics
65 (3):
881–97.Google Scholar
Kunerth, Jeff.
2001.
Florida officials hope machines will cut errors.
Orlando Sentinel,
November 12. http://www.orlandosentinel.com/.
MacManus, Susan A.
2003.
Goodbye chads, butterfly ballots, overvotes and recount ruckuses!
Election reform in Florida: 2000–2003.
Paper presented at the Conference on Election Reform:
Politics and Policy, National Press Club, Washington, DC, May 29.
Merzer, Martin.
2001a.
“Overvotes” leaned to Gore, but to win, he needed help of
dimpled ballots.
Miami Herald,
May 11.
http://www.miami.com/mld/miamiherald/.
Merzer, Martin
2001b.
Review shows ballots say Bush, but Gore backers have some points to
argue.
Miami Herald,
April 4.
http://www.miami.com/mld/miamiherald/.
Merzer, Martin,
et al.
2001.
The Miami Herald report: Democracy held hostage.
New York:
St. Martin's Press.
Mintz, John, and
Dan Keating.
2000.
Florida black votes were more likely tossed.
Washington Post,
December 3, Internet Edition.
Montjoy, Robert S.
2003.
HAVA and the States.
Paper presented at the Conference on Election Reform: Politics and
Policy, National Press Club, Washington, DC, May 29.
National Conference of State Legislatures.
2003.
The states tackle election reform.
May 30.
http://www.ncsl.org/programs/legman/elect/taskfc/03billsum.htm.
National Opinion Research Center.
2001a.
Florida Ballot Tabulator Readme File.
December 7, 2001.
http://www.norc.uchicago.edu/fl/results/t_readme2.txt.
National Opinion Research Center
2001b.
NORC Florida Ballots Project.
http://www.norc.uchicago.edu/fl/index.asp.
Nichols, John.
2001.
Jews for Buchanan: Did you hear the one about the theft of the
American Presidency?
New York:
New Press.
Roy, Roger, and
David Damron.
2001a.
New system fumbles votes.
Orlando Sentinel,
May 6. http://www.orlandosentinel.com/.
Roy, Roger, and
David Damron
2001b.
Small counties wasted more than 1,700 votes.
Orlando Sentinel,
January 28. http://www.orlandosentinel.com/.
Roy, Roger, and
Michael Griffin.
2001.
Poll workers blew votes.
Orlando Sentinel,
February 4. http://www.orlandosentinel.com/.
Singletary, Frank.
2003.
Interview with Frank Singletary, Office of the Supervisor of Elections
in Columbia County, Florida.
Telephone conversation, June 6.
St. Petersburg Times.
2001a.
Candidates spread over two columns.
St. Petersburg Times,
November 11. http://www.sptimes.com/.
St. Petersburg Times
2001b.
Candidates spread over two pages.
St. Petersburg Times,
November 11. http://www.sptimes.com/.
Tomz, Michael, and
Robert P. van Houweling.
2003.
How does voting equipment affect the racial gap in voided ballots?
American Journal of Political Science
47 (1):
46–60.Google Scholar
Toobin, Jeffrey.
2001.
Too close to call: The thirty-six day battle to decide the 2000
election.
New York:
Random House.
U.S. Commission on Civil Rights.
2001.
Voting irregularities in Florida during the 2000 presidential
election.
http://www.usccr.gov/pubs/vote2000/report/main.htm.
Wand, Jonathan,
Kenneth Shotts,
Jasjeet S. Sekhon,
Walter R. Mebane Jr.,
Michael Herron, and
Henry E. Brady.
2001.
The butterfly did it: The aberrant vote for Buchanan in Palm Beach
County, Florida.
American Political Science Review
95 (4):
793–810.Google Scholar
Wersinger, David W.
2001.
Lake County's solution—and more problems.
Orlando Sentinel,
January 28. http://www.orlandosentinel.com/.
Votes and allocated overvotes in Florida, 2000 presidential election
Write-in overvotes in Florida counties with optical scan machines, NORC data
Allocated overvotes in Florida counties, 2000 presidential election, NORC data
Estimated true votes among presidential overvotes, ballot image data
Estimated true votes among presidential overvotes, NORC data
 You have
Access
- 37
- Cited by