Philadelphia stands out today as one of the most racially segregated cities and metropolitan areas of the country, similar to other northeastern and midwestern areas that Logan and Stults (Reference Logan and Stults2011) have described as the Ghetto Belt. We study the origins of this ignominious outcome in the late nineteenth century. These are the years (1850–1900) when Philadelphia was the northern city with the largest black population, drawing the attention of DuBois (Reference DuBois1967 [1899]) in The Philadelphia Negro. While the broad outlines of segregation have been described by DuBois and more recent historians (Hershberg et al. Reference Hershberg, Burstein, Ericksen, Greenberg and Yancey1979; Warner Reference Warner1968), we take advantage of new data sources and geographic information system (GIS) mapping techniques to answer key questions. Before The Philadelphia Negro: What was the residential pattern of black residents of the city? How did it change as the city and its black population grew? What was the scale at which segregation was found? And how did variations in class standing affect where black households lived?
DuBois described a city with strong racial boundaries expressed in both occupational inequality and spatial separation. It seems surprising, then, that contemporary scholars have so forcefully asserted that the black ghetto is an invention of the twentieth century. A more recent classic study of race relations, American Apartheid, emphasized the extent of segregation in post–World War II cities, but stated flatly that “[n]o matter what other disadvantages urban blacks suffered in the aftermath of the Civil War, they were not residentially segregated from whites” (Massey and Denton Reference Massey and Denton1993: 17). Cutler et al. (Reference Cutler, Glaeser and Vigdor1999: 456) concur on the basis of their analyses of segregation indices: “Where only one city had a ghetto by our definition in 1890 (Norfolk, Va.), 55 cities had a ghetto by 1940.”
Some other scholars dissented from this view, arguing that segregation was being studied at the wrong spatial scale. Like most others before them, Cutler et al. relied on pretabulated data from successive censuses of population (1890 through 1940) that provided the counts of whites and blacks for city wards. These were the data from which one could readily calculate standard measures of segregation for large numbers of cities over an extended period. Yet more geographically specific data have long been available for some cities. Consider the example of Chicago. Philpott (Reference Philpott1978) used listings of addresses of black leaders and realtors’ listing of homes available to blacks in Chicago in 1900. He pointed out that in 1900 the ward map showed black residents scattered through much of the southwest, south, and west sides of the city (note that Chicago had only 35 wards in 1900, averaging nearly 50,000 persons per ward). His address-level mapping (ibid.: 120) revealed that blacks were highly concentrated in parts of these wards. What became recognized as the Black Belt cut through small portions of five different wards (1, 2, 3, 4, and 29). The West Side black enclave was a small portion of ward 13.Footnote 1
Calling attention to this question of spatial scale raises questions about what segregation means. For some purposes (e.g., studies of access to public services such as police and fire protection), what matters is segregation across municipal boundaries, because in most places those services are provided by cities. If our interest is mainly in disparities in public education, then school districts (or in many areas, school attendance zones) are the most relevant unit. In this research we do not focus on any specific outcome that could be associated with residential segregation. Rather we ask whether blacks and whites were separated, and if so, at what scale this occurred. In a city with many multifamily buildings, the building could be a relevant scale. Segregation could result in racial disparities in the quality of housing (e.g., the age, maintenance, and infrastructure in the building) and in rent levels. If blacks largely lived in all-black buildings, that could be evidence of discriminatory practices by landlords. The street segment (sometimes called the face block) is another potentially important scale. A well-known argument by urban sociologists (Grannis Reference Gibson2009; Suttles Reference Suttles1972) is that casual social relationships and face-to-face neighbor relations are built mainly at this level, and racial segregation by street segment would therefore likely result in racially homogeneous local networks. Our point is that segregation can occur at many spatial scales, and it may be consequential even in cities and historical eras where classical ghettos—large zones of the city that are homogeneously black and poor—do not exist.
Racial Segregation in Nineteenth-Century Philadelphia
In the current study we examine the case of Philadelphia, a city with a larger black population than even New York throughout the nineteenth century. DuBois provides a brief overview of residential trends in this city, describing an early slum centered on Sixth and Lombard streets that “comprehended the great mass of the Negro population of the city. This is no longer so” (Reference DuBois1967 [1899]: 6). He describes how “with gathered momentum the emigration from the slums started west, rolling on slowly and surely, taking Lombard street as its main thoroughfare, gaining early foothold in West Philadelphia, and turning at the Schuylkill River north and south to the newer portions of the city. . . . Thus to-day the Negroes are scattered in every ward of the city, and the great mass of them live far from the whilom [former] centre of colored settlement” (ibid.: 6–7).Footnote 2
DuBois (Reference DuBois1967 [1899]: 172) emphasizes the class differentiation among black residents and notes the concentrations of lower-class blacks within specific kinds of areas in and around the Seventh Ward: “The very poor and semi-criminal class are congregated in the slums at Seventh and Lombard Streets, Seventeenth and Lombard, and Eighteenth and Naudain, together with other small back streets scattered over the ward.” He notes that in mid-century, “They were mostly crowded into narrow courts and alleys,” specifically “Apple street and its courts,” Paschall's alley, and Shotwell's row. He shows (ibid.: 308, 293–94) that in 1897 blacks continued to be concentrated in alleys like Govett's Court and Hines’ Court. However, “the best Negro population” (ibid.: 309) was to be found elsewhere, in certain parts of the Seventh Ward and in other wards to the southwest (in Southwark and Moyamensing) and north (in Northern Liberties and Spring Garden).Footnote 3
Nevertheless, there appears to be consensus that later in the century segregation was not so intense. While DuBois identifies slum concentrations, he also refers to blacks as being “scattered.” Warner (Reference Warner1968: 50) emphasized that blacks were not nearly as segregated in mid-century as they would be later: “Although by 1860 there were the beginnings of concentrations which reflected the future economic and social articulation of the city—a downtown, three manufacturing clusters, a small slum, a few black blocks, and occasional class and ethnic enclaves—these concentrations did not dominate the spatial patterns of the city. The full development of the segregated metropolis was yet to come.” Adams et al. (Reference Adams, Bartelt, Elesh, Goldstein, Kleniewski and Yancey1991: 10) repeat this view, treating the black case as comparable to that of Irish and Germans: “The low levels of ethnic segregation found in the nineteenth century reflect, as in the eighteenth, the density of settlement, centralized industrial employment, and the need for almost everyone to walk to work. The Irish, Germans, and blacks, though concentrated in a few neighborhoods, were, by today's standards, residentially integrated with the native white population.” Another study based on the Philadelphia Social History Project (PSHP) (Hershberg et al. Reference Hershberg, Burstein, Ericksen, Greenberg and Yancey1979) followed segregation trends with roughly comparable areal units through 1970. That study reported that black-white segregation was moderate in 1850 and 1880 (the Index of Dissimilarity was .47 and .52 in those years, respectively), and did not rise above .60 (the level that urbanists consider “very high”) until 1930.
These Philadelphia studies are consistent with the general consensus at the national level that black-white segregation before World War I was modest. This is the view that we question in the material presented here.
Research Design
Data Sources
This study draws on decennial census data from three sources that cover different ranges of years. The first, which allows us to study patterns as early as 1850, is the PSHP. The PSHP assembled data from census manuscripts in each decade from 1850 to 1880, estimating the racial composition of “grid cells” that averaged one and a quarter city blocks (Hershberg Reference Hershberg1976). To create this database, researchers imposed a grid pattern (660' × 775') on the map of the entire county. In 1850, 1860, and 1870 the manuscript population census did not record street addresses. In these years, people were searched in city directories that included addresses, and those not found in city directories were assigned the addresses of nearby people listed close to them in the census. Hershberg et al. (Reference Hershberg, Burstein, Ericksen, Greenberg, Yancey and Hershberg1981: 515) notes that the imprecision of addressing made it impossible to place people on a specific face of their assigned block, but he believes the allocation to grid cells was highly reliable. In 1880, when addresses were recorded in the census, these allocations were likely more accurate.
The original PSHP race data by grid cell is available through the Inter-University Consortium for Political and Social Research. A difficulty in using the file is that grid locations are identified only by a set of X and Y variables that do not correspond to a map coordinate system. We backward-engineered the locations in the following way: We imported the grid cell points for 1880 into a GIS containing data from the Urban Transition HGIS Project (described in the following text), and georeferenced that layer so that it would approximate the projection of the GIS map. The resulting PSHP data lines up well with major topographical features, including the county boundaries and the paths of the city's two major rivers. We then compared the pattern of racial composition in the grid cells with the location of black households; the high degree of correspondence between the two maps confirms the accuracy of our rebuilt PSHP maps.
The second source is the Urban Transition HGIS Project (Logan et al. Reference Logan, Jindrich, Shin and Zhang2011). This project developed accurate GIS street maps for 39 cities including Philadelphia in 1880 and geocoded the addresses of all residents in the 1880 census. This data set allows us to explore residential segregation in that year at any spatial scale, revealing spatial patterns that cannot be seen even in the fairly high-resolution grid cells of the PSHP. Finally, the third source is a mapping of 100 percent census data at the scale of enumeration districts for nine major cities including Philadelphia in 1990–1930 (Shertzer et al. Reference Shertzer, Walsh and Logan2016). We use the 1900 file to extend the study period beyond 1880 to 1900.
Segregation Measures and Spatial Scales
We rely on two widely used summary measures of residential segregation, the Index of Dissimilarity (Dbw) and the Isolation Index (P*bb). As used here, dissimilarity measures the degree to which blacks and whites are unevenly distributed across local areas in a city. The more blacks are clustered in different areas than whites, the higher the value of D on a scale of zero to one. Generally speaking, a value of .60 or above is considered to be very high. For example, the average value of D in metropolitan regions in 2010 was close to this level, .591 (Logan and Stults Reference Logan and Stults2011). If the groups were equally distributed across all spatial units, D would reach its minimum value of zero. The Isolation Index measures the exposure of a group to itself. For example, a P*bb value of .50 indicates that the average black person lived in an area that was 50 percent black. Even if segregation (D) remains the same over time, growth in a minority population will tend to leave it more isolated—that is, group members will live in neighborhoods where they are a larger share of the population.
Segregation is known to vary according to the spatial scale at which it is measured (Cowgill and Cowgill Reference Cowgill and Cowgill1951). For example, research has regularly found that segregation and isolation are both higher when comparing small areas like census tracts than when studying larger ones like city wards (Logan et al. Reference Logan, Zhang, Turner and Shertzer2015b). In this study we cannot apply the same areal unit in every year. For comparisons from 1850 to 1880, we rely on grid cell data from the PSHP. For comparisons in the years 1880 through 1940, we use enumeration districts (EDs), which are a larger unit. To extend the series from 1940 through 2010, we use census tracts, a still larger unit. In 1880, we have great flexibility in spatial scale. Using household, building, street segment, segment group, extended segment group, ED, and ward levels of aggregation, we are able to make a range of micro- to macroscale comparisons. A street segment includes all buildings on either side of a street between two intersections. A segment group includes a focal street segment and each other segment to which it is directly connected at an intersection. An extended segment group pushes the boundaries out one other step, including all the segments to which the segment group is connected.Footnote 4
In 1880, because we aggregate the 100 percent microdata ourselves to create measures at different scales, we can also exclude live-in black domestic servants in white households when we calculate segregation measures. The rationale is that there were many live-in domestics at that time, and their inclusion would lead to the impression that blacks had wider access to the housing market (when seeking housing on their own) than they actually did.Footnote 5 In 1880, we are also able to ask whether higher-status blacks lived in different surroundings than blacks of lower status. We measure status through the Socioeconomic Index (SEI), which ranks occupations according to their relative incomes and prestige on a scale of 1 to 100 (Duncan Reference Duncan and Reiss1961). Although the scale is based on studies in 1950, Sobek (Reference Sobek1996) has demonstrated that it provides a reliable ranking of occupations as far back as the late nineteenth century. We use the SEI of the household member with the highest SEI to represent the status of the household.
Additionally, we assess racial change in the original 1850 community boundaries for the period 1850–1900. As noted previously, in 1854, all of the jurisdictions within Philadelphia County were consolidated into a single city of Philadelphia, greatly enlarging the original city. In 1850 Philadelphia was the fourth-largest American city with more than 120,000 residents, while five other adjacent cities within the same county were among the nation's top 30: Spring Garden District (#9), Northern Liberties District (#11), Kensington District (#12), Southwark District (#20), and Moyamensing District (#27).Footnote 6 In 1860, after consolidation, the new city of Philadelphia was the nation's second largest (more than twice as big as Brooklyn, the third largest). We use GIS to estimate population growth and the location of the black population within these historic community areas from 1850 through 1900 by aggregating PSHP grid cells for 1850 to 1880, geocoded addresses in 1880, and EDs in 1900.Footnote 7
Results
Creating Philadelphia: 1850–1900
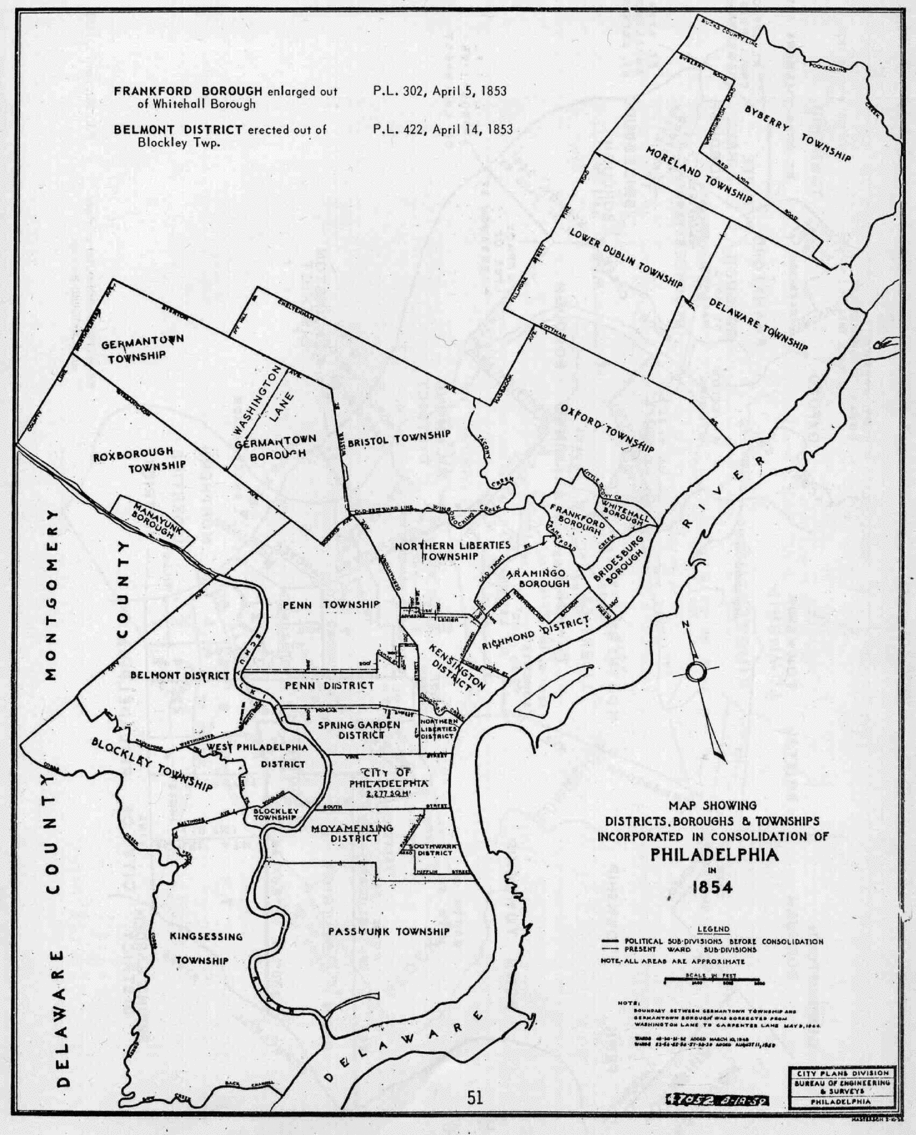
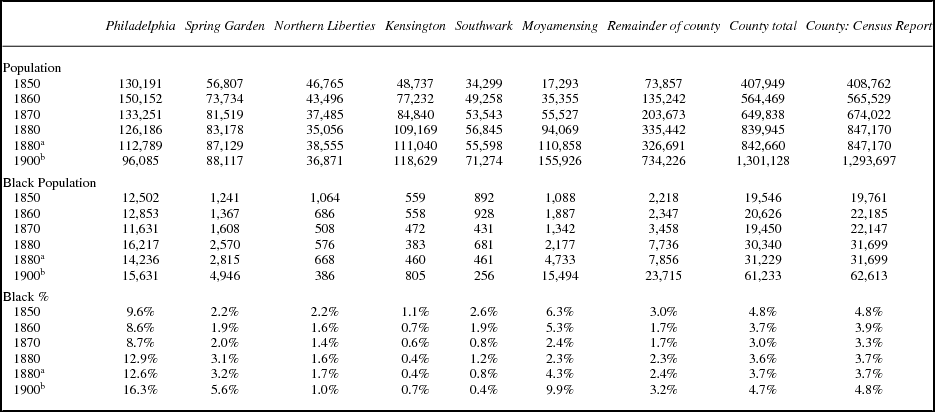
Figure 1 shows the location of all the municipal units that were consolidated to create current-day Philadelphia. The city of Philadelphia occupies a relatively small area, though it was the oldest and most densely settled urban zone. Table 1 displays several trends in this period. First, the original Philadelphia area, while growing somewhat between 1850 and 1860, declined sharply through 1900. Northern Liberties, located along the riverfront just north of Philadelphia, also declined, though more modestly. Spring Garden, Kensington, and Southwark grew substantially, while the initially less densely population areas (Moyamensing and the remainder of the county) were about 10 times their original size by 1900. These growth trajectories represent the expansion of the original walking city to a much larger area of settlement.
Philadelphia County cities and other municipal units prior to consolidation in 1854.

Population of Philadelphia community areas by race, 1850–1900

a 1880 data from geocoded addresses.
b 1900 data estimated from ED totals.
Table 1 also reports the trend in black population. Countywide, blacks comprised close to 5 percent of the total in 1900, the same as in 1850. While the county tripled in population, the black population also tripled. However, blacks were unevenly settled among community areas, and they were especially overrepresented in the original city of Philadelphia (nearly 10 percent of residents in 1850, close to 13 percent in 1880, rising to more than 16 percent in 1900—not so much due to increasing numbers of black residents but rather to the decline in the number of whites). Moyamensing is a very different case, 6.3 percent black in 1850 when it had less than 20,000 residents, with a declining share between 1850 and 1880 as the area grew, but with a large surge between 1880 and 1900 (when the number of black residents tripled and their share grew from 4.3 percent to 9.9 percent). Blacks were consistently present but underrepresented in Spring Garden, Northern Liberties, Kensington, and Southwark, and in the remainder of the county.
Longer-Term Trends
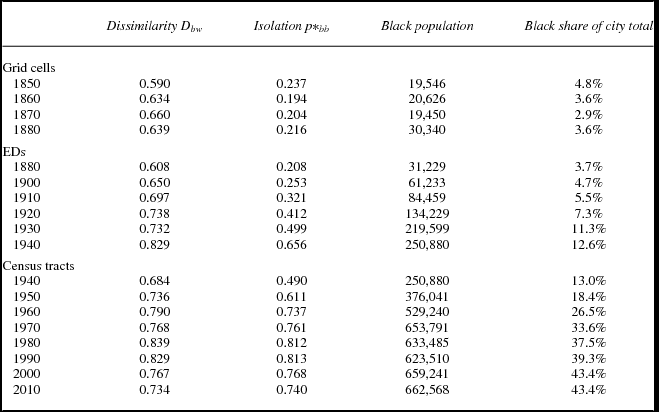
If we examine its trajectory over a longer time period, Philadelphia experienced greater transformations than in the late nineteenth century. Table 2 presents trends in measures of segregation and black isolation, and also the changing size and share of the black population from 1850 (counting the entire county) through 2010. Although the black population was large in comparison with other northern cities in the nineteenth century (nearly 20,000 black residents, comprising 4.8 percent of the population in 1850), it did not exceed 10 percent of the total until 1930. After that time there was accelerated growth in the 1940s, 1950s, and 1960s, a period when the Great Migration from the South was at its height. Today, blacks are more than 40 percent of the population of the city, and total nearly 700,000 persons. The growth of black population is directly reflected in the Isolation Index. The average black resident of the city lived in a grid cell that was about 20 percent black during 1850 to 1880 and in an ED that had growing shares of black neighbors between 1880 and 1940—rising from about 20 percent in 1880 to more than 65 percent in 1940. After 1940, the table relies on data from census tracts that are larger than EDs and therefore reflect segregation less fully. But at the tract level clearly black isolation rose quickly through 1980, when more than 80 percent of the average black person's neighbors at this scale were black.
Black-white segregation in City of Philadelphia, 1850–2010 (Index of Dissimilarity and Isolation)

The trend in segregation (D) is similar. It began at .59 in 1850 at the scale of grid cells; this is barely below the .60 that contemporary social scientists consider “very high.” It barely changed through the nineteenth century, then began to rise steadily through 1980. By that time, it was in the extraordinary range above .80; it was the seventh highest among the nation's largest 200 cities, not far from the most segregated city (Chicago at .91). What we now can measure as a high level of segregation even in 1850 became even higher in the twentieth century, as the black population skyrocketed from under 10 percent to 40 percent of the population. Segregation that appeared as small pockets of mostly black residents, especially on alleys, grew into the large zones of black Philadelphia that we see today.
Persistent Spatial Patterns
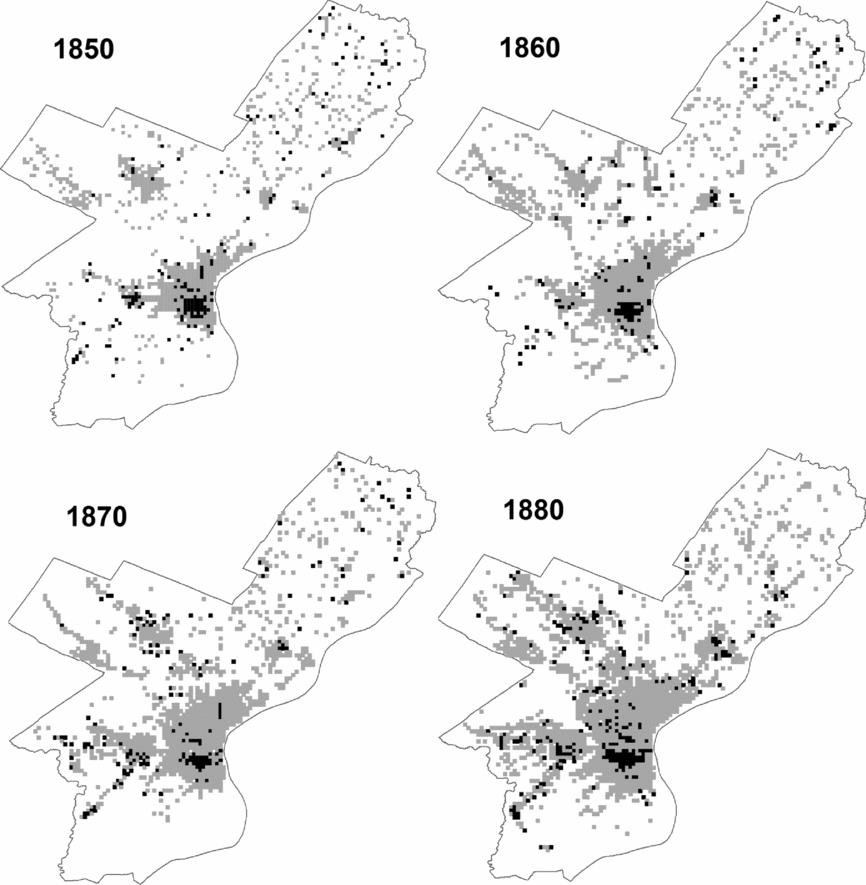
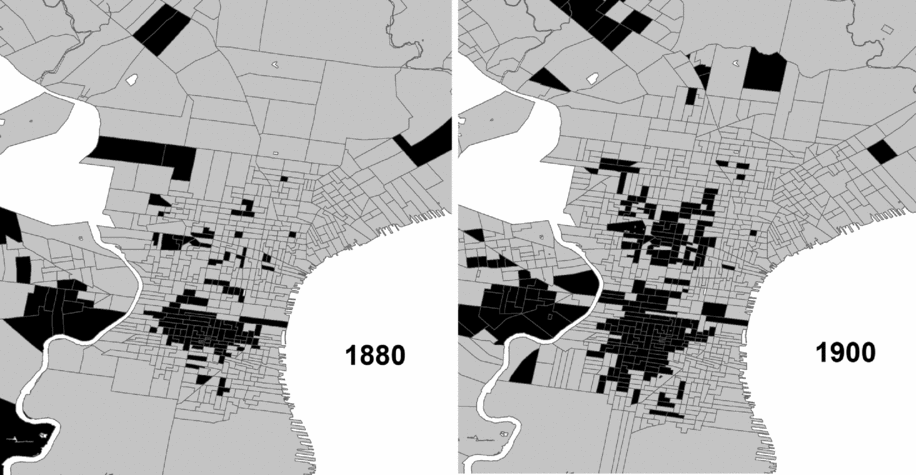
Segregation measures provide a convenient summary to quantify the boundaries between groups. Another important dimension of segregation is its spatial pattern. We can examine this pattern through maps of the location of black residents in local areas. We present maps of PSHP block data for 1850 to 1880 (figure 2), and we map at the ED level for 1880 to 1900 (figure 3). In order to visualize the pattern for the whole city, we simplify the map to distinguish areas with at least 5 percent black residents from those with lower shares.
Areas with greater than 5 percent black population based on PSHP block data, 1850 to 1880.

Areas with greater than 5 percent black population, 1880 and 1900, using 1900 ED boundaries.

In the maps in figure 2, the blocks with five or more percent black (i.e., with disproportionate black presence) are shown in black. Other populated blocks are in gray, while unpopulated areas are white. In every decade, many blocks with higher shares of black residents are clustered in the eastern section of the original city of Philadelphia, including the Seventh Ward and areas close to it. There appears to be a smaller cluster in West Philadelphia, but in most of the city there are only a few such blocks and these are quite dispersed. The core area of black settlement is very stable across these three decades although the Center City cluster extended both east and west by 1880. Meanwhile, the populated areas of the city expanded. The change is clear when comparing 1850 to 1880: The main settled area around the original city (which included Moyamensing, Southwark, Spring Garden, Northern Liberties, and Kensington) grew substantially to the south and even more to the north. By 1880 this area had connected with Germantown in the northwest. However, in most of this new area black blocks were scarce.
Figure 3 shows maps at the ED level in 1880 and 1900; as with figure 2, units that are 5 percent black or higher are shown in black. In order to provide more detail in the more densely settled area, where EDs are smaller, areas on the far north, west, and south are omitted. The 1880 map is consistent with the one in figure 2. There were considerable changes by 1900. The disproportionately black area in the central zone continued its expansion to the south (encompassing most of Moyamensing and Southwark), and north of Vine into Spring Garden and Northern Liberties. A new large cluster of disproportionately black EDs also was formed in parts of the former Penn and Kensington districts. Hence, although the degree of black-white segregation barely changed through the last half of the nineteenth century, its spatial pattern evolved. As the black population grew in size (especially when it doubled between 1880 and 1900), the main areas of black residence expanded around their perimeter and a new area was established by 1900.
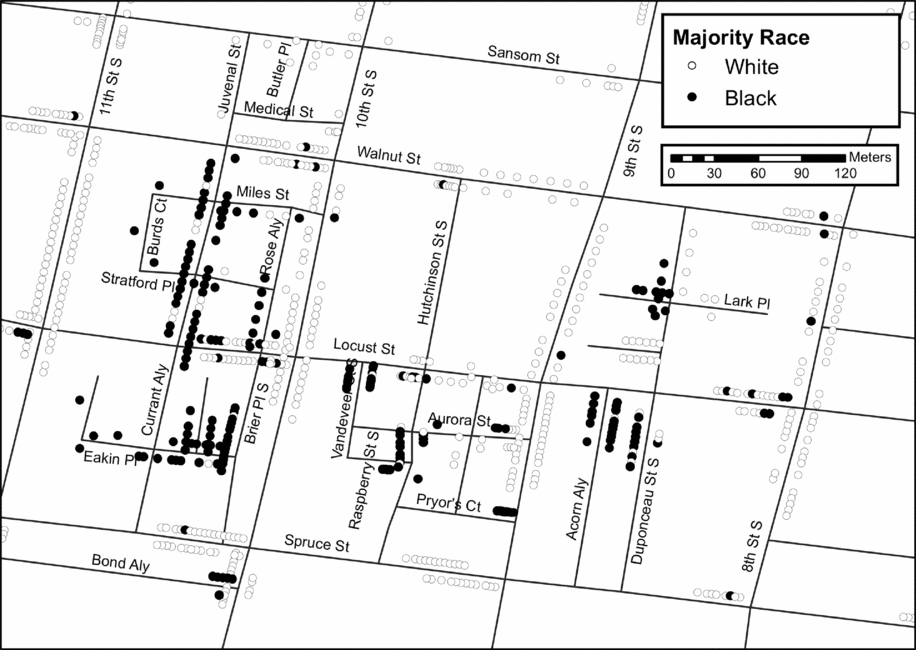
We have flexibility with 1880 data to identify the spatial configurations at a finer geographic scale. By closely examining the geocoded addresses on a building-by-building basis, we have identified three kinds of patterns: the zone of dense black alleys or short streets, the isolated black street segment, and the mixed neighborhood. The historical literature discussed in the preceding text has signaled the importance of alleys, and these are illustrated in figure 4 for a small area of the Eighth Ward, just north of the Seventh Ward within the original city of Philadelphia. Buildings containing each address are categorized as majority black (50 percent or higher) or white (less than 50 percent black). Very few buildings were racially mixed in Philadelphia at this time; 97 percent of buildings were all white or all black, not counting live-in servants.
Example of the alley or short street pattern in Philadelphia, 1880.

In figure 4, there are four north-south streets that extend beyond Sansom and Spruce. These major streets (Eighth, Ninth, Tenth, and Eleventh) are virtually all white. Three major east-west streets (Sansom, Walnut, and Spruce) also have very few black buildings, while another (Locust) is more mixed. To contrast, there are many shorter streets, some named as an alley, place, or court, with almost no white buildings, and also some other short streets with almost no blacks. In areas like this, whites and blacks live in close proximity to one another (within a block's walk), but mostly not on the same street segment. A qualitatively important characteristic of this pattern is that the predominantly black segments are mostly found on the interior of larger blocks, invisible to the traffic on major streets.
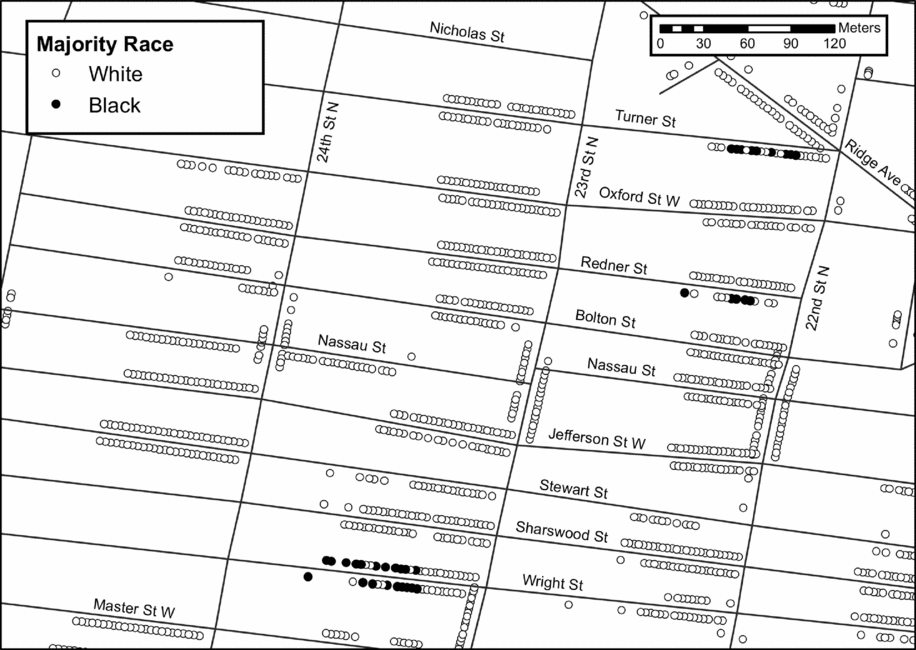
Another common configuration is the isolated black street segment. Figure 5 presents an example in an area that has a small black population in the northwest of the city, just north of Girard College in what was Penn District in 1854. Almost the whole area is all white, but there are three exceptions. These include one block of Turner Street (about half black, concentrated on the western end of the block), one block of Redner Street (majority black on the south side of the street but all white on the north side), and one block of Wright Street (nearly equal numbers of black and white buildings, but the eastern portion of this block is all white on both sides of the street). At the scale of the whole area portrayed here, one might describe the pattern as highly integrated. Even on a single street segment, black residents have many white neighbors. Yet, there is a strong spatial pattern of separation—most whites have no black neighbors on their street segment, and black buildings are tightly clustered together within these three blocks.
Examples of isolated black street segments in Philadelphia, 1880.

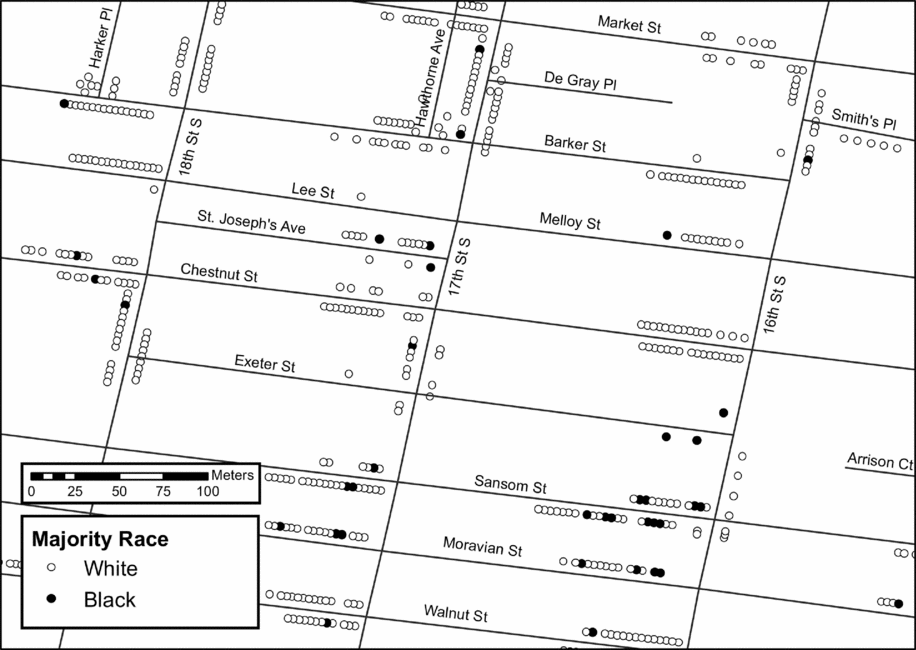
The third pattern (figure 6) can be described as residentially integrated, at least in terms of spatial arrangement. This is an area in the center of preconsolidation Philadelphia (city hall is just northeast of here) with a small black population. Note that it contains racially mixed alleys (e.g., St. Joseph's Avenue with three black buildings and 11 white buildings) as well as racially mixed major streets (e.g., Sansom Street as seen also in figure 3, Moravian Street, and Walnut Street). There are all-white street segments in this area, but that can be considered a reasonable random outcome in a city that was less than 5 percent black.
Examples of a racially integrated spatial pattern in Philadelphia, 1880.

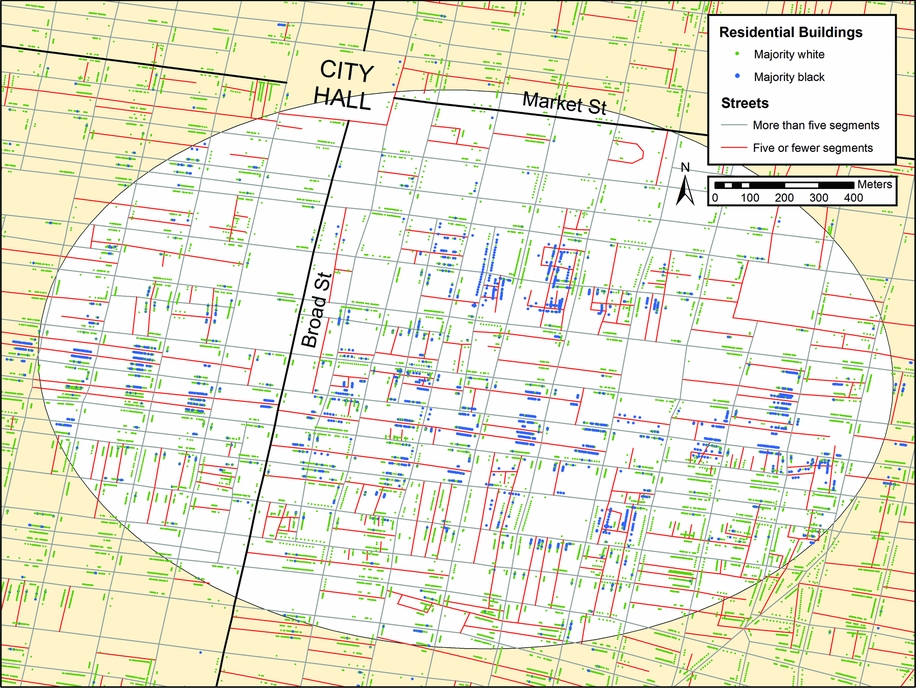
In order to illustrate how these three types of configurations appear together in the cityscape, we have prepared a map in color of a larger area of the central city (figure 7). The portion with a white background is the densest area of black settlement based on a technique called Nearest Neighbor Hierarchical Clustering.Footnote 8 It extends as far as South Sixth Street on the east and South Eighteenth Street on the west. Lombard runs east-west through the center of the predominantly black area, so that the slums of the “very poor and semi-criminal class” identified by DuBois are at the east and west edges of this zone. The map displays majority black buildings in blue and majority white buildings in green. Alleys and short streets as described in preceding text are shown in red (these are defined as streets with only one to five segments). Longer streets are shown in gray.
Detail of black settlement pattern in Center City Philadelphia, 1880.

This map illustrates several characteristics of the black settlement pattern. First, many street segments are predominantly black, and in some cases these areas extend for many blocks, especially along the east-west streets like Lombard. Second, some segments are virtually all black while many others include a minority representation of whites. Third, the predominantly black street segments typically intersect or run parallel to predominantly white or all-white segments, so that blacks generally lived in close proximity to whites. This means that the full extent of segregation would not be captured at a geographic scale larger than the segment. Fourth, alleys and short streets in the inner zone are most often majority-black. In the outer zone, where there is a white majority, there are also many alleys and short streets, and many of these are majority-white.
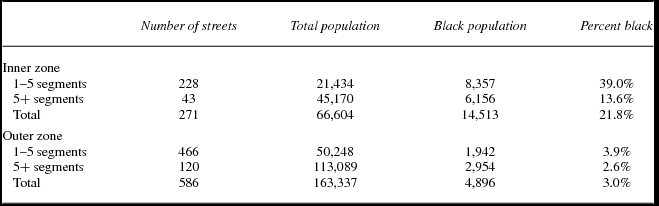
This alley pattern is found mainly in the original city of Philadelphia. To document it more precisely we have done some calculations for the inner zone shown in figure 7 and the outer zone identified by spatial analysis. Table 3 provides a count of all the streets in these two zones. The table also reports the total population on these two types of streets and the black population share. Note first that a large majority (about 80 percent) of streets in both zones are “short.” In the inner zone, 39.0 percent of the residents of short streets are black, compared to only 13.6 percent of residents of major streets. There is no comparable differentiation in the outer zone, which has a much smaller black population, and even the short streets there are virtually all white.
Distribution of population in the Center City area in 1880, by race, zone, and street length (number of segments)

The Spatial Scale of Segregation
The usual method of describing segregation (as in table 2)—examining data at a single spatial scale and calculating indices at that scale—does not reveal the qualitatively distinct spatial patterns of settlement that can be displayed with detailed mapping. Maps also have their limitations. We are unable to publish a map of the entire city that shows in detail the residential pattern in every neighborhood (though it is possible to make such a map available to inspect through a web-based GIS system or downloadable shape files). Even if we could, visual inspection is subject to idiosyncratic variation, because what one person notices is likely to be different from what another person perceives as important. Geographers often use quantitative exploratory methods to simplify complex spatial patterns (Anselin Reference Anselin1995), such as clustering techniques that identify “hot spots” (areas with unusually high or low concentrations of a given category of people or events). Figure 4 is an example of this; we use Nearest Neighbor Hierarchical Clustering to find a data-driven geography for the central black neighborhood and surrounding areas (Levine Reference Levine2015).8 Recently, other urban scholars have turned their attention to “spatial” measures of segregation (Lee et al. Reference Lee, Reardon, Firebaugh, Farrell, Matthews and O'Sullivan2008). These methods have in common an emphasis on proximity—groups are less segregated if their members live near one another and more segregated if they live farther apart.
Here we will take a different approach, using standard segregation measures but applying them to multiple spatial scales that are qualitatively meaningful. We begin with the household, the most basic unit of residential sorting. Households can be racially mixed as a result of intermarriage or leasing rooms to tenants (we do not count live-in black domestic servants in white households, which was the main source of mixed households in 1880). In cities with many rooming houses, for example, there is greater potential for such mixing. The next largest unit is the building. Segregation studies rarely analyze data at this scale, and for convenience in the maps presented in the preceding text we treated buildings as either white or black. Indeed, most buildings in Philadelphia in 1880 were 100 percent of a single race, and we will show that segregation was similar at the building and household scales.
The scales at which historical researchers usually measure segregation are larger areal units like blocks, EDs, and wards, because these are the scales at which administrative data are most commonly published. Based on our detailed mapping in 1880, we consider the block to be deceptive. Consider the block in figure 3 formed by Locust, Ninth Street, Walnut, and Duponceau. It is racially mixed. And yet all but one of its black residents live on an alley called Lark Place, and all the white residents live on another unnamed alley or on the east side of Ninth Street, with only that one black building breaking up this racial apartheid. Consider another case in the same area: Curant Alley between Locust and Walnut. The buildings on this street segment are almost all black. But if we thought about segregation at the scale of the block, the many black neighbors on opposite sides of the street would be treated as living in separate areas, while all of the white buildings on the east side of Eleventh Street would be treated as “sharing the block” with the black buildings on the west side of Curant Alley. The problem is not resolved by the estimation techniques of sophisticated “spatial segregation” measures that rely on block data. Having no information on where people live within the block, all are assigned to the same central point in the middle of the block or they are assumed to be uniformly and randomly distributed within the block. Even using point data, a measure that is based on Euclidean distance rather than the actual street network would not reveal the clear spatial separation shown here.
For these reasons, although we recognize the value of larger areal units like EDs and wards, we utilize the street network to identify smaller areas. The street segment is our basic multibuilding unit. This is the scale at which many sociologists believe face-to-face interaction among neighbors primarily occurs (Grannis Reference Gibson2009), among persons who live on either side of a street between two intersections. The next larger natural unit is the segment group, including the focal street segment and the segments to which it is connected at both intersections. For example, in figure 3, Hutchinson between Walnut and Locus is a segment. Its segment group includes two segments of Walnut at its northern end, two segments of Locust on its southern end, and the continuation of Hutchinson between Locust and Aurora. Note that segregation between street segments will pick up the separation between blacks and whites that we have identified in the alley and isolated black segment patterns. However, at the scale of segment groups, the isolated black segment will be combined with its connected white segments, and black alleys will sometimes be combined with connected white streets.
For completeness, we also define the “extended segment group,” which includes another layer of connected segments around the segment group. Treating the Hutchinson segment as the focal segment, the extended segment group would include several more segments such as Tenth Street both north and south of Walnut. The “neighbors” of a resident of the Hutchinson segment would include people on any segment within two blocks’ walk.Footnote 9 High levels of segregation at this spatial scale and even larger spatial scales became commonplace in northern cities by the middle of the twentieth century, but we would expect this phenomenon of the large concentrated ghetto to be less likely at a time when the black population is a tiny fraction of the total.
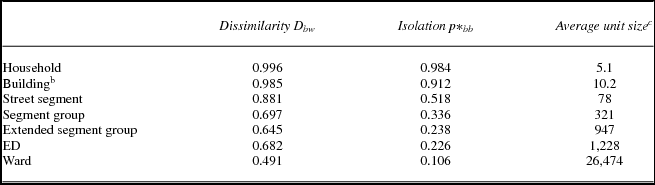
Table 4 reports measures of segregation and black isolation in 1880 at all of these scales. The average unit size is the average number of residents included at each scale. In 1880, most buildings in Philadelphia were narrow row houses accommodating a single household. The building-level measures of segregation in table 2 include only multihousehold buildings (16 percent of the total). Half of black Philadelphians lived in buildings with more than one household, often in former one-family buildings that were enlarged to three-unit structures abutting the rear yard outhouses (DuBois Reference DuBois1967 [1899]: 293–94). Segregation at this scale was extreme. The value of D was very close to one at both the household and building level. The average black person (not counting live-in domestic servants in white households) lived in a household that was 98.4 percent black and, if in a multifamily building, a building that was 91.2 percent black.
Black-white segregation in Philadelphia at varying spatial scales, 1880Footnote a

a Black live-in domestics in white households are omitted.
b Multifamily buildings only.
c Average sizes of overlapping segment groups are reported.
Street segments included many more people (78 on average), and they were more mixed. The average black person lived on a racially mixed but majority-black street segment (51.8 percent). This was a highly segregated outcome in the following sense, which is measured by D: Blacks were distributed among street segments in a way that was very different from whites, and blacks lived on streets that were disproportionately black relative to the whole city. If black residents typically had white neighbors, this is because most Philadelphians were white. White residents, in contrast, on average had few black neighbors, and in fact most whites lived on all-white street segments. D was very high at the street segment scale (.881). It was higher than segregation in the city in 2010 at the census tract scale (.73), higher than we have calculated at the block level (.64 using PSHP grid cells) in that year, and higher than the .52 reported at an approximation of the tract level for 1880 by Hershberg et al. (Reference Hershberg, Burstein, Ericksen, Greenberg and Yancey1979). In our view, given the specific spatial pattern of racial settlement in the city in 1880, the street segment is the most appropriate scale at which to assess segregation. At this scale, segregation was extreme.
The results change if we shift to large geographic units. At larger scales, many disproportionately black street segments are combined with surrounding segments with fewer black residents. The average black person lived on a segment group, extended segment group, or ED that was only around 20 to 30 percent black. At these scales, D is also lower, but still above the level of .60 that urban researchers treated as “very high” in the late twentieth century.
At the much larger ward level (with populations averaging above 25,000) D was only .43 and the average black person lived in a ward that was only 10.6 percent black. Few wards had such a large black representation: Seventh (22.3 percent), Eighth (15.8 percent), Fifth (16.6 percent), and Fourth (13.6 percent). The ward with the next largest concentration was less than 7 percent black. Scholars who relied on ward data, which were the only published census statistics for 1880, understandably concluded that segregation was moderate at the end of the nineteenth century. Segregation is invisible when studied at the wrong spatial scale.
Class Standing and Black Segregation
A final question that we consider here is whether segregation was conditional on social class. An important conclusion in DuBois's work is that there was substantial class variation within the black community at the time of his survey. His careful mapping of the Seventh Ward distinguishes the homes of the “vicious and criminal classes,” the poor, the working people “fair to comfortable,” and the middle classes. These classes are somewhat intermingled, although “at the corner of Seventh and Lombard, we can at a glance view the worst Negro slums” (Reference DuBois1967 [1899]: 58), with nearby alleys that are “haunts of noted criminals,. . . of gamblers and prostitutes, and at the same time of many poverty-stricken people, decent but not energetic” (ibid.: 60). In contrast, just a block west along Lombard “the atmosphere suddenly changes, because these next two blocks have few alleys. . . . Here some of the best Negro families of the ward live” (ibid.: 60).
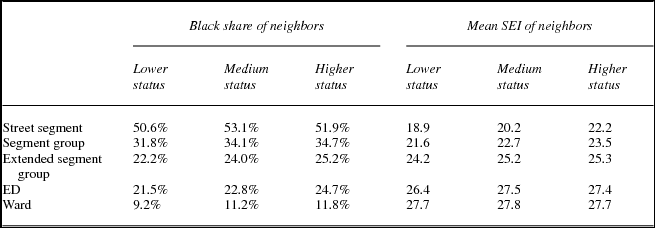
It is beyond the scope of this study to examine in detail the class variations among blacks, but we can address a question that is at the heart of understanding the segregating process that generated such a high degree of racial segregation. Did black people live in disproportionately black areas because they were black, regardless of their class standing? Or was their distinctive location strongly influenced by their average (low) class position, so that those with higher status were found in more integrated settings? This is a question that has been studied through locational attainment analyses, where occupational standing can be tested as a predictor of the racial composition of people's neighborhoods (Logan et al. Reference Logan, Zhang and Chunyu2015a, Reference Logan, Zhang, Turner and Shertzer2015b). We take a simpler approach here, using the occupational SEI to index class standing. Results are presented in table 5, showing at each spatial scale in 1880, how the racial composition of one's neighborhood (measured by P*bb) and the average occupational status of neighbors (measured by their SEI) varied with the household's own occupational standing. We divide black households into three categories of occupational SEI: the lower values (less than or equal to 8), higher values (18 and higher), and those in between. In our sample of black households, “laborers” are more than half of those in the lower category (SEI = 8), “waiters/waitresses” (SEI = 16), and “laundry” (SEI = 12) are the most common in the middle category, and “dressmaker” or “seamstress” (SEI = 23), “merchant/dealer” (SEI = 68), and “brick and tile maker” (SEI = 18) are the most common in the upper category.
Measures of exposure (p*): The black share of residents and the mean SEI of residents at varying spatial scales, by the occupational status of the household (black-headed households in 1880)

We do not include calculations at the household and address level. Table 4 showed that blacks’ households and buildings are close to all black, the SEI of households is necessarily closely related to the highest SEI in the household, and most buildings in Philadelphia contained only one household. It is at higher spatial scales that class differentiation might appear. We find very modest differences. Higher-status black households live on street segments that have almost the same racial composition as those of lower-status black households, and their neighbors at higher scales are slightly more likely to be black. There is some class differentiation at the level of street segments, where the average SEI of higher-status households’ neighbors is about three points higher than for lower-status households. These differences become smaller at larger scales. Hence although there was considerable variation in blacks’ class position in Philadelphia in 1880, consistent with DuBois's account, their status had very small impact on the composition of their local environment.
Conclusion
We have shown that high levels of racial segregation in Philadelphia can be traced back to before the Civil War when blacks were less than 5 percent of the population. Although many social scientists beginning as early as DuBois perceived the black population to be more spatially dispersed in the nineteenth century, that perception is based on incomplete information. DuBois, writing even before the 1900 census, was able to draw on his own painstaking fieldwork in the Seventh Ward, which he thoroughly mapped by race and occupation. He correctly perceived that blacks had been moving over time beyond the original slum settlement around Sixth and Lombard, but he did not have access to detailed information for the whole city. Some subsequent researchers relied on published ward-level census data that could not pick up segregation at a finer scale. The researchers associated with the PSHP, who assembled data at close to the block level, felt they needed to aggregate it to match contemporary census tracts in order to have a time series in comparable geographical units.
We have taken advantage of new data sources and methodologies to obtain a much closer reading of the situation. We were able to import the PSHP grid-cell data into a GIS for each decade from 1850 to 1880. These data will be a useful resource for future studies that can exploit other information gathered by that project, such as age, gender, and country of birth for a 100 percent sample of residents. We also drew on the geocoded building-level data for 1880 from the Urban Transition HGIS, and a new ED map and 100 percent sample developed in conjunction with researchers at the University of Pittsburgh. The resulting analyses show a high but fairly stable level of segregation over the full 50-year period, and continuing growth around the edges of black settlement areas of the city.
Two other set of findings emerge from the analysis. The first is a new understanding of the spatial configuration of black residences that could only be gleaned from a microlevel, building-by-building mapping. Philadelphia's black population in 1880 lived mostly in these kinds of settings: as many as half in a large cluster of all-black buildings located in the old central city, a substantial share in alleys and short streets that were adjacent or parallel to predominantly white street segments, others in isolated black street segments, and the remainder scattered throughout the city. In all of these settings one could argue from one point of view that segregation was mitigated by the sheer proximity between whites and blacks. Blacks may have lived in all-black households in all-black buildings on mostly black street segments, but they were never far from potential contact with whites. We hold a different view, that the highly patterned arrangement of whites and black in a relatively confined space indicates that they were not neighbors at all.
The second finding concerns the relevance of black residents’ class position on their residential outcome. A component of any definition of ghettoization is that people live in a certain kind of place based on no other consideration than their race or some other ascriptive characteristic. We asked simply whether the racial or class composition of people's local context depended on their own occupational standing. We examined this question at several spatial scales (the street segment, segment group, or larger units). We found minor differences at every level. Households whose highest status member was in the low SEI category (e.g., laborers) lived in locations that actually averaged 2 percent lower share of black neighbors, and only two points higher SEI of neighbors than households including a higher-status worker (e.g., a merchant, dressmaker, or brick maker).
We look forward to future studies of other cities in both the North and the South, and for comparable data for other census years. The archive assembled by the PSHP is a unique resource that is unlikely to be replicated soon for censuses as early as 1850, when enumerators did not record addresses. However, work is in progress to push ahead with detailed mapping of 100 percent census samples for many cities in the years 1900 and beyond. These approaches, especially in combination with spatial data of other kinds and from other sources, offer potential for newer and more definitive answers to longtime questions.
Acknowledgments
This research was supported by research grants from National Science Foundation (SES-1355693) and National Institutes of Health (1R01HD075785-01A1) and by the staff of the research initiative on Spatial Structures in the Social Sciences at Brown University. The Population Studies and Training Center at Brown University (R24HD041020) provided general support. We acknowledge the contribution of the Philadelphia Social History Project and of Dr. Allison Shertzer (University of Pittsburgh), who created the 1900 map and data set for Philadelphia. The authors have full responsibility for the findings and interpretations reported here.
Supplementary material
To view supplementary material for this article, please visit http://dx.doi.org/10.1017/ssh.2016.27