1. INTRODUCTION
The ever-increasing public interest in location and positioning services has created a demand for high performance Global Navigation Satellite Systems (GNSS). Multipath propagation, as the dominant source of ranging errors (Parkinson and Spilker, Reference Parkinson and Spilker1996, Misra and Enge, Reference Misra and Enge2006), results in biased and corrupted GNSS measurements, which leads to inaccurate position estimates or even loss of signal lock. Several techniques which can reduce the effects of multipath are proposed in the literature; however no fully satisfactory solution has been found and this issue is consequently highly relevant.
Among the multipath mitigation techniques, probably the simplest ones are those that apply special antenna designs such as the use of choke rings and dual-polarisation (Manandhar and Shibasaki, Reference Manandhar and Shibasaki2004) antennas to prevent secondary reflections from entering the receiver front end. However, these techniques are not able to completely eliminate multipath reflections in dense multipath environments (Dragunas and Borre, Reference Dragunas and Borre2011) since they can only remove reflections arriving from low elevation angles.
The most common delay measurement techniques implemented in today's commercial GNSS receivers are the classical feedback code delay tracking loops that make use of special correlators. The most widely known feedback-delay estimator is the standard wide correlator Delay Lock Loop (DLL) or Early-Minus-Late (EML) loop (Fock et al., Reference Fock, Baltersee, Schulz-Rittich and Meyr2001). The classical EML fails to cope with multipath components with relative (to line of sight – LOS) delays smaller than one chip (Braasch, Reference Braasch1992). With the aim of reducing the effect of multipath, several enhanced methods such as Narrow Correlator (Van Dierendonck et al., Reference Van Dierendonck, Fenton and Ford1992), which narrows the correlator spacing, and the Double-Delta correlator technique, which uses four correlators in the tracking loop (Irsigler and Eissfeller, Reference Irsigler and Eissfeller2003), have been developed. Well-known examples of the double-delta technique are the High Resolution Correlator (HRC) (McGraw and Braasch, Reference McGraw and Braasch1999), the Strobe Correlator (SC) (Garin and Rousseau, Reference Garin and Rousseau1997), and the modified correlator reference waveform (Weill, Reference Weill2003). Another feedback-tracking structure is the Early-Late-Slope (ELS), which is also known as the Multipath Elimination Technique (MET) (Townsend and Fenton, Reference Townsend and Fenton1994). Although these enhanced techniques can reduce the multipath bias on code pseudorange measurements as compared to the standard early-late correlator, their performance in severe multipath scenarios is still limited. The reason is that in dense multipath environments, the Pseudo Noise (PN) correlation peak might be shifted due to interference from adjacent paths. Since the stable lock point of these tracking techniques is generally near the maximum power of the autocorrelation function, the errors of adjacent paths cannot be completely compensated for unless the chip duration of the PN sequence is shorter than the arrival time intervals between the first path and subsequent paths. However, in urban propagation channels, the delay between paths can be very short (of the order of tens of nanoseconds) and the available signal chip rate is limited in practice.
The other class of multipath mitigation techniques includes the advanced methods such as the Multipath Estimating Delay Locked Loop (MEDLL) (Townsend et al., Reference Townsend, van Nee, Fenton and Van Dierendonck1995), the Multipath Mitigation Technique (MMT) (Weill, Reference Weill2002), the Vision Correlator (VC) (Fenton and Jones, Reference Fenton and Jones2005), which is an implementation of MMT, the Fast Iterative Maximum Likelihood Algorithm (FIMLA) (Sahmoudi and Amin, Reference Sahmoudi and Amin2008), the sequential maximum likelihood technique proposed by Sahmoudi and Amin (Reference Sahmoudi and Amin2009), the Reduced Search Space Multipath Likelihood (RSSML) algorithm (Bhuiyan and Lohan, Reference Bhuiyan, Lohan and Jin2012) and the Teager-Kaiser-based method that compares a set of competitive peaks with some adaptive thresholds (Lohan et al., Reference Lohan, Hamila and Renfors2002). These techniques are mostly based on Maximum Likelihood (ML) estimation and are driven to approach theoretical performance limits (i.e. Cramer-Rao Lower Band). However, they are typically computationally complex and difficult to implement, since they require the employment of a large number of correlators and processing the outputs of these correlators with complex algorithms that are normally based on exploring a large search-space.
The MEDLL that is one of the most promising advanced multipath mitigation techniques (Bhuiyan and Lohan, Reference Bhuiyan and Lohan2010) uses a reference function to determine the best combination of LOS and Non-LOS (NLOS) components. Therefore, a large search space is explored at each time epoch to find the best combination of amplitudes, delays and phases for all the paths. The classical MEDLL is based on a maximum likelihood search, which is computationally intensive. However, MEDLL has initiated the design of different maximum likelihood-based implementations for multipath mitigation. One such variant is the non-coherent MEDLL, described in Bhuiyan et al. (Reference Bhuiyan, Lohan and Renfors2008) that reduces the search space by incorporating a phase-search unit, based on the statistical distribution of multipath phases. However, the performance of this approach depends on the number of random phases considered and it also increases the processing load significantly. A special implementation of MEDLL is the so-called CADLL (Coupled Amplitude-Delay Lock Loop) technique (Chen et al., Reference Chen, Dovis and Pini2010) which assigns two amplitude lock loops (for tracking the real and imaginary parts of the path coefficients) and one delay lock loop to every estimated path.
If the receiver is equipped with an antenna array, then it is possible to employ standard beam forming techniques (Van Trees, Reference Van Trees2002) in such a way that the main beam is directed to the LOS signal and nulls are approximately placed at the multipath angles of arrival. In Daneshmand et al. (Reference Daneshmand, Broumandan, Sokhandan and Lachapelle2013) the motion of the antenna array is employed to decorrelate the multipath components and also synthesize an augmented array to increase the degree of freedom of the array.
There are also a number of techniques that make use of some external devices or signals to aid GNSS in degraded signal environments such as indoors. Some examples are inertial sensors and wireless networks such as WiFi, Bluetooth or RFID. However, each of these techniques requires its own infrastructure (Dragunas and Borre, Reference Dragunas and Borre2011).
To improve the accuracy of the delay estimation in severe multipath scenarios (e.g. urban environments where the number of signal reflections is normally large and some of them might be stronger than LOS), this paper analyses high resolution subspace-based time of arrival (TOA) estimation techniques in an effort to achieve a higher TOA estimation accuracy. These techniques estimate the multipath delays in two steps. In the first step (Jeon et al., Reference Jeon, Lee, Park, Cho and Kim2010), a low-resolution channel profile, e.g., a PN correlation profile (Bouchereau et al., Reference Bouchereau, Brady and Lanzl2001) or a frequency response (Li and Pahlavan, Reference Li and Pahlavan2004) is obtained and used to compute the signal covariance matrix. Next, the resolution of the channel profile is enhanced by a high resolution technique, such as the Multiple Signal Classification (MUSIC) technique. A more precise TOA is thus determined from the first peak detected on the enhanced channel profile. This methodology provides an estimation accuracy improvement.
Subspace-based methods require a full-rank signal covariance matrix, which exists if the LOS and the multipath reflections are uncorrelated. However, in many cases, the rank of this matrix reduces to unity due to signal coherency (Bouchereau et al., Reference Bouchereau, Brady and Lanzl2001). Therefore, different techniques such as diversity reception have been employed in practice to combat signal coherency. Common diversity techniques include antenna diversity, time diversity, frequency diversity and polarization diversity. Diversity techniques take advantage of the random nature of the radio propagation channel by combining uncorrelated signal versions. However, most of the diversity techniques have been reported in the literature to be ineffective for the purpose of signal decorrelation (e.g. Li and Pahlavan, Reference Li and Pahlavan2004). For example, in time diversity the path gain coefficients remain unchanged together with path delays and in spatial and polarisation diversities, radio channels from the transmitter to different diversity branches of the receiver are most likely not the same. Bouchereau et al. (Reference Bouchereau, Brady and Lanzl2001) applied frequency diversity to decorrelate multipath signals. However, most commercial GPS receivers are single frequency receivers. Furthermore, the presence of atmospheric errors decreases the effectiveness of using this diversity (Ziedan, Reference Ziedan2011).
A fast fading wireless channel, where the receiver or the surrounding objects are in motion, such that the coherence time of the channel is smaller than the symbol period of the received signal (Rappaport, Reference Rappaport2002), intrinsically provides another opportunity to combat the problem of signal coherency. This opportunity stems from the fact that the received signal in a fast fading channel consists of a linear combination of independent frequency-shifted copies of the transmitted signal (Sadowsky and KafedZiski, Reference Sadowsky and KafedZiski1998). These independent copies of the signal produced by the wireless channel provide an inherent mechanism (Sayeed and Aazhang, Reference Sayeed and Aazhang1999) that can be exploited for the purpose of signal decorrelation via appropriate signal processing. The goal of this paper is to use a framework to fully take advantage of this opportunity in urban vehicular navigation. In this way, a trade-off can be made between the coherent integration time of the receiver and the number of available signal copies depending on the speed of the vehicle. Herein, the channel is assumed to follow the Rician fading model with a few strong multipath components and numerous weak reflections representative of most typical urban environments (Steingass and Lehner, Reference Steingass and Lehner2004). This implies that the LOS is assumed to be present but may be weaker than some of the signal reflections.
In this paper, the Doppler spectrum broadening of the fast fading channel resulting from the motion of the receiver is utilized to decorrelate signal reflections and increase the rank of the signal covariance matrix that results in improved estimation accuracy in subspace-based multipath delay estimation techniques. In the proposed algorithm, delay-domain correlator outputs at different Doppler frequencies will be combined in the computation of the signal covariance matrix. In this way, the performance loss due to the reduced effective coherent integration time in high-dynamic applications is compensated by integrating the spread signal in frequency domain. The simulations and processing results of a set of real data collected in a city core are then presented to compare the performance of the proposed method with other high performance algorithms.
A part of this work was previously presented by the authors (Sokhandan et al., Reference Sokhandan, Broumandan, Curran and Lachapelle2012) wherein the proposed system was developed by considering only the case where the rank of the signal sub-space was equal to the number of multipath components. However, the simulation results showed that even when a diversity technique or Doppler combining approach is applied to the received signal, this condition is usually not satisfied in practice. For this reason, this paper extends the previous work by also considering the case where the signal subspace is rank deficient. Moreover, in this paper, a set of data processing results is added wherein the performance of the proposed system is compared for three different trade-offs between the coherent integration time of the system and the number of Doppler branches.
The paper is organized as follows. Section 2 explains the signal and fading channel model. Section 3 provides a mathematical framework to describe the Doppler-delay representation of the multipath signal. In Section 4, a representation of the MUSIC algorithm which is based on taking advantage of the Doppler spreading of the received signal is described. Experimental results are presented in Section 5 and conclusions are drawn in Section 6.
2. SIGNAL AND CHANNEL MODEL
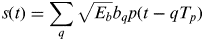
This section provides the time-frequency-based channel and signal models that underlie the development presented herein. The specular multipath channel considered here is assumed to be Wide Sense Stationary (WSS). The baseband signal at the transmitter side s(t) can be represented by
 $$s(t) = \sum\limits_q {\sqrt {E_b} b_q p(t - qT_p )} $$
where T p is the code period duration, E b is the bit energy and b qs are the navigation data bits. p(t) is the spreading waveform with the chip interval of T c and the autocorrelation function of g(τ). The signal bandwidth is  $B \approx {\textstyle{1 \over {T_c}}} $ and the spreading factor of the system is
 $N_c = {\textstyle{{T_p} \over {T_c}}} \approx T_p B \gg 1$. The complex baseband signal x(t) at the output of the channel is related to the transmitted complex baseband signal s(t) by
 $$x(t) = \int {h(t,\tau )s(t - \tau )d\tau} + n(t)$$
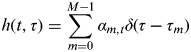
where h(t, τ) is the time-varying impulse response of the channel and n(t) is zero-mean, additive white circular Gaussian noise. The specular multipath channel with time variant coefficients can be modelled as
 $$h(t,\tau ) = \sum\limits_{m = 0}^{M - 1} {\alpha _{m,t} \delta (\tau - \tau _m )} $$
where δ(.) denotes the Dirac delta function, M is the total number of signal components including LOS, α m,t and τ m are the complex attenuation factor and the propagation delay of the m th path respectively (α 0,t and τ 0 correspond to LOS).
An equivalent representation of the channel can be described in terms of the spreading function ψ(θ, τ), defined as
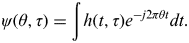 $$\psi (\theta, \tau ) = \int {h(t,\tau )e^{ - j2\pi \theta t} dt}. $$
Under the assumption that the observation time (integration time) is smaller than the coherence time of the channel, Equation (4) will result in
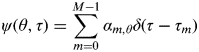 $$\psi (\theta, \tau ) = \sum\limits_{m = 0}^{M - 1} {\alpha _{m,\theta} \delta (\tau - \tau _m )} $$
where  $\alpha _{m,\theta} = \int {\alpha _{m,t} e^{ - j2\pi t\theta}} $. The spreading function quantifies the time-frequency spreading produced by the channel, θ corresponds to the Doppler shifts introduced by the channel temporal variations and τ corresponds to the multipath delays. The time-varying channel impulse response ψ(θ,τ) is often modelled as a stochastic process and the wide-sense stationary uncorrelated scatters (WSSUS) model is widely used (Bello, Reference Bello1963). In this model, the temporal variations in ψ(θ,τ) are represented by a stationary Gaussian process and the channel response at different lags are assumed independent (Proakis, Reference Proakis1995). The second order statistics characterizing the channel are given by
 $$E\left\{ {\psi (\theta _1, \tau _1 )\psi ^ * (\theta _2, \tau _2 )} \right\} = E\left\{ {|\psi (\theta _1, \tau _1 )|^2} \right\}\delta (\theta _1 - \theta _2 )\delta (\tau _1 - \tau _2 ).} $$
The function ψ(θ,τ)=E{|ψ(θ,τ)|2} is called the scattering function (Sadowsky and KafedZiski, Reference Sadowsky and KafedZiski1998) and represents the distribution of channel power as a function of multipath and Doppler shifts. The support of this function over τ denoted by T m is the delay spread of the channel and its support over θ, denoted by B d, is the channel's Doppler spread. The Doppler spread of the channel is linearly proportional to the speed of the receiver and can be expressed as  $B_d = {\textstyle{v \over \lambda}} $ (Rappaport, Reference Rappaport2002) where v is the speed of the receiver and λ is the wavelength of the signal.
3. DOPPLER-DELAY REPRESENTATION OF MULTIPATH SIGNAL
Considering the definitions in Equations (2–6), the received signal at the receiver consists of a linear combination of time shifted and frequency shifted copies of the transmitted signal. The Doppler frequency shifted copies of the transmitted signal produced by the fading channel (caused by user or caterer's motion) provide an inherent mechanism that can be exploited to improve the delay estimation accuracy via appropriate signal processing schemes. A representation of the received signal that provides a framework for exploiting this opportunity can be described as (Sayeed and Aazhang, Reference Sayeed and Aazhang1999)
 $$x(t) \approx \sum\limits_{k = - K}^K {\sum\limits_{m = 0}^{M - 1} {\psi \left( {\displaystyle{k \over T},\tau _m} \right)p(t - \tau _m )e^{\,j({{2\pi kt} / T})}}} + n(t)\quad 0 \leqslant t \lt T,} $$
where  $K = \left\lceil {B_d T} \right\rceil $ and T is the coherent integration period. Considering the assumption of the statistical independence of the channel coefficients, ψ(θ,τ), the expression in Equation (7) effectively decomposes the channel into 2K+1 independent flat fading channels by appropriately sampling the multipath-Doppler plane. The number of these available channel copies is proportional to B dT. For fixed channel parameters, this number is proportional to the time-bandwidth product of the signalling waveform. The approximation in Equation (7) can be made arbitrarily close by increasing the number of terms in the summation. However, virtually all the signal energy is captured by 2K +1 Doppler components.
Using Equation (7), the incoming signal after correlation with a replica of the modulated PRN code and sampling at the rate of F s=1/T s can be expressed as
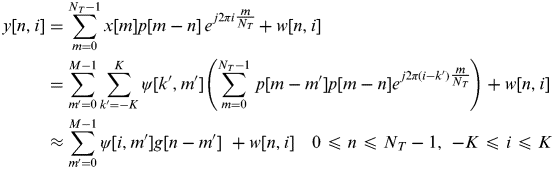 $$\eqalign{ \hskip-13pt y[n,i] &= \sum\limits_{m = 0}^{N_T - 1} {x[m]p[m - n]\,e^{\,j2\pi i\textstyle{m \over {N_T}}}} + w[n,i]\, \cr & = \sum\limits_{m' = 0}^{M - 1} {\sum\limits_{k' = - K}^K {\psi [k',m']} \left( {\sum\limits_{m = 0}^{N_T - 1} {\,p[m - m']p[m - n]e^{\,j2\pi (i - k')\textstyle{m \over {N_T}}}}} \right)} + w[n,i]\, \cr & \approx \sum\limits_{m' = 0}^{M - 1} {\psi [i,m']g[n - m']} \,\, + w[n,i] \quad 0 \leqslant n \leqslant N_T - 1,\,\, - K \leqslant i \leqslant K} $$
where n and i are the delay and frequency indexes respectively,  $N_T = \left\lceil {\textstyle{T \over {T_s}}} \right\rceil $ and w is the noise term at the output of the correlator with a variance of
 $\sigma _w^2 = {\textstyle{{2N_0} \over {T_s}}} $. A matrix representation for the relation in Equation (8) can be expressed as
 $${\bf Y} = {\bf G\Psi} + {\bf W},$$
where Y is a N×(2K+1) matrix in which
 $${\bf Y}_{n,i} = y[n,i],$$
and  $N = \left\lceil {\textstyle{{T_p} \over {T_s}}} \right\rceil $. G is an N×M matrix wherein
 $${\bf G}_{n,m} = g((n - m)T_s ),$$
ψ is the M×(2K+1) matrix described by
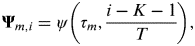 $${\bf \Psi} _{m,i} = \psi \left( {\tau _m, \displaystyle{{i - K - 1} \over T}} \right),$$
and finally W is the N×(2K+1) matrix of the noise samples at the output of the correlator with a covariance matrix of Q=σ w2G′ where G′ is an L×L matrix that can be described as G′n,m=g ((n−m)T s).
4. SUBSPACE-BASED MULTIPATH DELAY ESTIMATION
In the previous section, it was shown that the output of the correlator in a fast fading channel can be represented as a matrix of independent samples for different values of the delay and Doppler shift. This matrix was shown to be linearly proportional to the matrix of scattering function of the channel. In this section, this time-frequency representation of the channel is employed to estimate the multipath times of arrival using the MUSIC technique.
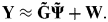
In Equation (9), every row of the scattering function matrix corresponds to one of the true multipath delays (τ ms). Given that the true multipath delays are not known to the receiver beforehand, Equation (9) is rewritten for the receiver side considering an equi-spaced search region with a duration of Δ>max{τ 1,…,τ M} including  $L = \left\lceil {\textstyle{\Delta \over {T_s}}} \right\rceil $ samples so that
 $${\bf Y} \approx {\bf \tilde G\tilde \Psi} + {\bf W}.$$
In Equation (13), assuming that the sampling period is small enough, the L×(2K+1) matrix  ${\bf \tilde \Psi} $ is formed by adding some all-zero rows to ψ at the position of delays that do not correspond to the true multipath delay. Then, the k-th column of
 ${\bf \tilde \Psi} $, namely
 ${\bf \tilde \Psi} _k $, that contains the channel impulse response at the frequency shift of
 ${\textstyle{{k - K - 1} \over T}}$, by considering Equation (5), can be expressed as
 $${\bf \tilde \Psi} _k = [a_{1,k} \,\,a_{2,k} \,\,...\,\,a_{{\rm L},k} ]^T, $$
in which
 $$a_{i,k} = \left\{ {\matrix{ {\alpha _{m,k}} & {{\rm if}\,\,iT_s \simeq \tau _m \in \left\{ {\tau _0,..., \tau _{M - 1}} \right\}} \cr 0 & {{\rm otherwise}} \cr}} \right..$$
Also  ${\bf \tilde G}$ in Equation (13) is an N×L matrix so that
 ${\bf \tilde G}_{n,m} = g((n - m)T_s )$.
Taking these into account, the rows of  ${\bf \tilde \Psi} $ can be grouped into two sets. The first set includes the rows that correspond to the true multipath delays (τ ms) and the second set includes the rest of the rows consisting of zero elements. Consequently,
 ${\bf \tilde \Psi} $ can be separated into two subsections as
 ${\bf \tilde \Psi} ^{(1)} $ (with M rows) and
 ${\bf \tilde \Psi} ^{(2)} $ (with L−M rows), corresponding to the first and second sets, respectively.
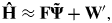
The MUSIC algorithm uses a coarse estimate of the Fourier transform of the  ${\bf \tilde \Psi} _k $s to find an estimate for the multipath delays (Li and Pahlavan, Reference Li and Pahlavan2004). Assuming H to be a L×(2K+1) matrix whose k th column is the Fourier transform of
 ${\bf \tilde \Psi} _k $, a coarse estimate of this matrix (which can be obtained by a simple spectrum division (Klukas, Reference Klukas1997)) is expressed as
 $${\bf \hat H} \approx {\bf F\tilde \Psi} + {\bf W'},$$
where F is the L×L Discrete Fourier Transform (DFT) matrix so that  ${\bf F}_{k,l} = e^{{{ - jkl}/ L}} $ and W′ is the L×(2K+1) noise matrix with a covariance matrix Q′=σ w2IL, where Ik indicates a k×k identity matrix. Considering the two subsections of
 ${\bf \tilde \Psi} $, and since the elements of
 ${\bf \tilde \Psi} ^{(2)} $ are zero, Equation (16) can be rewritten as
 $${\bf \hat H} \approx {\bf F}_1 {\bf \tilde \Psi} ^{(1)} + {\bf F}_2 {\bf \tilde \Psi} ^{(2)} + {\bf W'} = {\bf F}_1 {\bf \tilde \Psi} ^{(1)} + {\bf W'},$$
where F1 is a subsection of F including those columns of F that correspond to the rows of  ${\bf \tilde \Psi} ^{(1)} $. The other subsection of F that includes the columns of F corresponding to the rows of
 ${\bf \tilde \Psi} ^{(2)} $ is referred to as F2. Moreover, since the columns of a DFT matrix are orthonormal, it can be shown that
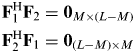 $$\eqalign{& {\bf F}_1^{\rm H} {\bf F}_2 = {\bf 0}_{M \times (L - M)} \cr & {\bf F}_2^{\rm H} {\bf F}_1 = {\bf 0}_{(L - M) \times M}} $$
where 0a×b stand for a×b all zero matrix, and the superscript H denotes the Hermitian matrix transpose. Considering Equation (16), the estimated autocorrelation matrix of the measured data can be expressed as
 $${\bf \hat R} = {\bf \hat H\hat H}^{\rm H} = {\bf F}_1 {\bf AF}_1^{\rm H} + \sigma _w^2 {\bf G}$$
where A is a M×M matrix defined as
 $${\bf A} = {\bf \tilde \Psi} ^{(1)} \left({\bf \tilde \Psi} ^{(1)} \right)^{\rm H} = \sum\limits_{k = - K}^{k = - K} {{\bf \tilde \Psi} _k^{(1)} \left({\bf \tilde \Psi} _k^{(1)} \right)^{\rm H}}, $$
Since the columns of  ${\bf \hat H}$ are the estimated channel frequency response at different Doppler frequency shifts, Equation (19) demonstrates the contribution of signals at different Doppler shifts in constructing the channel autocorrelation matrix and increasing its rank. In fact, different copies of the received signal in the Doppler-domain collaborate to make the rank of the signal subspace of the covariance matrix as close to the number of multipath components as possible. As shown in Figure 2, this improves the ability to recognize the multipath peaks from the noise peaks in the estimated delay profile. That is how the Doppler combining technique aids the estimation accuracy of the sub-space technique.
In the rest of this section, the Music algorithm for the discussed framework is explained for two different cases: when the matrix A is non-singular and when it is singular.
4.1. When matrix A is non-singular
The MUSIC super-resolution techniques are based on the eigen-decomposition of the autocorrelation matrix in Equation (19). In the case where A is non-singular (2K+1⩾M), since F1 has a full column rank, the rank of F1AF1H is M. Therefore, in this case, the L−M smallest eigenvalues of  ${\bf \hat R}$ are equal to σ w2 and their corresponding eigenvectors (EVs) are called noise EVs, whereas EVs corresponding to the M largest eigenvalues are called signal EVs. Thus, the L-dimensional subspace that contains the signal vectors
 ${\bf \hat H}$ can be split into two orthogonal subspaces, known as the signal subspace Us and the noise subspace UN, by the signal EVs and noise EVs, respectively. Taking this into account, the autocorrelation matrix in Equation (19) can be written as
 $${\bf \hat R} = {\bf U\Lambda U}^H = [\matrix{ {{\bf U}_S} & {{\bf U}_N} \cr} ]\left[ {\matrix{ {{\bf \Lambda} _S + \sigma _w^2 {\bf I}_M} & 0 \cr 0 & {\sigma _w^2 {\bf I}_{L - M}} \cr}} \right]\left[ {\matrix{ {{\bf U}_S} \cr {{\bf U}_N} \cr}} \right],$$
where Λs is a diagonal matrix containing the signal eigenvalues on its diagonal. The signal and noise subspace matrixes have the following properties:
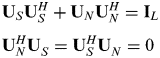 $$\eqalign{& {\bf U}_S {\bf U}_S^H + {\bf U}_N {\bf U}_N^H = {\bf I}_L \cr & {\bf U}_N^H {\bf U}_S^{} = {\bf U}_S^H {\bf U}_N^{} = 0} $$
and Equation (19) can therefore be rewritten as
 $${\bf \hat R} = {\bf U}_S {\bf \Lambda} _S {\bf U}_S^H + \sigma _w^2 {\bf UU}^H = {\bf U}_S {\bf \Lambda} _S {\bf U}_S^H + \sigma _w^2 {\bf I}_L. $$
Comparing Equation (23) with Equation (19) results in
 $${\bf U}_S {\bf \Lambda} _S {\bf U}_S^H = {\bf F}_1 {\bf AF}_1^H. $$
Hence, since A was assumed non-singular, the columns of F1 span the signal subspace and are orthogonal to the noise subspace. Therefore, the projection matrix of the noise subspace, 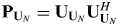 ${\bf P}_{{\bf U}_N} = {\bf U}_{{\bf U}_N} {\bf U}_{{\bf U}_N} ^H $, is orthogonal to F1 which is expressed as
 $${\bf P}_{{\bf U}_N} {\bf F}_1 = 0.$$
Equation (25) implies that those columns of F that correspond to the true multipath delays are orthogonal to the noise subspace. Thus, the multipath delays, τ 1,…, τ M, can be determined by finding the delay values at which the following MUSIC Super-resolution Delay Profile (SDP) achieves its maximum values, namely
 $$SDP(\tau _i ) = \displaystyle{1 \over {\left\| {{\bf P}_{{\bf U}_N} {\bf F}_{\tau _i}} \right\|^2}} = \displaystyle{1 \over {{\bf F}_{\tau _i} ^H {\bf P}_{{\bf U}_N} {\bf F}_{\tau _i}}} = \displaystyle{1 \over {\left\| {{\bf U}_N^H {\bf F}_{\tau _i}} \right\|^2}}, $$
where  ${\bf F}_{\tau _i} $ denotes the i-th column of F that corresponds to τ i=iT s. It should be noted here that Equation (25), which is the basis of multipath delay estimation by the function in Equation (26), holds only when the matrix A is non-singular. This is valid when the number of linearly independent copies of the signal that contribute to the computation of the autocorrelation matrix, which is the number coarse estimates of CFR on the columns of
 ${\bf \hat H}$, is larger than the number of multipath components. This is how independent estimates of CFR at different Doppler frequencies aim to increase the rank of A. It is important to consider the problem that arises if A is singular which will be explained in the next sub-section.
It should be noted at this point that when applying the various diversity techniques, Equation (26) is used exactly in the same way. The only difference is in the formation of the autocorrelation matrix in Equation (19). For example, in time diversity the columns of  ${ \bf \hat H}}$ are the coarse estimates of CFR at consecutive time snapshots with a duration of T and for spatial diversity they are the coarse estimate of CFR at the different receiver antennas. Spatial-temporal diversity is the same as time diversity when the receiver is in motion (Broumandan et al., Reference Broumandan, Nielsen and Lachapelle2011). Taking this into account, in the next section, the experimental results for the Doppler combining technique will be compared with the ones for the spatial-temporal diversity technique.
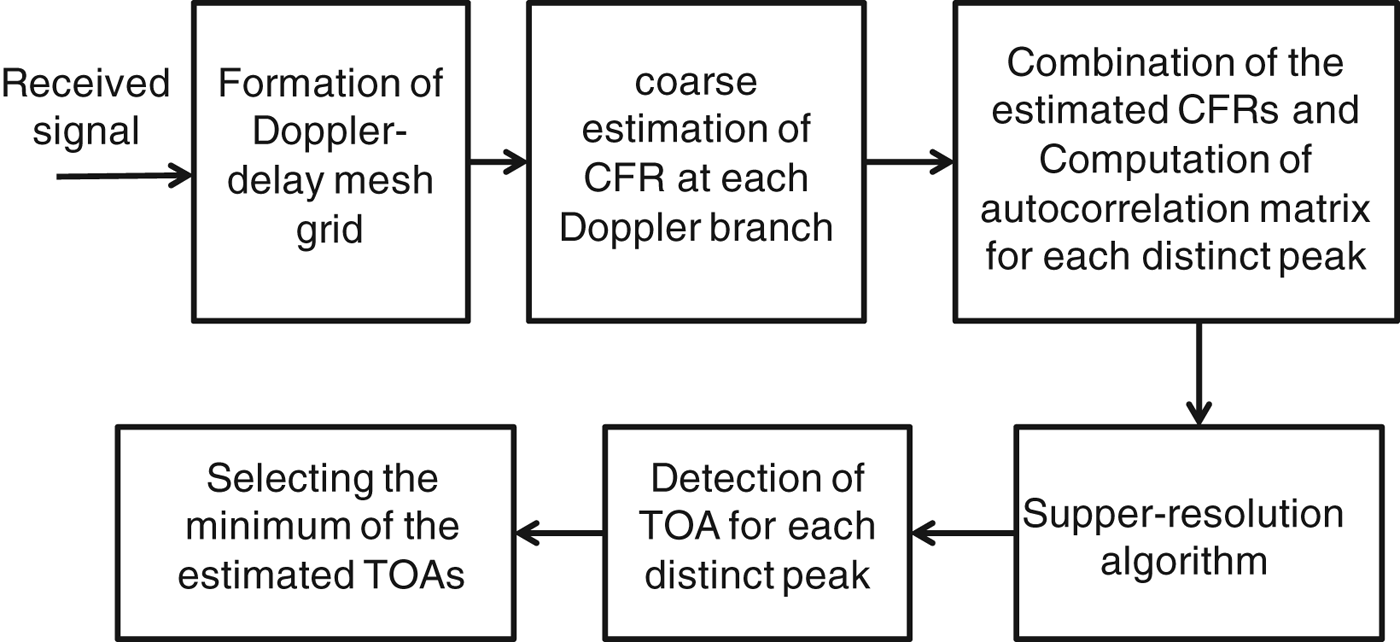
The block diagram of a receiver which employs Doppler combining in super-resolution multipath delay estimation is shown in Figure 1. The delay-Doppler grid of the received signal is first formed at the output of the correlator filter. Next, a rough estimate of the channel frequency response (CFR) is computed for the signal at each Doppler branch (each column of Y in Equation (13)) by spectrum division (Klukas, Reference Klukas1997). The resultant coarse CFRs are combined as defined by Equation (19) to form the channel autocorrelation matrix for each distinct peak (the estimated rough CFRs are located on the columns of  ${\bf \hat H}$). Next, singular decomposition (SVD) is applied to the estimated autocorrelation matrix to separate signal and noise subspaces and form the
 ${\bf P}_{{\bf U}_N} $ matrix. Finally the super-resolution algorithm is used to transform the channel autocorrelation matrix to the super-resolution delay profile, as defined in Equation (26). The estimate of the LOS TOA is then found by detecting the first peak of the delay profile obtained by applying MUSIC to each local maximum of the correlation grid. The final estimate of the TOA will be selected as the minimum of the estimated TOAs for all of the distinct peaks.
Block diagram of the proposed method.

4.2. When matrix A is singular
Consider the case where the matrix A in Equation (19) is singular with the column rank of M′=2K+1<M. In this case, Us and UN have column rank of M′ and L−M′, respectively. Since Equation (24) still holds, multiplying both sides of this equation by  ${\bf P}_{{\bf U}_N} $ results in
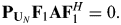 $${\bf P}_{{\bf U}_N} {\bf F}_1 {\bf AF}_1^H = 0.$$
By multiplying both sides of Equation (27) by F1 from the right side and using Equation (18), one obtains
 $${\bf P}_{{\bf U}_N} {\bf F}_1 {\bf A} = 0.$$
Moreover, A can be expressed in its singular decomposition form as
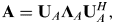 $${\bf A} = {\bf U}_A {\bf \Lambda} _A {\bf U}_A^H, $$
where the M×M′ matrix UA is the vector of the eigenvectors of A and ΛA is a M′×M′ diagonal matrix with the singular values of A on its diagonal. Substituting Equation (29) into Equation (28) results in
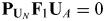 $${\bf P}_{{\bf U}_N} {\bf F}_1 {\bf U}_A = 0$$
Since the matrix UA has the full column rank of M′, Equation (30) implies that  ${\bf P}_{{\bf U}_N} $ is orthogonal to M′ independent linear combinations of the columns of F1. In other words, the column rank of F1UA is M′, which is the same as the column rank of the signal space. This fact results in the conclusion that the projection of the matrix F1UA is equal to the projection of the signal space (the columns of F1UA span the signal space or span{F1UA}= span{US}), which can be expressed as
 $${\bf F}_1 {\bf U}_A {\bf U}_A^H {\bf F}_1^H = {\bf U}_s {\bf U}_s^H. $$
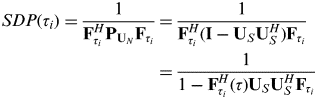
On the other hand, by substituting  ${\bf U}_N {\bf U}_N^H = {\bf I} - {\bf U}_S {\bf U}_S^H $ from Equation (22) to the denominator of Equation (26), the SDP function can be rewritten as
 $$\eqalign{SDP(\tau _i ) = \displaystyle{1 \over {{\bf F}_{\tau _i} ^H {\bf P}_{{\bf U}_N} {\bf F}_{\tau _i}}} &= \displaystyle{1 \over {{\bf F}_{\tau _i} ^H ({\bf I} - {\bf U}_S {\bf U}_S^H ){\bf F}_{\tau _i}}} \cr \, & = \displaystyle{1 \over {1 - {\bf F}_{\tau _i} ^H (\tau ){\bf U}_S {\bf U}_S^H {\bf F}_{\tau _i}}}} $$
Substituting Equation (31) into Equation (32) results in
 $$SDP(\tau _i ) = \displaystyle{1 \over {1 - {\bf F}_{\tau _i} ^H {\bf F}_1 {\bf U}_A {\bf U}_A^H {\bf F}_1^H {\bf F}_{\tau _i}}}. $$
Evaluating the normalized SDP function at different values of the delay while considering that the columns of F are orthonormal results in
 $${SDP(\tau _i ) \!=\! \left\{\! {\matrix{ {\displaystyle{1 \over {1 - {\bf F}_{\tau _m} {\bf F}_1^H {\bf U}_A {\bf U}_A^H {\bf F}_1^H {\bf F}_{\tau _m}}} = \displaystyle{1 \over {1 - {\bf U}_A^{(m)} ({\bf U}_A^{(m)} )^H}} \gt 1}& {if\,\,\tau _i = \tau _m \in \{ \tau _0 \,,...,\,\tau _{M - 1} \}} \cr {\displaystyle{1 \over {1 - {\bf F}_{\tau _i} ^H {\bf F}_1 {\bf U}_A {\bf U}_A^H {\bf F}_1^H {\bf F}_{\tau _i}}} = 1} &\hskip-48pt{if\,\,\tau _i \notin \{ \tau _0 \,,...,\,\tau _{M - 1}}}}},\right.$$
where UA(m) is the m-th row of UA. Therefore, the denominator of the SDP function is minimized but non-zero at the delays corresponding to the true multipath delay when A is not full rank and consequently the SDP function is maximized at these points. In other words, in the case where A is rank deficient, the poles of the SDP function are no more located on the unit circle. As the rank of A becomes closer to the number of multipath components, the denominator of the SDP function approaches zero.
In Figure 2, the output of the SDP function is evaluated and plotted for a simulated eight-path channel profile for different values of the rank of the signal autocorrelation matrix.
(a) CIR of an 8-path channel profile, (b-e) Normalized outputs of the SDP function at signal-to -noise ratios of 20, 10, 5 and 0 dB, respectively.
As can be observed in this figure, the height of the maxima of the function decreases with a decrease in the rank of the autocorrelation matrix. This effect can be so severe that at low SNR values, the peaks due to noise may be even larger than the peaks due to multipath signals, leading to incorrect delay estimations.
It should be noted that the above result was derived based on the assumption that the columns of F were orthogonal to each other. If instead of the DFT matrix, we had chosen F to be the matrix of shifted versions of the ideal autocorrelation function of the PRN code, as is the case in many references (Bouchereau et al., Reference Bouchereau, Brady and Lanzl2001), Equation (34) would not apply. In Figure 3 these two cases are compared for an eight-path simulated channel. It is observed that since the number of diversity branches (NB=3) is smaller than the number of multipath components (M=7), for the case where the columns of F are the shifted version of the PN correlation function and are not orthogonal (SDPC), the resulting super-resolution delay profile does not agree with the true simulated channel.
A comparison between two cases where the columns of F are orthogonal (SDPD) and non-orthogonal (SDPC).
5. EXPERIMENTAL RESULTS
In the previous sections, the possibility of taking advantage of frequency shifted copies of the signal in a fast fading channel for the purpose of signal decorrelation in a MUSIC-based delay estimation technique was discussed. In this section, the performance of the proposed estimation technique is assessed by processing a set of real GPS L1 C/A signals captured in a city core, namely downtown Calgary. The environment is an example of an urban canyon with buildings ranging in height from one to over 50 stories. Figure 4 shows the test trajectory (red curve), the sky plot of the constellation at the beginning of the test, the data collection set-up, and the vehicle speed versus time. The part with high buildings is inside the yellow rectangle shown in Figure 4(a). To eliminate the effect of correlated error sources other than multipath, a differential GPS scenario was utilized. Furthermore, an integrated GPS-INS (Inertial Navigation System) was used on the vehicle to obtain continuous reference positions at the one metre level accuracy. These reference positions were employed to assess the positions obtained by the proposed techniques. The computed delay and Doppler shift parameters from the estimated reference data were then passed to a block processing software receiver (GNSRx.ss) and were used to define the centre of the search space.
(a) Reference trajectory (b) Sky plot of the constellation (c) Vehicle speed (d) Data collection set-up.
A block diagram of the equipment configuration is shown in Figure 5. The GPS signal received by the vehicle-mounted antenna was split into two branches. The first branch was fed into a National Instrument (NI) RF front-end to be amplified, filtered, down-converted and sampled at a rate of 12.5 MHz. The second branch was connected to an integrated GNSS-INS NovAtel SPAN™ system to generate the reference positions. Data from the GNSS portion of the SPAN system was collected by an NI data acquisition board, with a sampling rate of 100 Hz. The antenna and the INS unit were mounted on the vehicle's roof. GPS data was also collected under LOS conditions with another receiver at a base station (reference) for differential processing.
Data collection architecture.
The raw GPS samples were then processed using GSNRx-ss. In this software receiver, assistance information in the form of broadcast ephemeris, raw data bits and a reference trajectory are utilized to improve tracking sensitivity. The data bits are wiped off using the known data bit information. The signal parameters estimated from the reference trajectory are used to reduce the search space. At each epoch, the reference data, which include position and velocity components, are used to generate the nominal code phase and carrier Doppler that are then passed to the signal processing channels where a grid of correlators is evaluated. Therefore, the output file of the software receiver contains a set of adjustable Doppler-delay correlation grids for each time interval equal to the coherent integration time. The duration of the coherent integration time and the range and resolution of the delay and Doppler values within the correlation grid (the number of Doppler and delay bins) can be set and the output correlation grids are centred on the true LOS delay that is provided by the aiding process. This prior knowledge of the true LOS delay was used to evaluate the performance of the approaches discussed.
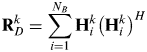
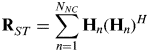
The output correlation grids produced by the software receiver were used for the computation of coarse CFR estimates by applying simple spectrum divisions at each Doppler branch (delay-domain correlation functions corresponding to each Doppler bin) and for each time interval. The outer products of each estimated CFR vector with itself were then computed and averaged depending on each combination approach to form the autocorrelation matrix. In the Doppler combining approach, the self-outer-products of the estimated CFRs on N B adjacent Doppler branches around each distinct peak were averaged to form the autocorrelation matrix whereas in the spatial-temporal diversity approach, the outer product of the estimated CFRs at the main peak over each N NC consecutive time snapshots (each equal to the coherent integration time) were averaged to form this matrix. Therefore, the computation of the autocorrelation matrix based on these two techniques can be written as
 $${\bf R}_D^k = \sum\limits_{i = 1}^{N_B} {{\bf H}_i^k \left( {{\bf H}_i^k} \right)^H} $$
 $${\bf R}_{ST}^{} = \sum\limits_{n = 1}^{N_{NC}} {{\bf H}_n \left( {{\bf H}_n} \right)^H} $$
where RDk is the computed autocorrelation matrix by the Doppler combing technique for the k-th distinct peak, RST is the autocorrelation matrix computed by the spatial-temporal diversity technique and Hik and Hn are the vectors of estimated CFRs. The ranks of the signal sub-space of RDk and RST are smaller than or equal to N B and N ST, respectively, and the equality holds only if Hik (or Hn) are statistically independent (even the independence of only the magnitudes or only the phases of the element of H's suffices).
The MUSIC algorithm was finally applied to the estimated autocorrelation matrices to form the super-resolution delay profiles (SDP) from which the estimates of the LOS times of arrival were obtained. Among all of the peaks in the output SDP that pass a threshold equal to the average magnitude of the SDP, the one that corresponds to the minimum delay is selected as the LOS signal. The difference between the estimated TOAs by the three algorithms discussed above and the one obtained from the SPAN data (the centre of the correlation function), measured in metres, determines the estimated pseudorange error. The values of estimated pseudoranges for all of the visible satellites were finally used to compute the position solution.
It is important to notice that, in practice, during the time interval that it takes to compute every estimate of the autocorrelation matrix from Equation (35-a) or (35-b) which results in a single estimate of the LOS delay, the true value of the delay slightly varies. Therefore, the final estimate is indeed an average of the true delay values within this time period.
Figure 6(a) shows an example of the Doppler-delay correlation function obtained by processing the received signal with PRN 15. In this figure, since the coherent integration time (120 ms) was longer than the coherence time of the channel, three distinct peaks appeared at the correlation surface. These peaks are highlighted in subplot (c). The delay-domain autocorrelation functions corresponding to each peak are shown in subplot (b). Each of these peaks corresponds to a cluster of multipath signals. The speed of the vehicle at the time corresponding to this figure was approximately 9 m/s. For every independent peak, N B=3 delay-domain correlation functions around the main peak were selected for use in the computation of the CFRs. In Figure 7, the super-resolution delay profiles that correspond to each of the three Doppler branches on peak 1 in Figure 6 and the SDP resulting from their combination using Equation (19) are depicted. As can be seen, the curve representing the combination of Doppler branches includes a clear peak at the centre of the delay range, corresponding to the true LOS time of arrival.
(a) Example of a Doppler-delay correlation curve with three distinct peaks shown in (c), the delay-domain autocorrelation functions corresponding to each independent peak are shown in (b).
SDPs corresponding to each of the three Doppler branches on peak 1 in Figure 6 and the resulting SDP from their combination.
Referring to Section 5, the maximum number of effective Doppler branches is  $2K + 1 = 2\left\lceil {B_d T} \right\rceil + 1$. Moreover, the relationship between the speed of the receiver and the Doppler spread parameter can be expressed as follows (Rappaport, Reference Rappaport2002):
 $$B_d = \displaystyle{v \over \lambda} $$
where v is the speed of the receiver and λ is the wavelength of signal which is almost equal to 0.2 m for L1. It is also important to remember that the coherence time of the channel that limits the effective coherent integration time of the receiver is the inverse of the Doppler spread in Equation (36).
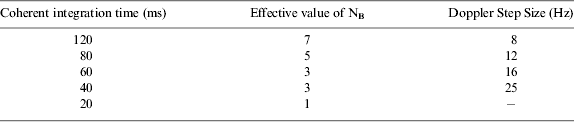
Using Equation (36), for an average speed of 5 m/s, the Doppler spread is around 25 Hz. Considering this approximated value as the Doppler spread of the channel, Table 1 summarises the effective number of Doppler branches and the approximated frequency step size for some different values of coherent integration time.
Effective numbers of Doppler branches for some different values of T.
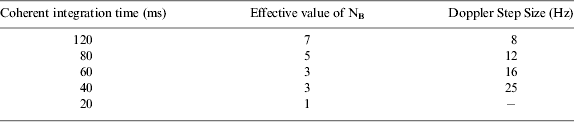
Herein, the range and the resolution of the code delay in the correlation grid were set to ±1 chips (300 m) and 0.03 chips (10 m) respectively, and the range and the resolution of Doppler frequency were set to ±28 Hz and 4 Hz, respectively. Therefore, the size of the correlation grid was 61 by 15. For the first analysis, the coherent integration time of the software receiver was set to T=60 ms. According to Table 1, for this value of coherent integration time, the maximum number of effective Doppler branches is NB=3. To have comparable results for the Doppler diversity and spatial-temporal diversity techniques, the value of N NC should be equal to N B.
Since a slight overestimation of the rank of the signal subspace in the evaluation of Equation (26) does not have a significant effect on the output of the function in practice, N B and N NC have been considered as the rank of the signal subspace of RDk and RST in the computations of Equation (26).
Figure 8 shows the estimated pseudorange errors for all visible PRNs, computed by the Doppler combining-based SDP algorithm (SDPD), SDP based on spatial-temporal diversity (SDPST) and double delta correlator technique.
Values of estimated pseudorange errors obtained with the three methods.
The correlator spacing parameters for the double delta correlator algorithm was set to 0.1 and 0.2 of a chip (Irsigler and Eissfeller, Reference Irsigler and Eissfeller2003). The coherent integration time for all of the techniques was 60 ms but for the double delta algorithm, the signals on every three successive time snapshots were again coherently averaged for the sake of comparability to the other two combining techniques.
The vehicle entered the high building zone marked by the yellow rectangle in Figure 4(a) at 2000s. Large errors occurred in the estimated pseudoranges for most PRNs as seen in Figure 8. Specifically, the transmitted LOS signals from satellites with lower elevation angels, such as PRN 7, were blocked in some parts of the trajectory. The performance comparisons of the three techniques in terms of pseudorange errors in Figure 8 imply that although exploiting the spatial-temporal diversity could slightly improve the performance of the subspace-based method, this improvement, especially in terms of error bias, is not considerable. For example in Figure 8, large biases can be observed in the values of estimation errors produced by this technique during the time interval 2600–3200 s for PRN 15. The reason is that, in a fast fading situation, the wireless channel observed from the receiver rapidly changes as the antenna moves in the dense multipath environment. For some PRNs such as PRN 15 and 24, even the conventional double delta technique outperforms the temporal diversity-based SDP. On the other hand, taking advantage of only three Doppler branches and combining them in the computation of the signal autocorrelation matrix could result in a noticeable decrease of the estimated biases. Although the resulted improvement is not dramatic for some PRNs, such as 17, a considerable improvement can be observed for PRN 11 and 7. For PRN 28, the estimation errors produced by all the three techniques are very small for the entire test. The reason is that this satellite was located at the zenith during the test time as shown in Figure 4, and this results in a strong LOS signal and insignificant multipath components.
In Figure 9, the RMS values of the computed pseudorange errors for all available PRNs during the yellow area of the test are compared.
Figure 10 shows the corresponding least squares position solution errors using the three methods and in Figure 11, their RMS values are compared.
Estimated pseudorange error RMS values for the three methods.
Position solution errors computed by the three algorithms.
Comparison of the position error RMS values computed by the three methods.
As was expected from the diagrams of the estimated pseudorange errors, the bias values of the position errors computed by the Doppler combining-based method improve as compared to the two other methods. As can be observed in Figure 8, the position errors that correspond to the double delta technique are highly biased in the time duration of 2500–3500 s. The maximum RMS errors produced by the Doppler combining-based method for East and North components are around 20 m (within different PRNs).
In Figures 12 and 13, the pseudorange estimation errors and their RMS values computed by the Doppler combining method for three trade-offs between the receiver's coherent integration time and the number of diversity branches are compared.
Comparing pseudorange estimation errors for three different values of receiver's coherent integration time.
RMS values of the pseudorange estimation errors in Figure 12.
The most important point that can be inferred from Figure 13 is that the comparison of the receiver's performance is not the same for all of the satellites. The reason is that the relative velocity between the receiver and each of the satellites and consequently the coherence time of the channel for each satellite is a function of the elevation angle for that satellite. For the satellites with higher elevation angles, such as satellites with PRN numbers of 28 and 26, the coherence time of the channel has a greater value. Therefore they can benefit from longer coherent integration durations at the receiver side. On the other hand for the satellites with the lower elevation angles and lower channel coherence time, long integrations have an adverse effect. For the signals of these satellites, the performance of the receiver can be improved by decreasing the coherent integration and increasing the number of Doppler branches instead. Therefore, depending on the relative velocity between the receiver and a satellite, optimum values for the integration time and the number of diversity branches can be found. For the case of Figure 13, if a fixed integration time is to be considered for all of the satellites, T c=60 ms seems to be the best choice among the three tested values of the integration time.
It is important to mention here that for those portions of data that corresponded to the sub-urban environment, where the effect of multipath was insignificant, the performance of the three techniques in the sense of pseudorange and positioning errors was similar (as can be observed from the first 500 s in Figures 8 and 10) and the maximum error produced by all of the three techniques was less than 20 m. On the other hand, the computational complexity of a MUSIC-based algorithm is much larger than a classic DLL such as a narrow correlator or a double-delta correlator. This increase in the computational cost is twofold. The first cause of increased complexity is due to applying a large number of correlators to obtain a high-resolution estimate of multipath delays (herein 60 correlators were used for the MUSIC-based technique whereas a narrow correlator only uses three correlators). However, in high sensitivity receivers applying a large bank of correlators is perfectly feasible (SiRFstarIII GSC3e/LP & GSC3f/LP Product Overview). The second cause of complexity is the post correlation matrix manipulations. In the MUSIC algorithm, this complexity mostly results from the singular value decomposition procedure and grows with the third order of the dimension of the autocorrelation matrix (O(N3)) (Trefethen and Bau, Reference Trefethen and Bau1997). Depending on the type of receiver, these computations may require extra software or even hardware to be added to the system. For these reasons, the optimum choice of a signal processing technique is dependent on the application and environment. Specifically, the type of the propagation channel and the expected maximum speed of the mobile device are the main parameters that should be considered.
6. CONCLUSIONS
The idea of exploiting the spectral broadening of the Doppler spectrum in fast fading channels for high-resolution estimation of multipath delays was explored and an in-depth theoretical analysis of the problem was presented. A real data test was used to assess the performance of the proposed approach and to compare it to the case where spatial-temporal diversity is applied and to the conventional correlation-based double delta correlator method. The data analysis results revealed that the spatial-temporal diversity based subspace method did not provide a considerable advantage over the classical correlation based method for most of the tested signals. On the other hand, the Doppler combining-based method could considerably decrease the amounts of bias in the estimated pseudorange values and decrease the total position error. These results indicate that proper sampling of the signal correlation function in the Doppler and code phase domains and combining the delay-domain outputs at different Doppler bins can be effective in combatting the signal coherency and rank deficiency of the autocorrelation matrix. In other words, this helps to some extent to compensate for the loss due to the limitation of the effective coherent integration time in a fast fading channel.