Introduction
Rice (Oryza sativa L.) is a staple food for a large number of people and paddy, which is the second grain product after wheat in the world in terms of cultivation area, production and consumption. Approximately 162 million hectare of rice farms in more than a hundred countries produce 755 million tons grain annually (FAOSTAT, 2019). Roughly, 90% of global rice production area is located in Asia and 80% of it is cultivated under conventional flooded conditions (Nie et al., Reference Nie, Peng, Chen, Shah, Huang, Cui and Xiang2012; Bhattacharyya et al., Reference Bhattacharyya, Neogi, Roy and Mohapatra2014). Almost 30% of the world's fresh water was withdrawn by about 80 million hectares of irrigated rice worldwide (Bouman et al., Reference Bouman, Feng, Tuong, Lu, Wang and Feng2007) and most of the global rice-producing countries are suffering economic and physical water scarcity (Nay-Htoon, Reference Nay-Htoon2016). Rice production in Turkey is about 750 000 ton 163 000 ha with an average yield of 4.6 t/ha (SGB, 2020). Increasing scarcity due to increasing demand for water from various sectors threatens the sustainability of irrigated rice production and calls for the development of novel technologies that can reduce water requirement without experiencing yield losses (Kadiyala et al., Reference Kadiyala, Mylavarapu, Li, Reddy and Reddy2012). Materu et al. (Reference Materu, Shukla, Sishodia, Tarimo and Tumbo2018) explained these enormous water requirements of the rice culture, with large quantities of water lost through evapotranspiration, seepage, surface runoff and deep percolation in the traditional rice production systems, comprising conventional flooding (CF). Among the introduced water-saving rice production techniques, aerobic rice (no flooded standing water) and alternate wetting and drying (AWD) were reported to have high water productivity with less technical complexity (Farooq et al., Reference Farooq, Kobayashi, Wahid, Ito and Basra2009). The aerobic rice system is a water-saving production system, where rice is grown under non-puddled and unsaturated (aerobic) soil (Bouman and Tuong, Reference Bouman and Tuong2001). Aerobic rice cultivation saves water input and increases water productivity by reducing water use during land preparation and limiting seepage, percolation and evaporation (Peng et al., Reference Peng, Bing, Chen, Shah, Huang, Cui and Jing2012; Natarajan et al., Reference Natarajan, Duraisamy, Thiyagarajan and Manikandan2020). Thus, to make aerobic rice successful, new varieties and management practices need to be developed. Aerobic rice production can save 60–90% of water compared to conventional flooded paddy rice but with up to 20–30% yield reduction (Tuong and Bouman, Reference Tuong, Bouman, Kijne, Barker and Molden2003; Belder et al., Reference Belder, Bouman, Spiertz, Peng, Castaneda and Visperas2005; Bouman et al., Reference Bouman, Peng, Castaneda and Visperas2005, Reference Bouman, Xiaoguang, Huaq, Zhimin, Junfang and Bin2006; Zhang et al., Reference Zhang, Lin, Bouman, Xue, Wei, Tao, Yang, Wang, Zhao and Dittert2009; Mostafa and Fujimoto, Reference Mostafa and Fujimoto2014). AWD can be described as an irrigation management system since it is a rotation of flooded and non-flooded period. Depending on the frequency, duration and timing of flooding and drying cycles, the degree of water stress during the drying period, water productivity and crop yield of AWD system varies (Chapagain et al., Reference Chapagain, Riseman and Yamaji2011). However, the decreased crop yield under water-limited conditions, which could lead to reduced economic profitability, is reported in all water-saving rice production systems, although rice is a crop which can be grown under different water availabilities, ranging from flooded to non-flooded (Bouman and Tuong, Reference Bouman and Tuong2001; International Rice Research Institute (IRRI), 2002).
It is well documented that irrigation methods affect the crop performance, including yield, quality and water productivity (Bozkurt Çolak et al., Reference Bozkurt Çolak, Yazar, Gönen and Eroğlu2018; Evett et al., Reference Evett, Stone, Schwartz, O'Shaughnessy, Colaizzi, Anderson and Anderson2019). The great challenge of the agricultural sector is to produce more food from less water, which can be achieved by increasing crop water productivity (Zwart and Bastiaanssen, Reference Zwart and Bastiaanssen2004). A number of studies aiming to increase the water productivity have been conducted on the basis of alternative irrigation techniques and technologies, as well as on the alternative farming techniques. Among the methods for increasing rice WP are intermittent irrigation/alternate submergence, system of rice intensification, direct seeded rice cultivation, use of tolerant varieties, aerobic rice cultivation and adoption of micro irrigation systems (Borojeni and Salehi, Reference Borojeni and Salehi2013; Jayapalreddy and Shenoy, Reference Jayapalreddy and Shenoy2013; Parthasarathi et al., Reference Parthasarathi, Vanitha, Mohandass and Vered2013; Adekoya et al., Reference Adekoya, Liu, Vered, Zhou, Kong and Qin2014).
Rice is highly susceptible to water stress during the reproductive stage, leading to a significant reduction in grain yield (Kamoshita et al., Reference Kamoshita, Babu, Bhupathi and Fukai2008; Palanog et al., Reference Palanog, Swamy Mallikarjuna, Shamsudin, Dixit, Hernandez, Boromea, Sta. Cruz and Kumar2014). The yield loss magnitude depends on the growth stage and duration, and the severity of drought stress (Gana, Reference Gana2011; Kumar et al., Reference Kumar, Dixit, Ram, Yadaw, Mishra and Mandal2014). Severe drought stress applied at the vegetative stage and mild drought stress applied at the flowering stage in rice in one trial result in 20 and 28% yield loss, respectively (Babu et al., Reference Babu, Nguyen, Cahamarerk, Shanmugasundaram, Chezhian, Jeyaprakash, Ganesh, Palchamy, Sadasivam, Sarkarung, Wade and Nguyen2003).
Decreasing fresh water resources that can be allocated to agricultural irrigation has brought forward the issue of increasing the productivity of water in paddy rice, which is the most water-consuming crop. Therefore, the objectives of this study are to demonstrate the water-saving potential of surface and subsurface drip irrigated rice production as compared to CF under the Mediterranean climatic conditions; and to determine the optimum irrigation coefficient based on Class A pan evaporation for higher yield and water productivity.
Materials and methods
Description of experimental site and soil
The experimental studies were carried out at the Soil and Water Resources Unit of Alata Horticultural Research Institute (36°53′N and 34°57′E, at an altitude of 30.0 m above mean sea level), in Tarsus in the eastern Mediterranean region of Turkey during 2019 and 2020 growing seasons. In the study area, typical Mediterranean climatic conditions prevail. The mean annual rainfall is 616 mm and more than two-thirds of the rainfall is received in the period covering months of November through May. The mean annual evaporation from Class A pan is 1487 mm, average annual temperature is 17.8°C with mean humidity of 71.0% (MGM, 2019). Some physical and chemical properties of the experimental soil are presented in Table 1. The soil of experimental site is classified as Arikli clay and silty-clay texture with relatively high water-holding capacity (111 mm in the 90 cm soil depth) and has a pH range of 7.8–8.1, electrical conductivity of the saturation extract (ECe) 0.4–0.5 dS/m, and gravimetric soil water contents (SWCs) at field capacity and permanent wilting point of the root-zone 29.7–31.1 and 20.1–22.3 1, respectively. Average bulk density values varied between 1.34 and 1.43 g/cm3.
Physical and chemical properties of different soil layers of the experimental field

FC, field capacity; WP, permanent wilting point; BD, bulk density; OM, organic matter.
Experimental design and irrigation treatments
The experimental design of randomized blocs in split-plot with three replications was utilized in the study. The experimental treatments consist of two irrigation methods namely surface drip (DI) and subsurface drip systems (SDI), three irrigation coefficients designated as plant pan coefficients I1.00: Class A pan evaporation (Ep) × 1.00; I1.25: Ep × 1.25 and I1.50: Ep × 1.50, and CF system as the control plot. In the drip irrigation treatments, the plot sizes were designed as 5 m × 20 m = 100 m2. Irrigations were applied at 2–3 days frequency throughout the growing season based on accumulative evaporation from Class A pan located in the experimental area. The control plots of the study containing CF were also 5 × 20 m = 100 m2 sized and all the procedures, including water application, were performed as applied by the rice farmers in the region. Paddy rice field was kept flooded starting from one day after planting until the late grain filling stage (late July). Whenever the water level decreased below 5 cm above the soil surface, paddy rice field was regularly irrigated until the late grain filling stage in CF.
Irrigation systems
Two drip systems were used in the study. Polyethylene laterals with a diameter of 20 mm with in-line emitters spaced at 0.40 m intervals were used (Geoflow Corte Madera, CA, USA), flow rate of 2.0 litres/h at an operating pressure of 100 kPa in the surface and subsurface drip irrigation plots. A drip lateral line was laid in the rice plant rows at 0.60 m intervals in the experimental plots. In the subsurface drip system (SDI), drip lateral lines were placed under 25 cm of the soil surface in shallow furrows made by a chisel plow. Specially produced laterals are used in the subsurface drip irrigation system that prevents the root system from entering the dripper.
In the CF method, land levelling operations were carried out in the plots and each plot was surrounded by 30 cm high embankments. Rice field was kept at saturated conditions starting from a day after sawing until the plants reached a height of 15 cm, then maintained flooded 10 cm until late grain filling stage (13 and 23 September in the experimental years). Whenever the water level decreased below 5 cm above the soil surface, paddy rice field was regularly irrigated until the later grain filling stage.
Measurements and observations
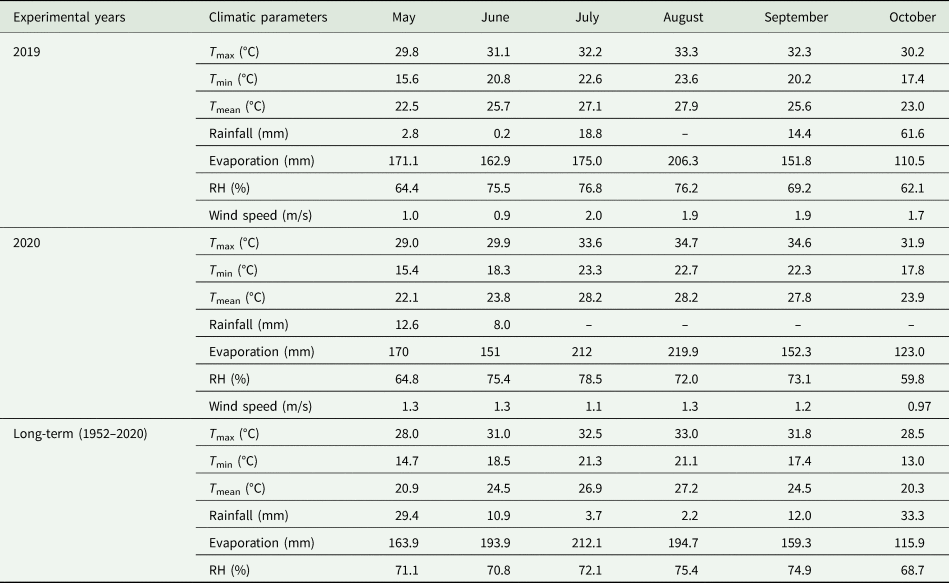
Weather data, including rainfall, maximum and minimum air temperatures, air humidity, wind speed and solar radiation, were collected from an automatic recording meteorological station located at the experimental site on a daily basis for the study years along with long-term mean climatic data from 1950 to 2019 are summarized in Table 2.
Historical monthly mean and 2019–2020 growing seasons weather data of the experimental area

T max, maximum air temperature; T min, minimum air temperature; T mean, mean air temperature; RH, relative humidity; rainfall and evaporation values are monthly total.
SWC was measured at 0.3 m increments down to 1.2 m, at depths of 30, 60, 90 and 120 cm using a neutron probe (Model 503 DR, Campbell Pacific Nuclear, Martinez, CA, USA) before each irrigation throughout the growing season. The aluminium access tubes were installed in the centre of the plots to a depth of 1.5 m in the experimental sub-plots. The surface soil layer (0–30 cm) was sampled gravimetrically at weekly intervals. Neutron meter was calibrated in the site and the calibration equation for the neutron probe was; Pv = 58.52 CR–0.12 (R 2 = 0.96**) where Pv: volumetric soil water content; CR: count ratio.
The amount of irrigation water applied to the experimental plots at each irrigation was determined with the following equation;

where I is the volume of irrigation water (litre); A is plot area (m2); E pan is the amount of water evaporated from the Class A pan (mm); K pc is plant pan coefficients (k coefficients given as sub-treatments in the experiment); P wet is wetted area fraction (1.0).
Water productivity of paddy crop was determined on the basis of the yield and total water applied through irrigation (WPI) for any treatment during the growing season and total water input (irrigation + precipitation) (WPI+P) for the growing period. Following equations were used for the determination of water productivity (WP).


where WPI is the water productivity based on the seasonal irrigation water amount applied to any treatment (kg/m3); WPP+I is the water productivity based on the sum of irrigation water amount and seasonal precipitation (kg/m3); Y is the grain yield of the treatment (kg/ha); I is seasonal irrigation water applied to a certain treatment (mm); and P is total precipitation during the growing season (mm).
Leaf area index (LAI) measurements were made at 2-week intervals throughout the growing season in the central two rows of rice plants in each treatment using the ‘LAI-2000 Plant Canopy Analyzer’ (Li-Cor 2000, Lincoln, NE, USA). Four measurements below the canopy and one measurement above the canopy were made to account for the canopy light interception at five different angles, from which LAI was computed using a model of radiative transfer in vegetative canopies.
Plant heights were found by measuring the distance from the soil surface to the tip of the spike at the top of the panicle in ten plants randomly selected from the plots during the maturation phase.
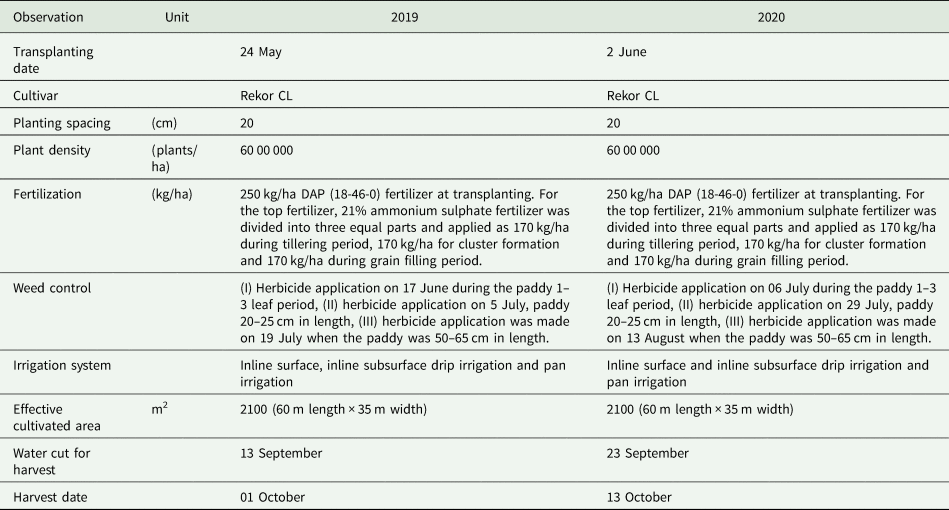
The starting and ending dates of the development periods of the rice plant were decided by observing the plants visually and the general condition of the plots. Some development periods of the rice plant are given in Table 3 for full irrigation treatments. During the study years, the total growing season length was determined as 130 and 133 days.
Some agronomic and management practices carried out during the experiments in 2019 and 2020

Agronomic practices
In this study, a local cultivar of rekor CL rice (O. sativa L.) was used, and sown with a row spacing of 20 cm on 25 May 2019 and 02 June 2020. All treatments received 250 kg/ha diammonium phosphate (DAP, 18-46-0) fertilizer at planting. For the top dressing, ammonium sulphate fertilizer (21% N) was divided into three equal parts and applied as 170 kg/ha during tillering period, 170 kg/ha during panicle formation and 170 kg/ha during grain filling period.
For weed control, herbicides were first applied during the paddy 1–3 leaf period, and the second application was carried out when the paddy was 20–25 cm in height, and the third herbicide application was made when the paddy was 50–65 cm in height. Some agronomic and management practices that were carried out during the two experimental years are summarized in Table 3.
The harvesting of the crop (grain) from each treatment and replication was made manually from the harvest area of 30 m2 (size 3 m by 10.0 m). The grain yield per hectare was calculated from the mean plot yield and expressed in kg/ha at a moisture content of 14%. The harvest index (HI) was calculated as the ratio of grain yield to above ground dry matter (DM) yield including grain yield. The sampled paddy plants were taken to the laboratory, where the following physical characteristics were analysed: ten plants from each treatment and replication were selected, labelled and the number of tiller-producing panicles was recorded and expressed in number per m2. Ten randomly selected panicles from the primary tiller were dried, their weights were recorded and the values were expressed in g/panicle. Yield components such as the number of panicles, DM yield, 1000-grain weight, number of grain in panicles, panicle length and HI were determined in harvest period in the experimental years.
Statistical analysis
Data collected were subjected to analysis of variance using the JMP Statistical software developed by SAS (SAS Institute, Inc., Cary, NC, USA). Student's t test was carried out to compare control treatment with best performing drip treatments. Least square deviation (LSD) test was used to compare the treatment means (Steel and Torrie, Reference Steel and Torrie1980).
Economic analysis
An economic analysis was carried out in order to estimate the net return generated by each treatment using the average of 2 years. The net return was calculated as the difference between total production costs and gross incomes per hectare (Kıral et al., Reference Kıral, Kasnakoğlu, Tatlidil, Fidan and Gündoğmuş1999). Information regarding rice production costs and sale prices in 2020 was obtained from the Chamber of Farmers’ Association and the Agricultural Provincial Directorate in Mersin.
Results
Phenological growth stage, yield and yield components
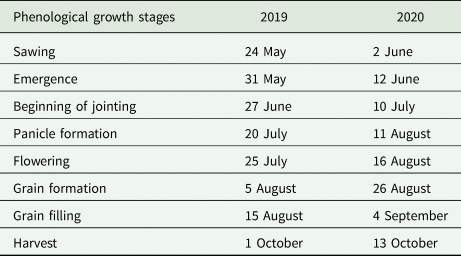
Occurrence dates of the phenological growth stages of rice were observed in the experimental plots and presented in Table 4. Direct seeding was carried out on 24 May 2019 and 2 June 2020. Emergence was observed on 31 May 2019 and 12 June 2020; jointing started on 27 June 2019 and 10 July 2020. Panicle formation was observed on 20 July 2019 and 11 August 2020; flowering occurred on 25 July 2019 and 16 August 2020; grain formation was observed on 5 August 2019 and 26 August 2020. Harvest was carried out on 1 October 2019 and 13 October 2020.
Occurrence dates of phenological growth stages of rice in the experimental years

Quantity of irrigation water applied
The seasonal total amount of irrigation water applied to the treatments during the research years is given in Table 5. In 2019, irrigation was started on 25 May, and a total of 305 mm irrigation water was applied equally to drip treatments in nine applications. Treatment irrigation was started on 26 June and a total of 34 irrigation applications were carried out. In both drip irrigation methods, a total of 795 mm irrigation water was used for I1.00, 918 mm for I1.25, 1041 mm for I1.50 and 1800 mm for CF. During the growing season of the rice, a total of 36.2 mm of precipitation was received. Irrigation was terminated on 13 September, 18 days before the harvest. Compared to CF, with both drip systems, 56% water savings were achieved in I1.00 Class A pan evaporation, 49% in I1.25 coefficient and 42% in I1.50 coefficient. In the first year, more equal water was applied compared to the second year due to the fact that the soil moisture was very low at the beginning and the air temperatures were higher after planting.
Rice seasonal irrigation, water savings, grain yield, yield reduction, WPI and WPI+P values under different treatments in the experimental years

DI, drip irrigation; SDI, subsurface drip irrigation; I, irrigation; P, precipitation; WPI, irrigation water productivity based on total irrigation; WPI+P, irrigation water productivity based on the sum of irrigation water and precipitation.
In the year 2020, irrigation was started on 2 June and a total of 285 mm irrigation water was applied equally in 11 applications. Treatment irrigation was started on 13 July and 32 irrigation applications were implemented. A total of 8 mm of precipitation fell during the second growing season. In both irrigation methods, a total of 793 mm irrigation water was used for I1.00, 920 mm for I1.25, 1047 mm for I1.50, and 2350 mm for CF. Irrigation was terminated on 23 September, 20 days before the harvest. As compared to CF, with drip systems, 66% water saving was achieved in I1.00, 61% in I1.25 and 55% in I1.50 irrigation coefficients, respectively.
Variation of soil water content
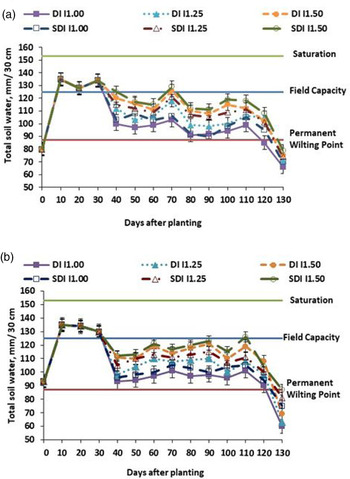
Variations of SWC in the effective root-zone depth of 30 cm in the different irrigation treatments under surface and subsurface drip irrigation systems are shown in Figs 1(a) and (b) for the 2019 and 2020 experimental years. In general, the trends of variations in SCWs during the growing seasons were similar under both drip systems for the same irrigation treatment. Soil moisture was maintained at values close to saturated conditions in 30 cm soil depth from the sowing of the paddy until the plant height was approximately 10 cm.
Colour online. Soil water storage variation prior to irrigations for the different treatments under surface and subsurface drip irrigation systems and irrigation coefficients; (a) total soil water in 2019; (b) total soil water in 2020. Vertical bars represent the mean ± s.e. (n = 17).

SWC values differed depending on the amount of irrigation water applied to the treatments since 26 June (days after planting, DAP-34), and 10 July (DAP-39) when treatment irrigations were started in 2019 and 2020, respectively. While in the DI-I1.50, SDI-I1.50, SDI-I1.25 irrigation treatment plots, SWC values remained between field capacity and 60% available water during the irrigation period, SWC in the DI-I1.25 irrigation treatment remained around 60% available water throughout the season. On the other hand, in DI-I1.00 and SDI-I1.00 treatment plots, SWC remained below 60% available water throughout the season.
In 2020, SWC in the DI-I1.50, SDI-I1.50, SDI-I1.25 treatments remained around field capacity during the irrigation period; in the SDI-I1.25 and DI-I1.25 treatments, SWC remained at 60% available water throughout the season. However, SWC in DI-I1.00 and SDI-I1.00 treatments remained below 60% available water throughout the season. In general, SWC in SDI plots were slightly greater than the DI plots for the same irrigation level. In both years of the study, the SWC in drip plots dropped below the wilting point at the end of the season.
Grain yield
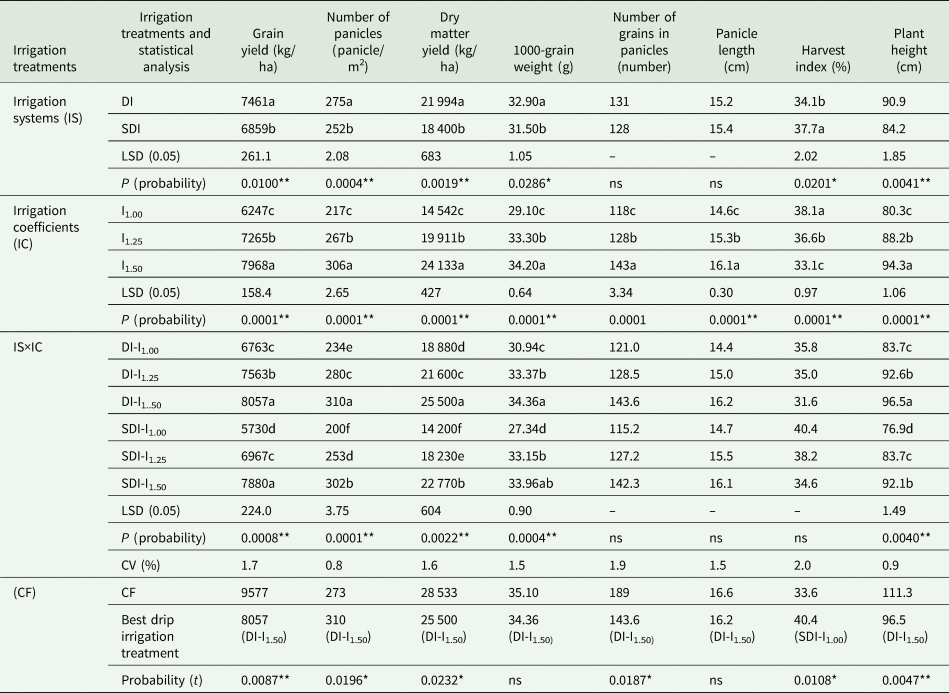
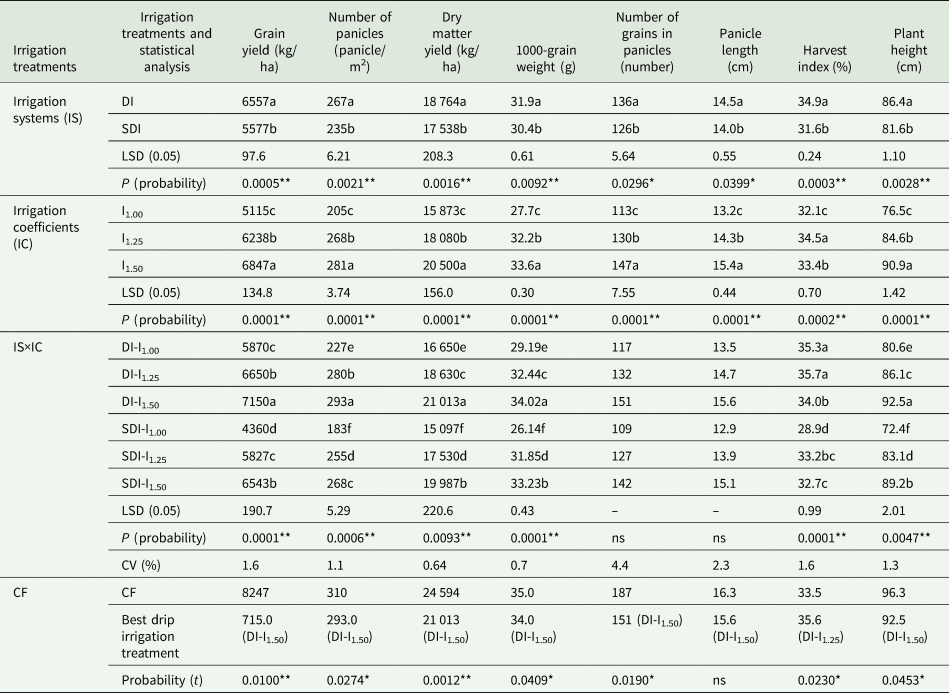
The grain yield values and statistical analysis results related to paddy yield during the research years are given in Tables 6 and 7. In the first year of the study, irrigation systems, irrigation coefficients and irrigation systems × irrigation coefficients interaction on paddy rice yields were found to be statistically significant (P < 0.01). CF produced the highest grain yield in both experimental years with 9580 and 8250 kg/ha, respectively. The lowest grain yield values were obtained as 5730 kg/ha for SDI-I1.00 and the highest grain yield of 8056 kg/ha was obtained from the DI-I1.50 drip treatment. In the second year of the study, statistically similar results were found. The lowest yield value obtained was observed in the SDI-I1.00 treatment as 4360 kg/ha and the highest grain yield was obtained as 7150 kg/ha from the DI-I1.50 treatment in drip treatments. The yields obtained in surface drip irrigation were higher than subsurface drip irrigation. In both years of the study, DI-I1.50 irrigation treatment performed the best among the drip systems, and when compared with CF, the difference between the two treatments was statistically significant (P < 0.01) in both years.
Statistical analysis results on grain yield, number of panicles, dry matter yield, 1000-grain weight, number of grains in panicles, panicle length, harvest index and plant height of rice under different treatments in the 2019 experimental year

IS, irrigation systems; IC, irrigation coefficients; CV, coefficient variation; DI, drip irrigation; SDI, subsurface drip irrigation; CF, conventional flooding.
Values followed by different small letters (a, b and c) indicate significant differences at P < 0.01 (**%1 significant level); P < 0.05 (*%5 significant level); P > 0.05 ns (not significant).
Statistical analysis results on grain yield, number of panicles, dry matter yield, 1000-grain weight, number of grains in panicles, panicle length, harvest index and plant height of rice under different treatments in the 2020 experimental year

IS, irrigation systems; IC, irrigation coefficients; CV, coefficient variation; DI, drip irrigation; SDI, subsurface drip irrigation; CF, conventional flooding.
Values followed by different small letters (a, b and c) indicate significant differences at P < 0.01(**%1 significant level); P < 0.05 (*%5 significant level); P > 0.05 ns (not significant).
Yield components
The mean values and statistical analysis results related to the number of panicles, DM yield, 1000-grain weight, number of grain in panicles, panicle length and HI, during the research years, are presented in Tables 6 and 7.
In both years of the study, irrigation systems, irrigation coefficients and irrigation system × irrigation coefficients interaction on the number of panicles were found to be statistically significant (P < 0.01). CF produced the highest number of panicles in both experimental years as 273 and 310, respectively. In the first year of the study, the lowest number of panicle values obtained was obtained as 200 panicle/m2 in SDI-I1.00, and the highest number of panicle values was obtained as 310 panicle/m2 for DI-I1.50. In the second year, the lowest number of panicle values was found in SDI-I1.00 as 183 panicle/m2 for irrigation, and the highest number of panicle value was observed in DI-I1.50 as 293 panicle/m2. In both years of the study, when DI-I1.50 irrigation treatment in drip irrigation was compared with CF, the difference between the two treatments was statistically significant (P < 0.05) (Tables 6 and 7).
In both years of the study, irrigation systems, irrigation coefficients and irrigation system × irrigation coefficients interactions on the DM yield was found to be statistically significant (P < 0.01) (Tables 6 and 7). CF produced the highest DM in both experimental years as 28 533 and 24 594 kg/ha, respectively. DM values varied from 14 200 kg/ha in SDI-I1.00 and 25 500 kg/ha in DI-I1.50 in 2019; and varied between 16 650 kg/ha in SDI-I1.00 and 21 013 kg/ha in DI-I1.50 in 2020. In both years of the study, DI-I1.50 irrigation treatment was compared with CF and the difference between the two treatments was statistically significant (P < 0.05) in 2019 and (P < 0.01) in 2020.
Thousand grain weight was found to be statistically significant (P < 0.01) in both years of the study for irrigation systems, irrigation coefficients and irrigation system × irrigation coefficients interaction (Tables 6 and 7). CF produced the highest 1000-grain weight in both experimental years as 35.1 and 35.0 g, respectively. Mean 1000-grain weight values varied between 27.3 g in SDI-I1.00 and 34.4 g in DI-I1.50 in 2019; and varied between 26.1 g in SDI-I1.00 and 34.3 g in DI-I1.50 in 2020. In both experimental years, DI-I1.50 under the surface drip irrigation was compared with CF and the difference between the two treatments was statistically insignificant in 2019 and (P < 0.05) in 2020.
The number of grains per panicle was counted in ten plants whose plant height was measured during the maturation phase. In the first year of the study, the effect of irrigation coefficients on the number of grain in panicles was found to be significant P < 0.01. CF produced the highest number of grain in panicles in both experimental years as 189 and 187 grains per panicle, respectively. The highest number of grain in panicle values was obtained from the I1.50 irrigation coefficient, 143 grains per panicle. In the second year, the effect of different irrigation systems and the irrigation coefficients on the number of grain in panicles was found to be significant at P < 0.05 and P < 0.01, respectively. In both years of the study, DI-I1.50 under the surface drip irrigation was compared with CF and the difference between the two treatments was statistically significant (P < 0.05) (Tables 6 and 7).
The effect of different irrigation coefficients on the panicle length in the first year of the panicle length study was found to be significant (P < 0.01). The highest panicle length values obtained in different irrigation coefficients were obtained from the highest I1.50 irrigation coefficient, 16.1 cm. CF produced the highest panicle length in both experimental years as 16.6 and 16.3 cm, respectively. In the second year of the study, the effect of different irrigation systems on the panicle length was found to be significant at P < 0.05, and the irrigation coefficients were found to be significant at P < 0.01. The panicle length obtained in DI was higher than the SDI. The panicle length obtained in different irrigation coefficients was obtained as 15.4 cm from the highest I1.50 irrigation coefficient. DI-I1.50 irrigation treatment in drip irrigation was compared with CF and the difference between the two treatments was statistically insignificant (Tables 6 and 7).
The HI is expressed as the ratio of grain yield obtained from each treatment to the DM yield and the ratio of the grain yield in the DM yield is calculated as a percentage (%).CF produced the highest HI in both experimental years as 33.6 and 33.5%, respectively. In the first year of the study, the effect of different irrigation systems on the HI was found to be significant at P < 0.05; the effect of different irrigation coefficients on the HI was statistically significant at P < 0.01. The mean HI obtained in DI was higher than the SDI. The highest HI value was obtained from I1.00 irrigation coefficient as 38.1%. SDI-I1.00 irrigation treatment was compared with CF and the difference between the two treatments was statistically significant (P < 0.05) (Tables 6 and 7). In the second year of the study, different irrigation systems, irrigation coefficients and irrigation system × irrigation coefficients interactions on the HI were found to be statistically significant (P < 0.01) (Tables 6 and 7). HI values varied from 28.9% in SDI-I1.00 and 35.7% in DI-I1.25. DI-I1.25 irrigation treatment was compared with CF and the difference between the two treatments was statistically significant (P < 0.05) (Tables 6 and 7).
Plant height
Plant height was found to be statistically significant (P < 0.01) in both years of the study for irrigation systems, irrigation coefficients and irrigation system × irrigation coefficients interactions (Tables 6 and 7). CF produced the highest plant height in both experimental years as 111.3 and 96.3 cm, respectively. Plant height values varied between 76.9 cm in SDI-I1.00 and 96.5 cm in DI-I1.50 in 2019; and ranged between 72.4 cm in SDI-I1.00 and 92.5 cm in DI-I1.50 in 2020. In both years of the study, the best performing drip treatment DI-I1.50 was compared with CF and the difference between the two treatments was statistically found significant (P < 0.01) in 2019 and (P < 0.05) in 2020.
Leaf area index
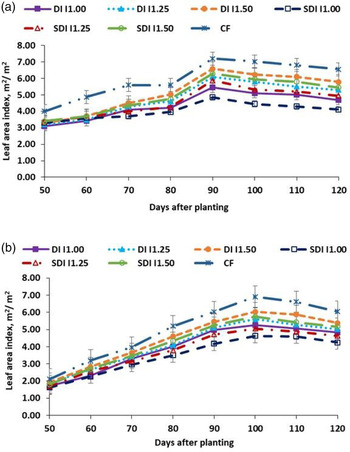
Maximum LAI values for different treatments under surface and subsurface drip systems for both experimental years and the evolution of LAI with time throughout the season are given in Figs 2(a) and (b). In 2019, maximum LAI was observed in CF (7.20), followed by DI-I1.50 (6.58), SDI-I1.50 (6.28), DI-I1.25 (6.10), DI-I1.25 (5.88), DI-I1.00 (5.45). The lowest LAI is taken from SDI-I1.00 (4.85). In 2020, maximum LAI is the highest in CF (6.91), followed by DI-I1.50 (6.03), SDI-I1.50 (5.75), DI-I1.25 (5.60), DI-I1.25 (5.25), DI-I1.00 (5.05). The lowest LAI is observed in SDI-I1.00 (4.63). It was noticed that LAI values increased as the irrigation water applied to the treatments increased in both study years. In the first year, higher LAI values were obtained compared to the second year.
Colour online. Leaf area index (LAI) variation with time for the different treatments under surface and subsurface drip irrigation systems and irrigation coefficients; (a) LAI in 2019; (b) LAI in 2020. Vertical bars represent the mean ± s.e. (n = 20).

Water productivity
Water productivity (WPI) of paddy crop is defined as grain yield production by total water applied through irrigation, and WPI+P was evaluated on the basis of the average yield and total water input (irrigation plus precipitation). WPI and WPI+P values are given in Table 5 according to the treatments during the research years. In the first year of the study, the highest WPI+P in drip irrigation subjects was obtained from DI I1.00 irrigation subject (0.81 kg/m3), and the lowest WPI+P was obtained from SDI I1.00 subject (0.69 kg/m3). In the CF method, the WP value of 0.52 kg/m3 was observed. In the second year, the highest WPI+P was obtained from DI I1.00 treatment (0.73 kg/m3) and the lowest WPI+P was observed in SDI I1.00 irrigation treatment (0.54 kg/m3). In the CF, the control treatment, the irrigation water productivity was found as 0.35 kg/m3. Similar to WPI, the lowest and highest values of water productivity based on the sum of the seasonal irrigation and precipitation amounts WP(I+P) were obtained in DI-I1.00 (0.73 kg/m3).
Economic analysis
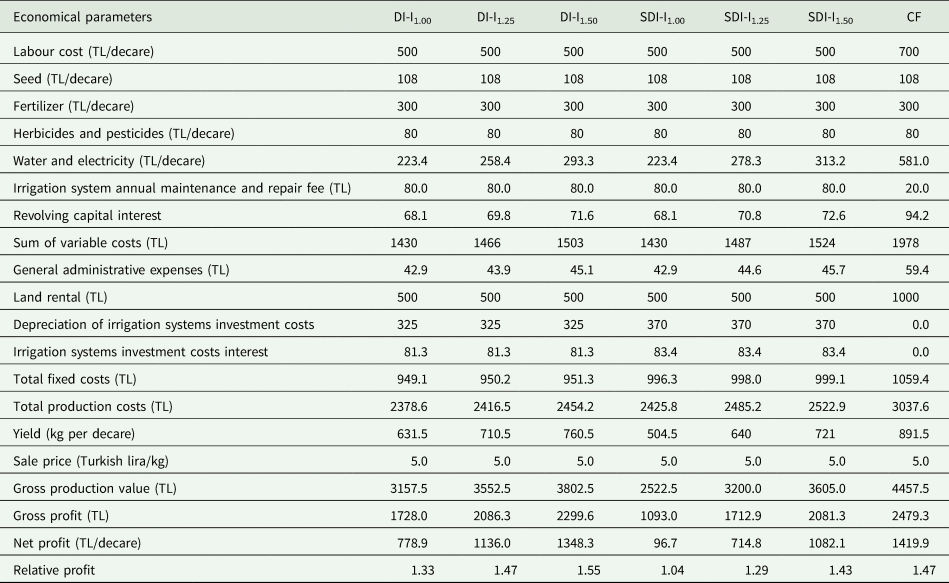
A combined economic analysis was carried out by using averages of 2-year data based on investment, operation and total production costs in 2020 and gross and net production values, and the results are presented in Table 8. Economic evaluation revealed that the maximum net income was generated as 14 199 TL/ha with CF followed by the I1.50 irrigation treatment under the surface drip treatment as 13 483 TL/ha. The lowest net return was generated by DI-I1.00 treatment. The highest relative profit value, which is defined as the ratio of gross production and total production cost, was obtained from the DI-I1.50 treatment as 1.55 followed by DI-I1.25 and CF as 1.47, and the lowest relative benefit occurred in SDI-I1.00 treatments as 1.04. Therefore, DI-I1.50 treatment is recommended for aerobic rice production in the region because of substantial water saving in this treatment as compared with CF.
Combined economic analysis results of research years of 2019 and 2020

DI, drip irrigation; SDI, subsurface drip irrigation; CF, conventional flooding; TL, Turkish Lira (1$ = 8.70TL); 1 decare = 0.1 hectare; information regarding rice production costs and sale prices in 2020 was obtained from the Chamber of Farmers’ Association and the Agricultural Provincial Directorate in Mersin.
Discussion
The CF produced a significantly greater grain yield (9580 and 8250 kg/ha) than DI and SDI in both experimental years (Table 5). Although CF produced the greatest grain yield, it consumed substantially more water than the two drip systems. Aerobic rice production with both drip systems saved a considerable amount of irrigation water as compared with CF. As an average of 2 years, water savings of 56, 49 and 42% were achieved with I1.00, I1.25 and I1.50 irrigation coefficients, respectively, with average yield reductions of 29, 20 and 15% for surface drip (DI), and 43.5, 28 and 19.5% for subsurface drip system (SDI) as compared with CF. The grain yield with an irrigation coefficient of I1.50 was significantly higher than the other irrigation coefficients of I1.25 and I1.00 under both drip systems. Treatments under surface drip system (DI) recorded greater yield than the treatment with subsurface drip system (SDI) in both experimental years. Among the drip treatments, DI I1.50 achieved the highest yield in the experimental years. The lowest grain yield was obtained from the SDI with I100 irrigation coefficient (Table 5). Mostafa and Fujimoto (Reference Mostafa and Fujimoto2014), and Tuong and Bouman (Reference Tuong, Bouman, Kijne, Barker and Molden2003) reported that aerobic rice production can save 60–90% of water compared to conventional flooded paddy rice but with up to 20–30% yield reduction. Intermittent irrigation can reduce water consumption at the field level by an average of 35% compared with continuous flooding (Bouman and Tuong, Reference Bouman and Tuong2001; Farooq et al., Reference Farooq, Kobayashi, Wahid, Ito and Basra2009; Susi et al., Reference Susi, Marasi and Soekrasno2010). Rice is very sensitive to water stress and attempts to reduce water in rice production may result in yield reduction (Singh et al., Reference Singh, Srivastava, Sangavi, Gunjan and Sharma2019). Partitioning of DM production and its distribution in different parts is important for the determination of total yield of the crop (Donald, Reference Donald1962). Similar results were reported by Natarajan et al. (Reference Natarajan, Duraisamy, Thiyagarajan and Manikandan2020) who studied the effect of irrigation levels and reported that the grain yield (5069 kg/ha) of aerobic rice recorded with the irrigation at 150% potential evaporation (PE) was significantly higher than the other three irrigation levels namely 100% PE, 125% PE and conventional irrigation. Comparatively lower grain yield under conventional irrigation conditions with soil application of nutrients might be attributed to a decrease in the synthesis of metabolites and reduction in absorption and translocation of nutrients from soil to plant. Parthasarathi et al. (Reference Parthasarathi, Vanitha, Mohandass and Vered2018) found that the grain yield under drip irrigation was recorded as higher than the conventional aerobic irrigation practice. Çakır (Reference Çakır2020) reported similar results to our study that the highest yield was obtained from CF treatment, irrigated with the highest water amounts. However, high water savings in the ranges of 24–49% and 35–60% v. grain yield decreases in the ranges of 0.60–8.04% and 10.9–57.5% were attained with intermittent and sprinkler irrigation techniques, respectively. In a study investigating the suitability of paddy varieties for different aerobic cultivation conducted in IRRI, it was found that the yield values varied between 2.4 and 4.4 t/ha, and more than 50% irrigation water was saved, depending on the applications in aerobic conditions, with 14–40% yield reduction observed as compared to flooding culture (Castaneda et al., Reference Castaneda, Bouman, Peng and Visperas2002).
SDI with lower irrigation coefficient (I100) had the least grain yield and total plant dry mass that was accompanied by a steep reduction in LAI of rice than in the surface drip irrigation treatments and as well as CF. However, Parthasarathi et al. (Reference Parthasarathi, Vanitha, Mohandass and Vered2018) reported that the total dry mass of rice was found to be increased by using subsurface and surface drip irrigation as compared with conventional aerobic rice cultivation in India. They kept the upper soil layer (0-3 cm) unsaturated in conventional aerobic rice plots and surface irrigated when the irrigationwater/cumulative pan evaporation reached 1.25. In the present study, our CF was different from conventional aerobic rice cultivation in India. The steep reduction in values of LAI in drip irrigated rice was due to poor leaf coverage under lower irrigation coefficient under minimal levels of water which supported the earlier finding of Yadav et al. (Reference Yadav, Gill, Humphreys, Kukal and Walia2011) in dry seeded rice. SWC under CF system was always higher than those under DI and SDI, which favours enhanced LAI in CF irrigation treatment.
The effect of drip irrigation treatments on yield components of aerobic rice showed significant differences among the treatments. Surface drip treatments produced a significantly greater number of panicles per unit area than subsurface drip treatments (Table 5). However, CF and DI-I1.50 treatments achieved the highest number of panicles in both experimental years. Higher number of panicles was observed in treatment DI-I1.50 (310 and 293 panicles/m2, respectively, in 2019 and 2020) with lesser panicle number observed in SDI-I1.00 (200 and 183 panicles/m2, respectively, in 2019 and 2020). The lower irrigation coefficients of I1.00 and I1.25 resulted in significantly lower panicle numbers per unit area. Therefore, water stress occurring in the lower irrigation levels reduced the number of panicles. Similar results were reported by Rahman et al. (Reference Rahman, Islam and Islam2002) who showed that the number of panicles per m2 and the number of filled grains per panicle significantly decreased with the moisture stress at critical stages of booting, flowering and grains filling. Stress between flowering and grain filling increases spikelet sterility (Matsuo et al., Reference Matsuo, Ozawa and Mochizuki2010), and during panicle initiation it inhibits panicle exertion (Okada et al., Reference Okada, Kondo, Ando and Kakuda2002), but Asch et al. (Reference Asch, Dingkuhn, Sow and Audebert2005) reported that when stressed during vegetative growth, DM partitioning was not affected. Stress at one stage can also have cumulative effects on subsequent components, for instance tiller abortion with stress during early growth (Wopereis et al., Reference Wopereis, Bouman, Tuong, Ten Berge and Kropff1996) may reduce panicle number (associated with tiller number) and the final spikelet number per unit area (Alou et al., Reference Alou, Steyn, Annandale and van der Laan2018). Alou et al. (Reference Alou, Steyn, Annandale and van der Laan2018) concluded that stress during late reproductive stages, unlike during panicle initiation, does not alter crop duration and has a negligible effect on water loss and water use efficiency. Parthasarathi et al. (Reference Parthasarathi, Vanitha, Mohandass and Vered2013) observed more number of panicles in treatment T6 (623.0 panicles/m2) (lateral distance of 0.8 m, row spacing of 20 cm with dripper flow rate 1.0 lph + 30% more water on surface) with lesser panicle number observed in T10 (421.5) (conventional irrigation at IW/CPE ratio of 1.25 at 30 mm depth of irrigation). Similarly, Natarajan et al. (Reference Natarajan, Duraisamy, Thiyagarajan and Manikandan2020) reported that a significant number of tillers was recorded with irrigation at 150% PE over the other two irrigation levels at 60 days after sowing (DAS). The number of productive tillers per m2 was significantly higher with irrigation at 150% PE compared to irrigation levels at 100% PE, 125% PE and conventional irrigation.
The highest number of grains per panicle was observed in CF followed by DI-I1.50 and SDI-I1.50. Irrigation coefficients had a significantly different effect on the number of grains per panicle, and irrigation at I1.50 produced the greatest number of grains in panicle. There was no significant difference between the two drip systems regarding the numbers of grains per panicle (Tables 6 and 7). The results indicated that the lower the irrigation coefficient the least is the number of grains in panicle. Thus, water stress reduced the number of grains in panicle. Similar results were attained concerning the panicle length in this study. Again, CF irrigated rice plants recorded the highest panicle length followed by the I1.50 coefficients for both drip systems. Borojeni and Salehi (Reference Borojeni and Salehi2013) studied the effect of irrigation treatments on panicle length and concluded that the effect was significant. They obtained the longest panicle with the treatment of continuous irrigation with a 5 cm water head every day (21.1 cm) and the shortest was found with the treatment of alternative irrigation with a 5 cm water head every 6 days (16.2 cm). Increasing the number of spikelets should be a primary target, as this had helped to increase the yield of rice even under water limitation (Peng et al., Reference Peng, Khush, Virk, Tang and Zou2008). The reduction in spikelet production under reduced water supply might be due to the abortion of spikelets in the secondary rachis branch, as documented by Kato and Katsura (Reference Kato and Katsura2014) in aerobic rice production.
Thousand grain weight was found to be statistically significant (P < 0.01) in the experimental years for DI and SDI systems, irrigation coefficients and irrigation system × irrigation coefficients interaction (Tables 6 and 7). CF produced the highest 1000-grain weight in both experimental years. Among the drip treatments, DI-I1.50 recorded the greatest 1000-grain weight and differed significantly with irrigation coefficients. DI system resulted in higher 1000-grain weight than SDI treatments. The least 1000-grain weight was observed in the SDI-I1.00 treatment. The reduction in grain weight was due to poor translocation of assimilates causing reduction in filling as explained by Parthasarathi et al. (Reference Parthasarathi, Vanitha, Mohandass and Vered2013). Suriyan et al. (Reference Suriyan, Suravoot and Kanyaratt2010) observed similar results that 1000-grain weights significantly decreased when plants were subjected to mild water stress under aerobic condition. Borojeni and Salehi (Reference Borojeni and Salehi2013) reported that the effect of irrigation on 1000-seed weight was significant. They obtained the highest 1000-seed weight with treatment alternative irrigation with a 5 cm water head every 2 days (21.1 g) and the lowest with treatment alternative irrigation with a 5 cm water head every 6 days (16.5 g).
CF produced the highest DM yield followed by the DI-I1.50 treatment in both experimental years. Surface drip treatments produced significantly greater DM yield than the subsurface drip treatments (Tables 6 and 7). SDI-I1.00 treatment recorded the least DM yield among all the treatments considered. DM yield decreased significantly with lower irrigation coefficients of I1.00 and I1.25. DI-I1.50 treatment achieved the greatest DM yield among the drip irrigation treatments in both experimental years (P < 0.01). Thus, water stress occurring in the lesser irrigation resulted in lower DM yield. Similar results were obtained by Parthasarathi et al. (Reference Parthasarathi, Vanitha, Mohandass and Vered2018) who reported that the total plant dry mass was higher in drip irrigation during the harvest phase as compared with conventional aerobic rice production due to increased canopy photosynthesis under drip irrigation system when compared to the conventional method.
Plant height was found to be statistically significant (P < 0.01) in both years of the study for irrigation systems, irrigation coefficients and irrigation system × irrigation coefficients interactions (Tables 6 and 7). CF produced the highest plant height in both experimental years as 111.3 and 96.3 cm, respectively. Among the drip treatments, DI-I1.50 treatment recorded the greatest plant height followed by the SDI-I1.50 treatment. Irrigation at I1.50 resulted in significantly greater plant height than other irrigation coefficients (P < 0.01). Water stress in lower irrigation coefficient treatments reduced plant height significantly. Natarajan et al. (Reference Natarajan, Duraisamy, Thiyagarajan and Manikandan2020) reported that irrigation at 150% PE resulted in significantly taller plants (122.9 cm) compared to irrigation levels at 100% PE, 125% PE and conventional irrigation at IW/CPE = 1.25. Borojeni and Salehi (Reference Borojeni and Salehi2013) reported that the effect of different irrigation treatments on plant height was significant. The tallest and shortest plant heights were obtained with continuous irrigation treatments with a 5 cm water head every day (90.5 cm) and alternative irrigation with a 5 cm water head every 6 days (69.9 cm), respectively.
CF produced the highest HI in both experimental years. In the first year of the study, the effect of different irrigation systems on the HI was found to be significant (P < 0.05), the effect of different irrigation coefficients on the HI was statistically significant (P < 0.01). The mean HI obtained under DI was higher than the SDI in the first year but vice versa in the second year (Tables 6 and 7). Lower irrigation coefficient I1.00 resulted in greater HI than the other irrigation coefficients. DI-I1.00 and DI-I1.25 recorded higher HI than other drip treatments in the study.
Surface drip system with I1.00 coefficient resulted in the greatest WPI and WPI+P values in the experimental years while CF had the lowest WPI and WPI+P values because of the high irrigation water amounts applied. WPI and WPI+P values increased with decreasing irrigation coefficients. Thus, irrigation at I1.00 coefficient recorded the greater WPI and WPI+P values as 0.85 and 0.81 kg/m3 in the first year and 0.74 and 0.73 kg/m3 in the second year. Greater water productivity values were obtained in the first experimental year as compared with the second due to relatively higher grain yield recorded in the first year. Mdemu and Francis (Reference Mdemu, Francis and Wurbs2013) evaluated the water productivity of rice in Tanzania, and determined WPI+P varied between 0.17 and 0.62 kg/m3. In another study (Tuong et al., Reference Tuong, Bouman and Mortimer2005), WP of rice determined on the base of the irrigation and rainfall was depicted as varying from 0.2 to 1.2 kg/m3, with an average value of 0.4 kg/m3. Higher values of 0.9–1.54, 1.73–2.48 and 0.71–0.98 kg/m3, respectively, for WPETc, WPI and WPI+P for seven rice genotypes, were reported by Lopez-Lopez et al. (Reference Lopez-Lopez, Jimenez-Chong, Hernandez-Aragon and Ibarra2018), recently. However, Aziz et al. (Reference Aziz, Bin, Imtiaz, Chen, He, Lin, Ali, Riaz, Mehmood, Rizwan and Lu2018) determined higher values for WPI+P and WPI, in the ranges of 0.83–1.20 and 1.91–2.85 kg/m3, respectively, in China. Xihua et al. (Reference Xihua, Wenxi, Jun, Guangxin, Wu and Weiguo2016) studied the effect of irrigation depth on rice production and WP. They compared traditional irrigation, shallow wet irrigation, intermittent irrigation and controlled irrigation. Their results showed that controlled irrigation provided the highest WP (1.64 kg/m3). However, the highest rice yield was obtained from the shallow wet irrigation (9867 kg/ha), which achieved the second highest WP of 1.63 kg/m3. Çakır (Reference Çakır2020) determined the lowest (WP) values, expressed both as (WPI) and (WPI+P), in the ranges of 0.27 and 0.26 kg/m3, and 0.29 and 0.27 kg/m3, respectively, for CF irrigated rice. Çakır (Reference Çakır2020) also reported that the productivity of water applied through intermittent or sprinkler irrigation techniques was much higher and reached the ranges of 0. 35–0.42 kg/m3 (WPI) and 0.33–0.39 kg/m3 (WPI+P), and 0.32–0.42 kg/m3 (WPI) and 0.26–0.37 kg/m3 (WPI+P), respectively. The differences in WP values reported in different literature sources were due to instability in rice yield, varying in the ranges of 3.0 and 8.0 t/ha, and the different concepts of water use in the production of the crop.
Conclusions
The results of the 2-year field experiments demonstrated that aerobic rice production with surface and subsurface drip systems has been proven to be effective and reliable under the Mediterranean climatic conditions. Although CF produced the greatest grain and biomass yield as compared with both drip systems but resulted in the lowest water productivity values based on average yield and seasonal applied total irrigation water as well as total water inputs (irrigation plus rainfall). Both drip systems saved a substantial amount of irrigation water (49%) in comparison with CF, however, yield reductions of 14.5 and 19.5% for surface drip (DI-I1.50) and subsurface drip (SDI-I1.50), respectively, with almost twice the water productivity. Although CF resulted in higher net benefit as compared to drip treatments, DI-I1.50 treatment can be recommended since it provided the second highest net profit and substantial water savings compared with CF.
Financial support
The authors would like to thank the General Directorate of Agricultural Research and Policy (TAGEM) for its financial support for the project TAGEM/TSKAD/G/19/P3/01-3.
Conflict of interest
None.
Ethical standards
Not applicable.