Fertility has declined throughout India at varying levels and at different speeds. The total fertility rate (TFR) varied from 1.7 in Kerala to 3.9 in Bihar in 2008 (India Registrar General, 2009b). At the one extreme, socially or economically developed states like Kerala, Tamil Nadu, Andhra Pradesh, West Bengal and Punjab have reached replacement-level fertility, while less developed states like Bihar, Rajasthan, Madhya Pradesh and Uttar Pradesh are growing at a fast rate. However, Orissa, one of the extremely backward states of India, shows an anomaly. In 2008, its infant mortality rate was moderately high at 69, and its crude death rate of 9.0 was significantly higher than the national level, whereas its crude birth rate (CBR) at 21.4 was below the national average of 22.8 (India Registrar General, 2009b). The literacy rate in Orissa at 73% is close to the national average of 74% (India Registrar General & Census Commissioner, 2011). About two-fifths of the population (39.9%) live below the poverty line, in contrast to 21.8% at the national level (Government of India, 2007). The economy is primarily agrarian; only 35% of workers in Orissa are engaged in activities outside agriculture and a very small proportion of the population of the state (17%) live in urban areas. A substantial proportion of the population (22%) belongs to various tribes, identified as ‘Scheduled Tribes’, in Orissa (India Registrar General, 2004). Therefore the question arises: why do couples in Orissa opt for lower fertility when infant mortality is moderately high, female literacy is low and two-fifths of the population live below the poverty line? This calls for an indepth study of the fertility pattern of the state.
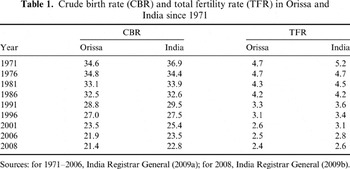
Prior to the introduction of Sample Registration System (SRS), data on fertility were scanty. Therefore indirect estimates of fertility have been obtained by different scholars. Estimation of Orissa's birth rate using the reverse survival method shows that during 1951–61 the birth rate was 40.4, lower than the all-India figure of 41.7, but during the subsequent decade (1961–71) an increase of 0.9 points was registered in the former while the later declined by 0.5 points (Premi, Reference Premi1991). Rele's (Reference Rele1987) estimation shows that the TFR in Orissa was 6.07, 5.94, 5.58 and 4.55 during 1961–66, 1966–71, 1971–76 and 1976–81, respectively, while the TFR of India was 6.05, 5.78, 5.37 and 4.65 during the same period. Different scholars have used different criteria for the determination of the onset of fertility transition. Coale &Watkins (Reference Coale and Watkins1986) and Potter et al. (Reference Potter, Schmertmann, Assuncao and Cavenaghi2010) have used a 10% decline in the TFR, while Ram (Reference Ram2006) adopted a criterion of a 5% decline in the TFR in order to determine the onset of fertility transition. Using a 5% decline in the TFR, Ram (Reference Ram2006) found that fertility transition in Orissa began somewhat during 1966–71. Table 1 shows the trends in birth rate and TFR in Orissa and India since 1971 obtained from the SRS. The CBR and TFR in Orissa declined considerably between 1971 and 2008. The CBR declined from 34.6 in 1971 to 21.4 in 2008 and the TFR declined from 4.7 in 1971 to 2.4 in 2008. Some fluctuations were observed in the CBR and TFR in Orissa during the early transitional period (in the 1970s), mainly on account of variations in quality of age–sex data. Beside this, the data from the SRS for the period 1971–81 also suffer from errors of under-reporting due to various reasons (India, Registrar General, 1983; Bhat et al., Reference Bhat, Preston and Dyson1984). Until the mid-1980s the pace of decline in fertility was slow in Orissa. This, to a large extent, may have been the effect of strong coercion during emergency period (1975–77), which brought the programme to a standstill. However, the process of fertility transition was reasonably smooth, with the CBR and TFR starting to fall substantially after the mid-80s. During the period from 1986 to 2008, the CBR dropped by 34% from 32.5 to 21.4 and the TFR by 43% from 4.2 to 2.4. The trends in TFR show that the rate of decline has been substantially higher since the mid-1980s. Overall, the percentage of annual decline in CBR and TFR during the period 1971–2006 was 1.05 and 1.34 respectively for the state as against 1.04 and 1.32 for all-India (Table 1). Hence, the process of fertility decline in Orissa can be divided into two phases: slow decline during 1971–86 and faster decline thereafter.

Crude birth rate and TFR do not provide an effective understanding of fertility trends. A more promising approach for the study of the dynamics of human fertility is to analyse parity progression ratios. Period parity progression ratios (PPPRs) are synthetic period measures that allow trends in the family building process to be studied and enable the understanding of how a society is progressing towards destabilization of high fertility (Feeney & Yu, Reference Feeney and Yu1987). Period parity progression ratios have been computed for Orissa for periods of single calendar years during 1990–2004 for progressions up to the fifth parity using the data from the National Family Health Survey III (NFHS-III). Progressions beyond the fifth birth are not computed since very few women had six or more births and the denominators for progression become quite small. Only 6.7% of women have had six or more births and only 3% have seven or more births, and so on. Therefore, it is not possible to study changes in PPPRs at higher parities using NFHS data as they cover women below the age of 50 years. Since the survey was conducted during December 2005 to April 2006 in Orissa, the PPPRs have been computed up to and including the year 2004.
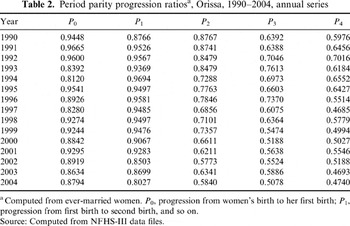
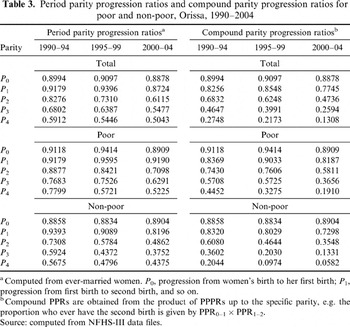
The annual series of PPPRs for Orissa during 1990–2004 are presented in Table 2. The results show that the progression to first birth has an irregular trend with the PPPR generally around 0.9 suggesting non-negligible primary sterility in the state. In the 1990s, the PPPR from the first to the second parity (P 1) has remained more or less steady, while the decline in recent years is worth emphasizing as P 1 fell from 0.93 in 2001 to 0.80 in 2004. For the PPPR from second to third parity (P 2), a clear declining trend is visible from about 0.9 in the 1990s to below 0.6 in 2004. In other words, the proportion of women moving to third parity ranged between 877 per 1000 women in 1990 to 584 per 1000 women in 2004, showing a clear-cut decline. Similarly, the PPPR to fourth birth also showed a decline, from over 0.7 in the early 1990s to about 0.5 in 2004. The PPPR values have fallen substantially for fourth and fifth parities as well. A close look at third and higher order birth progressions reveals that the tendency to go for third and higher order births has declined, though the decline is not steep as most continue to go for a second child. Some fluctuations can be seen over the period, so the trend is not steady. This has two plausible explanations. Firstly, for single years, the number of women at specified duration may not be large. Secondly, misdating of births might have caused fluctuations due to reporting errors, which often occur due to digit preferences. To avoid such shortcomings, a 5-year period was considered to be appropriate for computing PPPRs. The 5-year periods considered here are 1990–94, 1995–99 and 2000–04. The PPPRs for these 5-year periods by economic condition of the household (poor and non-poor) are shown in Table 3.
Period parity progression ratiosa, Orissa, 1990–2004, annual series

a Computed from ever-married women. P 0, progression from women's birth to her first birth; P 1, progression from first birth to second birth, and so on.
Period parity progression ratios and compound parity progression ratios for poor and non-poor, Orissa, 1990–2004

a Computed from ever-married women. P 0, progression from women's birth to her first birth; P 1, progression from first birth to second birth, and so on.
b Compound PPRs are obtained from the product of PPPRs up to the specific parity, e.g. the proportion who ever have the second birth is given by PPR0–1×PPR1–2.
The results show that the PPPR to first parity seems to be almost the same for both the poor and non-poor. However, the PPPR among the poor is comparatively higher than among the non-poor women through the 15-year period under consideration. Overall, the progression to first parity also remains constant over the period. The PPPR to second parity shows a declining trend. A decline is found among non-poor women from 0.94 to 0.82. However, a marginal decline in the progression from first to second parity is found among the poor women. If the overall decline in P 1 is flagged up this can be reinforced by saying it is almost entirely due to a decline in the rate of progression to parity 2 among ‘non-poor’ women. The PPPRs to the third and higher parities are smaller for the non-poor women compared with the poor women. Further, though the PPPR to third parity shows a decline through 1990–2004 for both the poor and non-poor, the fall is quite steep among non-poor women from 0.73 to 0.49 to third parity, from 0.59 to 0.38 to fourth parity and from 0.57 to 0.44 to fifth parity. The decline is also visible among the poor women but not to the same extent as the non-poor. There is a clear significant decline after second parity, which means that a little more than a quarter of poor women and about half of non-poor women did not go for third births in the most recent period.
Thus it is clear that half of non-poor women stop at third parity, while the same proportion of poor women stops at fifth parity. The decreases in progression to third and higher order births are faster among non-poor than among poor women. This is clear from the compound parity progression ratios, which state the proportion of women who ever reach that specific parity. This is obtained simply by the product of PPPRs up to the specific parity, e.g. the compound parity progression ratio to the second parity is the proportion who ever have the second birth, given by PPR0–1×PPR1–2. The compound parity progression ratio to third parity is given by PPPR0–1×PPPR1–2×PPPR2–3, and so on. The compound parity progression shows that there has been a marginal decline in the progression to first and second births in Orissa since 1990s (Table 3). However, a substantial decline is observed in the proportion of women who have a third child, from 68% in 1990–94 compared with 47% in 2000–04. This trend also continues in higher parities. The poor and non-poor gap is also observed in Orissa. Generally the tendency to move to parities beyond the second has declined more substantially among the non-poor compared with the poor.
In conclusion, this analysis of fertility transition in Orissa does not conform to classical theory, which states that fertility reduction requires considerable improvement in either economic or social development. Until the mid-1980s the decline in fertility was stalled, but the process of fertility transition was reasonably consistent and the CBR and TFR started falling substantially after that point. The foregoing analysis on the trends in PPPRs provides strong evidence for rapid transition towards predominantly two-child families in Orissa. The time series of PPPRs for progression from women's birth to first birth and first birth to second birth show a marginal decline in the last decade, whereas the decline is steep for higher progressions. Thus, over this period, most women continued to have at least two births but increasingly avoided subsequent births. This has led to a rapid fertility decline in the state in recent years. The more surprising observation is that there are still about 13% of women in Orissa who ever have a fifth birth. Among poor women the marked decline is visible from third-order births. Parity progression has comparatively declined more among the non-poor compared with their poor counterparts.
The evidence unambiguously shows that Orissa has progressed well into the fertility transition. Substantial fertility decline has occurred and a large proportion of couples (51%) have begun to regulate their fertility. The idea of regulation has been well accepted and modern contraceptives adopted. An interesting feature is that this change in behaviour has occurred in seemingly unfavourable conditions. In particular, child survival continues to be poor in the state, along with fairly widespread poverty and a low overall level of development.
Acknowledgments
The author is highly indebted to Professor P. M. Kulkarni, Jawaharlal Nehru University, New Delhi, India, for his invaluable suggestions, comments and guidance. An earlier version of the paper was presented at the XXVI IUSSP International Population Conference, Session 142: ‘Poverty and Fertility Linkages’ held at Marrakech, Morocco, 27th September–2nd October 2009.