INTRODUCTION
The Humboldt Current System (HCS) produces more fish per unit area than any other region on Earth, because it is one of the most productive upwelling ecosystems (Thiel et al., Reference Thiel, Macaya, Acuña, Arntz, Bastias, Brokordt, Camus, Castilla, Castro, Cortés, Dumont, Escribano, Fernández, Lancelloti, Gajardo, Gaymer, Gomez, González, González, Haye, Illanes, Iriarte, Luna-Jorquera, Luxoro, Manríquez, Marín, Muñoz, Navarrete, Pérez, Poulin, Sellanes, Sepúlveda, Stotz, Tala, Thomas, Vargas, Vásquez and Vega2007; Chavez et al., Reference Chavez, Bertrand, Guevara-Carrasco, Soler and Csirke2008). In addition to the high productivity of small pelagic fish, the HCS is notable for its large scale connectivity associated with El Niño Southern Oscillation (ENSO), decadal and centennial variability, and a large and dynamic oxygen minimum zone (OMZ) (Montecino & Lange, Reference Montecino and Lange2009). Currently, the most important process that influences the northern HCS is the ENSO, which impacts climate, ecosystems and its fisheries (Chavez et al., Reference Chavez, Bertrand, Guevara-Carrasco, Soler and Csirke2008). The ENSO has been critical in the dynamics of the HCS for at least 130,000 years, showing its maximum activity in the last 12,000 years (Moy et al., Reference Moy, Seltzer, Rodbell and Anderson2002; Cane, Reference Cane2005). The ENSO impacts may induce changes in population survival and/or recruitment, producing variations in the local abundance, geographical distribution and gene flow structure of populations (Camus, Reference Camus2008). Some studies have revealed a genetic bottleneck after ENSO events in seaweeds and fur seals of the northern HCS (Martínez et al., Reference Martínez, Cárdenas and Pinto2003; Oliveira et al., Reference Oliveira, Meyer, Hoffman, Majluf and Morgante2009). If a single event can produce such result, the question arises as to what the cumulative effects may be at a longer time scale. In this respect Thiel et al. (Reference Thiel, Macaya, Acuña, Arntz, Bastias, Brokordt, Camus, Castilla, Castro, Cortés, Dumont, Escribano, Fernández, Lancelloti, Gajardo, Gaymer, Gomez, González, González, Haye, Illanes, Iriarte, Luna-Jorquera, Luxoro, Manríquez, Marín, Muñoz, Navarrete, Pérez, Poulin, Sellanes, Sepúlveda, Stotz, Tala, Thomas, Vargas, Vásquez and Vega2007) predicted that taxa with high connectivity and large geographical ranges should be less affected by ENSO than others characterized by low connectivity and/or narrow distribution ranges. However, empirical data are needed to confirm these predictions. Recent phylogeographical studies in the HCS supported a past spatial expansion of seaweed and crustacean populations (Teillier et al., Reference Tellier, Meynard, Correa, Faugeron and Valero2009; Haye et al., Reference Haye, Salinas, Acuña and Poulin2010). All these studies estimated the time of the expansion to be the Last Glacial Maximum (~20,000 years), which is the most common historical factor used to explain these patterns in phylogeography (Avise, Reference Avise2000; Hewitt, Reference Hewitt2004). However, a more ancient expansion has been estimated in the HCS (~400,000 years) in the gastropod Concholepas concholepas (Cárdenas et al., Reference Cárdenas, Castilla and Viard2009). This evidence rejects the hypothesis that recent perturbations like ENSO could have generated a population bottleneck and the reduction of genetic diversity in marine populations (Martínez et al., Reference Martínez, Cárdenas and Pinto2003; Oliveira et al., Reference Oliveira, Meyer, Hoffman, Majluf and Morgante2009).
In the HCS the Patagonian squid Doryteuthis gahi (d'Orbigny, 1835) lives on the continental shelf where its complete life cycle takes place. Based on landings in Peruvian waters, Villegas (Reference Villegas2001) demonstrated a relationship between El Niño and La Niña events and D. gahi catches, which suggested that warmer periods may affect negatively the population size of this species. However, Semmens et al. (Reference Semmens, Pecl, Gillanders, Waluda, Shea, Jouffre, Ichii, Zumholz, Katugin, Leporati and Shaw2007) mentioned that ENSO events could potentially cause a shift in distribution rather than a decline in overall population size. The life cycle of D. gahi may permit such a distribution shift to deeper waters; it is known that adult vertical migrations are associated with changes in the water temperature. Adults are found at greater depths (400–600 m depth) in winter and migrate toward shallow waters in summer where they mate and lay egg masses on the seabed (8–70 m depth) (Arkhipkin et al., Reference Arkhipkin, Laptikhovsky and Middleton2000; Villegas, Reference Villegas2001; Laptikhovsky, Reference Laptikhovsky2008). Juveniles move to deeper waters of the shelf where they feed and mature; adults then return to the coast to spawn and die (Hatfield et al., Reference Hatfield, Rodhouse and Porebski1990; Arkhipkin et al., Reference Arkhipkin, Grzebielec, Sirota, Remeslo, Polishchuk and Middleton2004).
Previous genetic studies of D. gahi in the south-west Atlantic found an absence of population genetic structure that suggests the existence of important gene flow in this species (Carvalho & Loney, Reference Carvalho and Loney1989; Carvalho & Pitcher, Reference Carvalho and Pitcher1989; Shaw et al., Reference Shaw, Adcock, Burnett, Carvalho and Arkhipkin2004). Apparently, oceanographic conditions of the south-west Atlantic favour the dispersal of the paralavae and adults and result in homogenization of the population (Vega et al., Reference Vega, Rocha, Guerra and Osorio2002; Shaw et al., Reference Shaw, Adcock, Burnett, Carvalho and Arkhipkin2004). However, at a larger geographical scale, significant differentiation was found between samples from the Falkland Islands and from Peru using microsatellite markers (Shaw et al., Reference Shaw, Adcock, Burnett, Carvalho and Arkhipkin2004). These results suggest the existence of genetic support of the morphological differences reported among squids from Peru, Chile and the Falkland Islands (Vega et al., Reference Vega, Rocha, Guerra and Osorio2002). In the HCS, no genetic studies have been performed despite the existence of some evidence of two population units. On the one hand, landing statistics along the HCS indicate the presence of two principal landing zones of D. gahi, one in south-central Chile (34°S to 42°S) and the other in Peru (3°S to 12°S). The absence of landing between 20°S and 34°S suggests the existence of low abundance of this species in northern Chile. It is likely that D. gahi does not have a continuous distribution along the west coast of southern South America. On the other hand, morphological studies demonstrated the existence of differences between the regions of major abundance (Peru and Chile) explained by environmental differences in water masses and possible genetic origin (Vega et al., Reference Vega, Rocha, Guerra and Osorio2002).
The objective of this study was to analyse the existence of two population units of D. gahi in the HCS using population genetic analysis and demographic inference of mtDNA sequences.
MATERIALS AND METHODS
Sampling
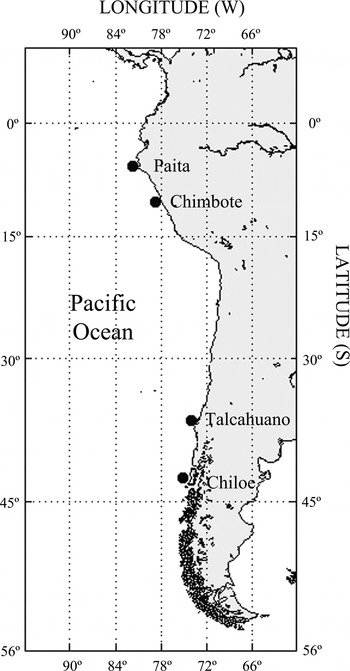
Tissue samples of 116 Patagonian squid were collected from two locations of Peru and two locations of Chile during 2007 and 2008 (Table 1; Figure 1). Tissue was taken from the mantle and preserved in ethanol (95%). Samples from Peru were taken from artisanal fisheries dedicated to loliginid squids and the Chilean samples were obtained from research cruises of IFOP (Instituto de Fomento Pesquero) and from the by-catch of artisanal fishery of small pelagic fish.
Map showing sampling locations of Doryteuthis gahi in the Humboldt Current System.

Sample size, and genetic diversity indices of Doryteuthis gahi from the Humboldt Current System.

N, sample size; S, polymorphic sites; K, haplotype number; Hd, haplotype diversity; π, nucleotide diversity; ∏, pairwise differences between sequences.
DNA extraction and amplification
Total DNA was extracted following the saline extraction protocol (Aljanabi & Martinez, Reference Aljanabi and Martinez1997). We used the universal primers designed by Folmer et al. (Reference Folmer, Black, Hoeh, Lutz and Vrijenhoek1994) to amplify the mitochondrial cytocrome oxidase I gene (COI). Polymerase chain reaction (PCR) amplifications were carried out using for each sample: 0.3 µl of Taq DNA polymerase (1.5 units) and 2.5 µl 10× (50 mM KCl, 10 mM Tris–HCl, pH 8.0) commercially supplied buffer, with 2 µl dNTPs (10 µM), 1.0 µl 50 mM MgCl2, and 0.5 µl (10 pg/μl) of each primer (LCO1490 and HCO2198). After an initial denaturation (3 minutes at 94°C), the reaction mixtures were subjected to 35 cycles of 94°C (40 seconds), and 48°C (40 seconds) and 72°C (60 seconds) followed by a final extension at 72°C (7 minutes) using a thermal cycler. PCR products were purified with the Wizard™ Prep system (Promega) following the manufacturer's protocols. Purified PCR products were automatically sequenced (Macrogen Inc, Korea). 683-bp long COI sequences were edited and aligned by eye using ProSeq version 2.9 (Filatov, Reference Filatov2002).
Population genetic analyses
Standard diversity indices such as the number of haplotypes (K), number of polymorphic sites (S), haplotype diversity (Hd), mean number of pairwise differences (∏), as well as nucleotide diversity (π) were estimated for each location using Arlequin version 3.11 (Excoffier et al., Reference Excoffier, Laval and Schneider2005).
To test for population structure, we calculated pairwise FST among sampling locations. The significance of pairwise FST was based on 10,000 permutations as implemented in Arlequin software version 3.11 (Excoffier et al., Reference Excoffier, Laval and Schneider2005). Additionally, we performed exact tests in Arlequin to detect differences among haplotype frequencies between samples. This test is an extension of the Fisher's exact probability test for contingency tables (Slatkin, Reference Slatkin1994). Instead of enumerating all possible contingency tables, a Markov chain is used to explore efficiently the space of all possible tables, with a length of 50,000 steps. Additionally, to detect major genetic breaks among samples, we performed a Spatial Analysis of MOlecular VAriance (SAMOVA; Dupanloup et al., Reference Dupanloup, Schneider and Excoffier2002) using SAMOVA software version 1.01. The SAMOVA tests all possible ways to establish groups of populations that maximize the ‘among-groups’ component of the total genetic variance and reduce the ‘among populations within groups’ component. The significance of FST, FSC and FCT fixation index values was computed by a non-parametric permutation procedure with 10,000 iterations.
Demographic analyses
We calculated Fu's Fs and Tajima's D indices as well as their corresponding P values in Arlequin software to detect departures from Wright–Fisher mutation-drift equilibrium caused by population expansions or bottlenecks under neutrality hypotheses (Tajima, Reference Tajima1989; Fu, Reference Fu1995).
The demographic history of Doryteuthis gahi from the HCS was also inferred from Bayesian skyline analyses implemented in BEAST version 1.5.4 (Drummond & Rambaut, Reference Drummond and Rambaut2007). The Bayesian skyline utilizes Markov chain Monte Carlo (MCMC) sampling of sequence data to estimate a posterior distribution of effective population size (Ne) through time and their highest posterior density intervals (95% HPD) (Drummond et al., Reference Drummond, Rambaut, Shapiro and Pybus2005). Bayesian skyline analyses were run using the Hasegawa–Kishino–Yano substitution model (HKY), which was identified as the best fitting model by Bayesian decision criteria implemented in jModelTest (Posada, Reference Posada2008) (–lnL = 1087.02, BIC = 4379.85). To test the best model of molecular clock evolution (strict or relaxed) of D. gahi populations, we compared with Bayes factors (Suchard et al., Reference Suchard, Weiss and Sinsheimer2001). The relaxed molecular clock with uncorrelated exponential distribution was the model which fitted the data decisively best (log10 Bayes factor = 5.217). In this set of runs, the mean mutation rate was set with a prior normal distribution (0.02 × 10⁻⁶ ± 0.01 × 10⁻⁶ SD). The number of grouped intervals (m) was set to 10 and the Bayesian skyline was performed in the stepwise-constant model. We ran two chains of 50,000,000 iterations of the MCMC, sampling every 1000 generations, while the first five million chains were discarded as burn in. The independent log files and tree files were combined using LogCombiner version 1.5.3 (Rambaut & Drummond, Reference Rambaut and Drummond2009a), obtaining a chain of 90,000,000 steps. The Bayesian skyline plots were generated with the program Tracer version 1.5 (Rambaut & Drummond, Reference Rambaut and Drummond2009b).
RESULTS
Population genetic analysis
A total of 15 haplotypes were found among the 116 individuals examined from four localities. Haplotype diversity (Hd) ranged from 0.343 in Chimbote to 0.809 in Talcahuano (Table 1), and nucleotide diversity (π) varied from 0.00054 in Chimbote to 0.00244 in Talcahuano (Table 1). The pooled regional genetic variability for Peruvian localities was very low (Hd = 0.423, π = 0.00079) compared to Chilean locations (Hd = 0.779, π = 0.00227).
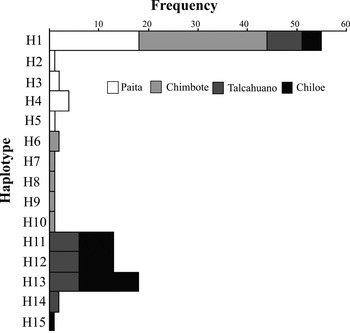
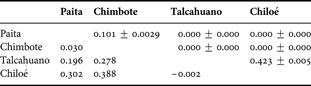
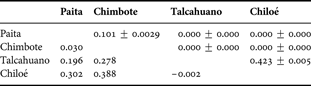
Exact tests showed highly significant differences (P < 0.001) in haplotype frequency among locations and highly significant values of FST (Table 2; Figure 2). However, SAMOVA analysis did not detect any significant geographical structure, probably due to the small number of sample locations. The genetic variance explained by among groups component was maximized (25.12%) when samples were pooled as Chilean and Peruvian groups. Among populations within groups was low (0.76%) and most of genetic variance was explained by the ‘within population’ component (74.12%). This result is a consequence of the shared haplotype (H1) between localities of Chile and Peru and the absence of clear phylogeographical structure (Figure 2). Based on these results, we will consider Chilean and Peruvian populations for further analysis.
Haplotype frequencies from each sampling location of Doryteuthis gahi in the Humboldt Current System.

Population structuring of Patagonian squids from the Humboldt Current System. FST values (below) and P values (above).
Demographic analysis
Both Fu's Fs (Fs = –8.22, P < 0.01) and Tajima's D (D = –2.19, P < 0.01) were negative and significant in the Peruvian population, but not in the Chilean population (D = 0.06, P = 0.61; Fs = 0.46, P = 0.20).
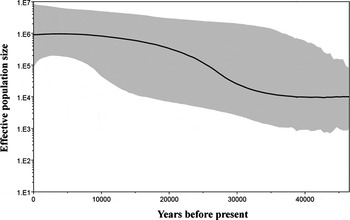
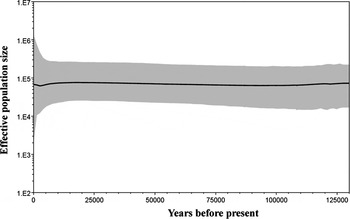
Bayesian skyline analyses of the Peruvian population indicated that population growth initiated approximately 30,000 years ago in the northern HCS and the mean time of the most recent common ancestor (MRCA) was estimated at 39,057 years (HPD 95% 31,256–46,876 years). The effective population size increased from 50,000 to 1,000,000 individuals in the last 30,000 years (HPD 95% 60,000–4,700,000 individuals) (Figure 3). The Chilean population showed a constant population size through time in the southern HCS with a mean population size of 100,000 individuals (HPD 95% 69,350–724,020 individuals) (Figure 4). The mean time of MRCA was estimated at 98,992 years (HPD 95% 79,872–118,840 years).
Bayesian skyline plot of the Peruvian population of Doryteuthis gahi in the Humboldt Current System. Population size on the y-axis is given on a logarithmic scale. The thick solid line represents the mean estimate of population size; the grey area shows the 95% highest posterior density intervals.

Bayesian skyline plot of Chilean population of Doryteuthis gahi in the Humboldt Current System. Population size on the y-axis is given on a logarithmic scale. The thick solid line represents the mean estimate of population size; the grey area shows the 95% highest posterior density intervals.

DISCUSSION
Population genetics
In this study we found that Doryteuthis gahi exhibits genetic structure along the HCS, although there was only moderate differentiation between Chilean and Peruvian populations. This genetic structure in the HCS is consistent with the life history of this species, especially with their benthic spawning, indicating that this species has genetically heterogeneous populations. Passive migrations of paralarvae and benthic egg masses may contribute to moderate gene flow and a low potential dispersal along its distribution-range. Recently, microsatellite genetic analysis of samples collected from the Falkland Islands and Peru (Shaw et al., Reference Shaw, Adcock, Burnett, Carvalho and Arkhipkin2004) and morphological analyses from Peru, Chile and the Falkland Islands (Vega et al., Reference Vega, Rocha, Guerra and Osorio2002) suggested the existence of two populations generated by environmental and geographical barriers. Unfortunately we only obtained three squid from northern Chile (Iquique 20°S 70°W) because this species was not abundant during the study period, thus we could not determine the mechanism of differentiation (e.g. isolation by distance). These three sequences were the most frequent and shared haplotype (H1) (not shown), indicating that it is likely that the squid from northern Chile and Peru correspond to a single genetic unit. Vega et al. (Reference Vega, Rocha, Guerra and Osorio2002) mentioned that the migrations of juveniles and adults between Peru, Chile and the Falkland Islands are unlikely due to different water masses in each location. This idea suggests that some local adaptation occurs; in Peru and northern Chile these squid spawn on sandy bottoms and recruitment occurs all year (Villegas, Reference Villegas2001) while in southern Chile and the Falkland Islands they spawn in seaweeds and/or soft corals and recruitment occurs principally in spring and autumn (Hatfield, Reference Hatfield1996; Arkhipkin et al., Reference Arkhipkin, Laptikhovsky and Middleton2000; Laptikhovsky, Reference Laptikhovsky2008). These latitudinal differences in life history traits are similar to those of other loliginid squid in the north-eastern Pacific and north-western Atlantic Oceans (see Reichow & Smith, Reference Reichow and Smith2001; Buresch et al., Reference Buresch, Gerlach and Hanlon2006).
The horizontal migration of adults of loliginid squid does not seem to be very common; paralarvae and juveniles may have a limited dispersal compared to oceanic squid (Boyle & Rodhouse, Reference Boyle and Radhouse2005). Studies in Iberian Peninsula waters have shown that the upwelling areas represent favourable habitats for cephalopod paralarvae and changes in the intensity of upwelling may have an impact on the recruitment, abundance and retention of these early stages (Rocha et al., Reference Rocha, Guerra, Prego and Piatkowski1999; González et al., Reference González, Otero, Guerra, Prego, Rocha and Dale2005; Moreno et al., Reference Moreno, Dos Santos, Piatkowski, Santos and Cabral2009). The great swimming ability of loliginid paralarvae (Bartol et al., Reference Bartol, Krueger, Thompson and Stewart2008) can make the retention process stronger in bays and other protected areas, diminishing the effects of offshore advection in the surface Ekman layer and consequently decreasing the gene flow among the upwelling areas in the HCS.
Many molecular phylogeographical studies have found groups which correspond to biogeographical provinces as identified from traditional faunal lists (Avise, Reference Avise2000). Along the Chilean coast, many studies have recognized three biogeographical provinces with breaks around 30°S and 42°S (Brattström & Johanssen, Reference Brattström and Johanssen1983; Lancellotti & Vásquez, Reference Lancellotti and Vásquez1999; Camus, Reference Camus2001; Ibáñez et al., Reference Ibáñez, Camus and Rocha2009). These provinces exhibit different biotas and the breaks are explained by contemporary and historical processes (Camus, Reference Camus2001). In the case of cephalopods, the existence of marked biogeographical breaks at 30°S and 42°S affecting their distribution suggests that external forces and physical factors rather than temperature gradients restrict their dispersion and migration (Ibáñez et al., Reference Ibáñez, Camus and Rocha2009). In addition, Chilean waters are characterized by the presence of several upwelling zones that are not connected (Thiel et al., Reference Thiel, Macaya, Acuña, Arntz, Bastias, Brokordt, Camus, Castilla, Castro, Cortés, Dumont, Escribano, Fernández, Lancelloti, Gajardo, Gaymer, Gomez, González, González, Haye, Illanes, Iriarte, Luna-Jorquera, Luxoro, Manríquez, Marín, Muñoz, Navarrete, Pérez, Poulin, Sellanes, Sepúlveda, Stotz, Tala, Thomas, Vargas, Vásquez and Vega2007) and could represent a discontinuous habitat for this neritic squid species. In fact, it has been proposed for loliginid squid that the patterns of connectivity among populations may be limited by the discharge of large rivers or abrupt changes in the depth of the continental shelf, which operate as barriers to gene flow (Brierley et al., Reference Brierley, Thorpe, Pierce, Clarke and Boyle1995; Shaw et al., Reference Shaw, Pierce and Boyle1999; Herke & Foltz, Reference Herke and Foltz2002; Semmens et al., Reference Semmens, Pecl, Gillanders, Waluda, Shea, Jouffre, Ichii, Zumholz, Katugin, Leporati and Shaw2007; Aoki et al., Reference Aoki, Imai, Naruse and Ikeda2008).
Demographic history
We found strong geographical differences in the demographic history of D. gahi in HCS. Based on the time of MRCA we propose the hypothesis that the Peruvian population is a result of a founder event from the Chilean population. The expansion of this population occurred from 40,000 to 25,000 years ago, leading to a constant effective population size of around 1 million of individuals up to the present. Conversely, the Chilean population has always been constant in size (100,000 individuals) for the last 120,000 years. Recent fluctuations in abundance on an annual or decadal scale related to decadal oscillations or ENSO events would not leave an imprint on mtDNA diversity, because the strong signal of population expansion and constant population size was detected at a millennium scale. Palaeoceanographic reconstructions of productivity show latitudinal differences in the HCS. In Peru in the last glacial period high values were found with a significant reduction in the last deglacial and Holocene periods, in contrast to an increase in productivity in central and southern Chile in these periods (Montecino & Lange, Reference Montecino and Lange2009). This pattern is related to geographical variations in the effective population size of D. gahi, suggesting different population responses to climate change during the last 100,000 years.
From the ecological point of view, D. gahi populations are modified for spawning and embryonic development in cold waters (Arkhipkin et al., Reference Arkhipkin, Laptikhovsky and Middleton2000; Cinti et al., Reference Cinti, Barón and Rivas2004). This is the reason why the geographical distribution of this species in the Pacific and Atlantic Oceans can reach to the limit of the cold currents (Campos et al., Reference Campos, Miller, Müller and Peterson1995; Thiel et al., Reference Thiel, Macaya, Acuña, Arntz, Bastias, Brokordt, Camus, Castilla, Castro, Cortés, Dumont, Escribano, Fernández, Lancelloti, Gajardo, Gaymer, Gomez, González, González, Haye, Illanes, Iriarte, Luna-Jorquera, Luxoro, Manríquez, Marín, Muñoz, Navarrete, Pérez, Poulin, Sellanes, Sepúlveda, Stotz, Tala, Thomas, Vargas, Vásquez and Vega2007). These antecedents support the scenario of southern South America as the more ancestral area of distribution and the Peruvian population as a recent invasion by a founder event in the Pleistocene.
Effective population size and genetic diversity were very different in Peruvian and Chilean populations. In the case of squids from Peru low diversity and high Ne are consistent with the population expansion, while the high diversity and low Ne in Chile are more difficult to explain. For various populations of coastal fish with high genetic diversity an extinction and re-colonization process is known to be related to climate changes in the Pleistocene (Lecomte et al., Reference Lecomte, Grant, Dodson, Rodríguez-Sánchez and Bowen2004; Dawson et al., Reference Dawson, Waples, Bernardi, Allen, Pondella and Horn2006; Larmuseau et al., Reference Larmuseau, Van Houdt, Guelinckx, Hellemans and Volckaert2009). Another explanation suggested that fish populations with high diversity may be attributed to large stable populations with long evolutionary history or secondary contact between lineages (Grant & Bowen, Reference Grant and Bowen1998). The Chilean population of D. gahi is compatible with both ideas; we suggest that the current genetic patterns are consequences of northward migrations in the glaciation periods and posterior re-colonization of southern Chile in the deglacial period. In this hypothesis the squids could maintain a metapopulation-like structure in the Pacific Ocean with different rates of extinction, migration and colonization between locations.
ACKNOWLEDGEMENTS
We thank A. Díaz, M. Espinoza, C. González and M.C. Pardo-Gandarillas for their help with laboratory analysis. We thank F. Keyl, D. Véliz and L. Eaton for their comments on the manuscript. This work was funded by CONICYT AT24080021, ICM P05-002, PFB-23 and ‘Becas de estadías cortas de investigación destinadas a estudiantes tesistas de doctorado y magister de la Universidad de Chile’. C.M. Ibáñez was supported by a CONICYT doctoral fellowship.