I. INTRODUCTION
There are two themes that embody datasets from newly developed X-ray instrumentation such as state-of-the-art micro-computed tomography (μ-CT) instruments and X-ray diffraction (XRD) instruments that employ area-detector technology. The first theme is that file sizes are becoming massive and un-wielding. For example, it is not uncommon for μ-CT datasets to approach 100 GB in size. The second theme is that these datasets are multidimensional in nature. In the case of μ-CT data our typical coordinate system employs standard three-dimensional (3D) Cartesian coordinates (x, y, z) but may also include a time dimension (e.g. a test part is mechanically pulled in situ). In the case of XRD, datasets employed for texture analysis such as pole figures can be thought as two-dimensional (2D) datasets with dimensions χ and ϕ for each measured pole figure projection (Wenk and Van Houtte, Reference Wenk and Van Houtte2004). But an additional dimension which is often ignored in texture measurements, the 2θ dimension, serves to enable a more expanded analysis of not only the orientation distribution of crystalline phases, but also embedded residual strain that is manifest by a 2θ peak shift as a function of χ (or ψ) angle variation (Rodriguez et al., Reference Rodriguez, Pearl, Van Benthem, Griego and Pillars2013). Improvement in 3D visualization of these massive datasets is being driven by the need for a more intuitive analysis environment that overcomes the challenges of such un-wielding data. It is our goal to not only free the user from the constraints of the 2D viewing of truly 3D data, but to enable the much faster diagnosis of such data via the human cognitive abilities innate to perceiving and understanding our multidimensional environment. This is accomplished by projecting 3D data into virtual reality (VR) and enabling translation and interaction within this VR environment in a seamless fashion via an Xbox gaming controller. To showcase this new diagnostic methodology, we present examples of both μ-CT and 3D XRD data ported to a VR environment. These two examples demonstrate the use of VR for materials science applications involving non-destructive X-ray analysis.
II. EXPERIMENTAL
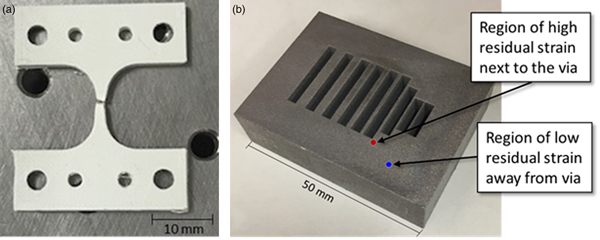
The μ-CT datasets were collected on a Zeiss/Xradia 520 Versa X-ray microscope configured with an in situ strain stage. The dogbone part was fabricated on a 3D-printer using polyphenylene sulfide (PPS). Figure 1(a) shows an image of the dogbone part after failure. 3D μ-CT datasets were collected in the center region of the part (~2 mm across at thinnest point) at various magnitudes of applied strain (elongation).
(Colour online) (a) 3D-printed PPS test part after μ-CT experiment and (b) 3D-printed aluminum test block constructed with feed-through vias (see text for details).

XRD texture data were collected on a 3D-printed aluminum test block. Figure 1(b) shows an image of the aluminum block. This rectangular test block was fabricated with different sized rectangular feedthrough vias that traversed the part from front to back. The design of these vias was purposeful to evaluate whether sharp corners and thin metal build locations in this 3D-printed aluminum block were prone to fabrication challenges as well as the presence of residual stress when the additive manufacturing (AM) build process was complete. Figure 1(b) shows where the two XRD measurements were performed. The first location of the XRD analysis labeled “…next to the via” in Figure 1(b) is near the corner of one of the vias. This location displayed considerable residual strain upon XRD analysis. For comparison purposes, the second location, labeled “…away from the via” is considered representative of a bulk measurement of the 3D-printed aluminum block. This location did not reveal significant residual stress. XRD texture datasets were collected using a Bruker D8 micro-diffraction system (Cu K α radiation) equipped with a texture cradle and Vantec 2000 area detector. A mirror optic was employed to condition the incident beam for K β radiation removal and a pin-hole collimator was employed to generate a spot size of ~500 µm at the sample. Data collection was performed using Tilt-A-Whirl protocols as outlined elsewhere (Rodriguez et al., Reference Rodriguez, Pearl, Van Benthem, Griego and Pillars2013). Collection times for each dataset were ~20 h. Note that 3D-printed PPS is not comparable with a conventionally extruded polymer. Likewise, 3D-printed aluminum is not comparable with conventional cast aluminum parts.
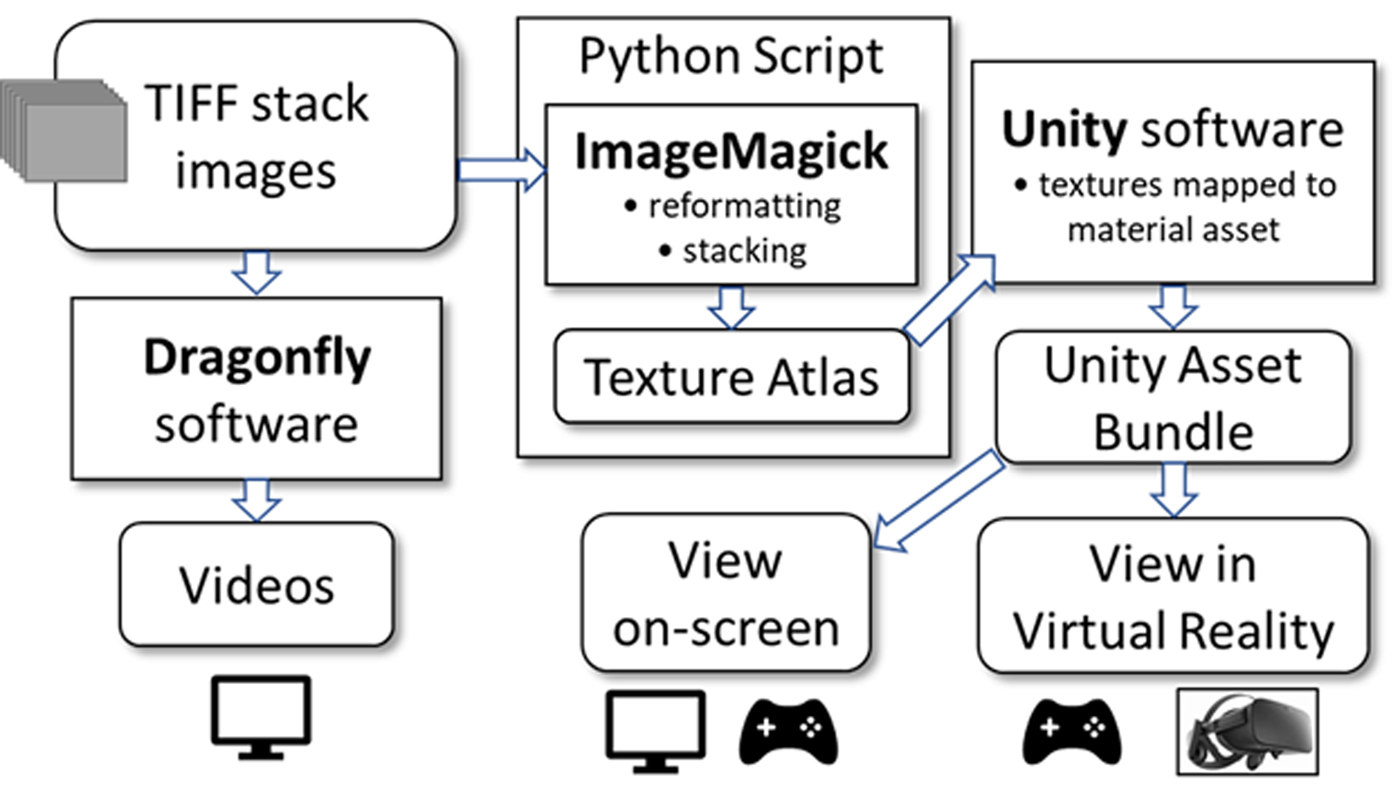
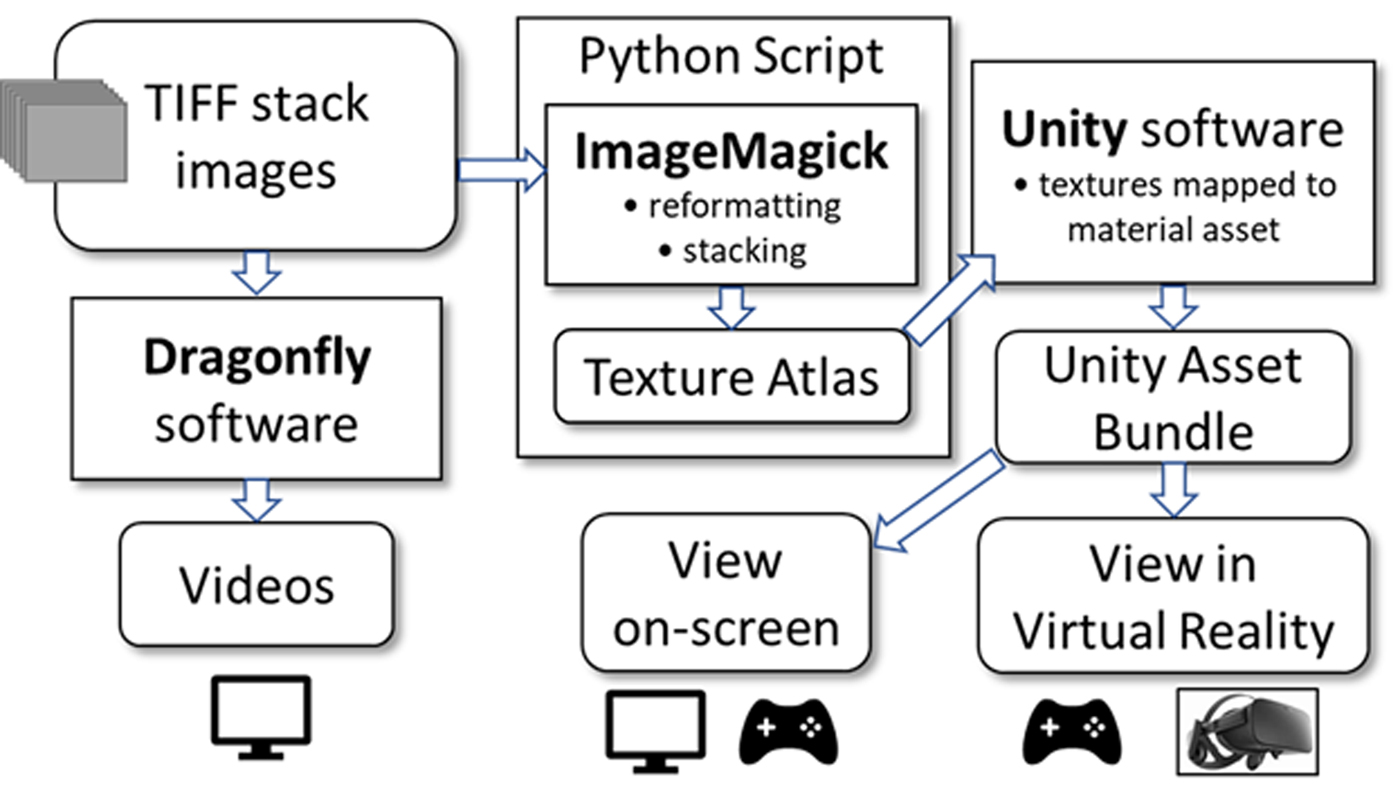
Data were configured and analyzed according to the flowchart shown in Figure 2. This figure illustrates how the initial data were configured to be viewed either on-screen (i.e. a computer monitor), or in VR using the headset. The initial format of the data begins as a set of TIFF images commonly referred to as a “TIFF-stack.” For the PPS dogbone part, TIFF-stacks were generated directly from the μ-CT system output. In the case of XRD analysis, the (χ, ϕ, 2θ) dataset often informally referred to as “spaghetti data” (Rodriguez et al., Reference Rodriguez, Pearl, Van Benthem, Griego and Pillars2013), was initially evaluated within our in-house Matlab software. From there, the spaghetti data were output as TIFF-stack images and ported for rendering using the flowchart protocols shown in Figure 2. The flowchart shows that the TIFF-stacks can either be read and viewed within the vendor supported 3D-viewing software Dragonfly 3.1 (Dragonfly, 2017) or reformatted using the program ImageMagick (ImageMagick, 2018) for import into the Unity game engine platform (Unity, 2018). Once the datasets are formatted as a Unity asset bundle, they can either be viewed on-screen via a PC monitor or within VR through the Oculus Rift headset (Oculus, 2016). Both viewing methods have support for the Xbox game controller (Xbox, 2018) and allow for on-the-fly translation and data manipulation when viewing.
Flowchart for porting TIFF-stack images to various 3D output viewing options.
III. RESULTS AND DISCUSSION
A. μ-CT of PPS dogbone
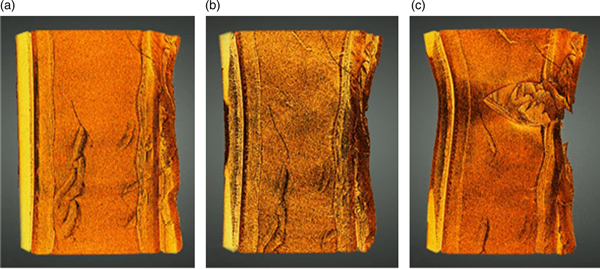
Progression of the PPS dogbone part toward failure is shown in Figure 3. These images were generated within Dragonfly software and viewed on-screen. While not illustrated here in these 2D images, the results can be viewed as complete 3D tomography datasets with the option to move in and out of the data and view it from any vantage point. Each dataset was registered to the other so that comparison between sets was possible. Figure 3(a) shows a portion of the dogbone in the central region of the part prior to any elongation (i.e. unstrained). Some surface irregularities are visible because of the 3D-printing process, but no obvious large cracks are observed. Figure 3(b) shows how the part changed after it was subjected to a tensile pull from the top and bottom, resulting in 739 µm of elongation of the part under load. In this center image (Figure 3(b)) there is a perceptible necking behavior across the width of the part when compared with the unstrained image (Figure 3(a)), but no obvious cracking. Figure 3(c) shows the dogbone part after further tensile load resulting in 900 µm of elongation. This figure clearly shows that a crack has formed that traverses from right-to-left and encompasses more than half the width of the part. If one looks carefully, one can see inside this crack region the indications of layered sheets oriented in the plane of the figure that have torn or ripped during failure. These layers are a result of the build process during 3D-printing and illustrate how the failure of the part is related to the morphology of the polymer material created during the 3D-printing process.
(Colour online) Progression to failure for PPS dogbone part captured via μ-CT: (a) unstrained, (b) 739 µm elongation, and (c) 900 µm elongation. The width of the dogbone in the unstrained state (a) was ~2 mm.

Further contextual detail of the failure was obtained when these individual 3D datasets were stitched together in Dragonfly software to form a sequential movie regarding the gradual expansion of the dogbone in this region of failure. However, the downside of this video viewing technique is that the movie could only view the data from one vantage point at a time. Once a view was selected, it remained fixed during the progression of the data through the strain conditions so as to compare one dataset with the next strain condition, in context. Generation of fly-through videos is a useful means of presenting data once these desired viewing orientations have been determined. The selection of these orientations and viewing perspectives usually comes after considerable analysis of the 3D datasets individually. However, once these viewing orientations are set and locked during video generation, only the selected perspectives can be viewed again. If one desires to see a different viewing perspective, one must return to the original 3D data to generate a new movie. This inevitably leads to the difficult circumstance where such a movie is shown as a demonstration, but the customer or sponsor may inquire if they can view these same data from a different perspective (e.g. the back side of object). In such a case, a new movie would need to be generated to see this additional perspective, and the customer would need to wait for the updated movie to be generated. This process invariably slows the pace of iterative testing and evaluation commonly demanded by scientific inquiry.
The benefit of VR is that one can place the viewer within the immersive environment where all viewing perspectives are available. This is what we have accomplished using the dogbone series of μ-CT data. Asset bundles representing the different TIFF-stack images of the strain sequence were ported to the Unity game engine where the strain series could be toggled through sequentially (by using a button on the controller). The viewer could remain in one vantage point within the 3D data and toggle forward or backward between different strain conditions to observe how the fracture developed. In addition, at any given state of strain, the 3D dataset could be toured with the Xbox controls to another vantage point and begin the toggle process again to watch the crack develop from this new viewing location. The controls have been augmented with a means of filtering, which allows for removal of background level and low-density regions of the absorption contrast μ-CT data. These adjustments can be made on-the-fly while within the VR world using the trigger buttons on the controller to reveal low-density vs. high-density regions of the part. Additionally, measurement tools have been added to allow distance determination between features in the data, all from the Xbox controller. Note, with our current datasets (e.g. one thousand slices each 1k × 1k, 16-bit gray scale) on-screen rendering requires a computer equipped with a GPU, i.e. integrated graphics are not sufficient. To use a VR headset, a gaming class GPU is required. As image sizes increase, more GPU memory and bandwidth are needed.
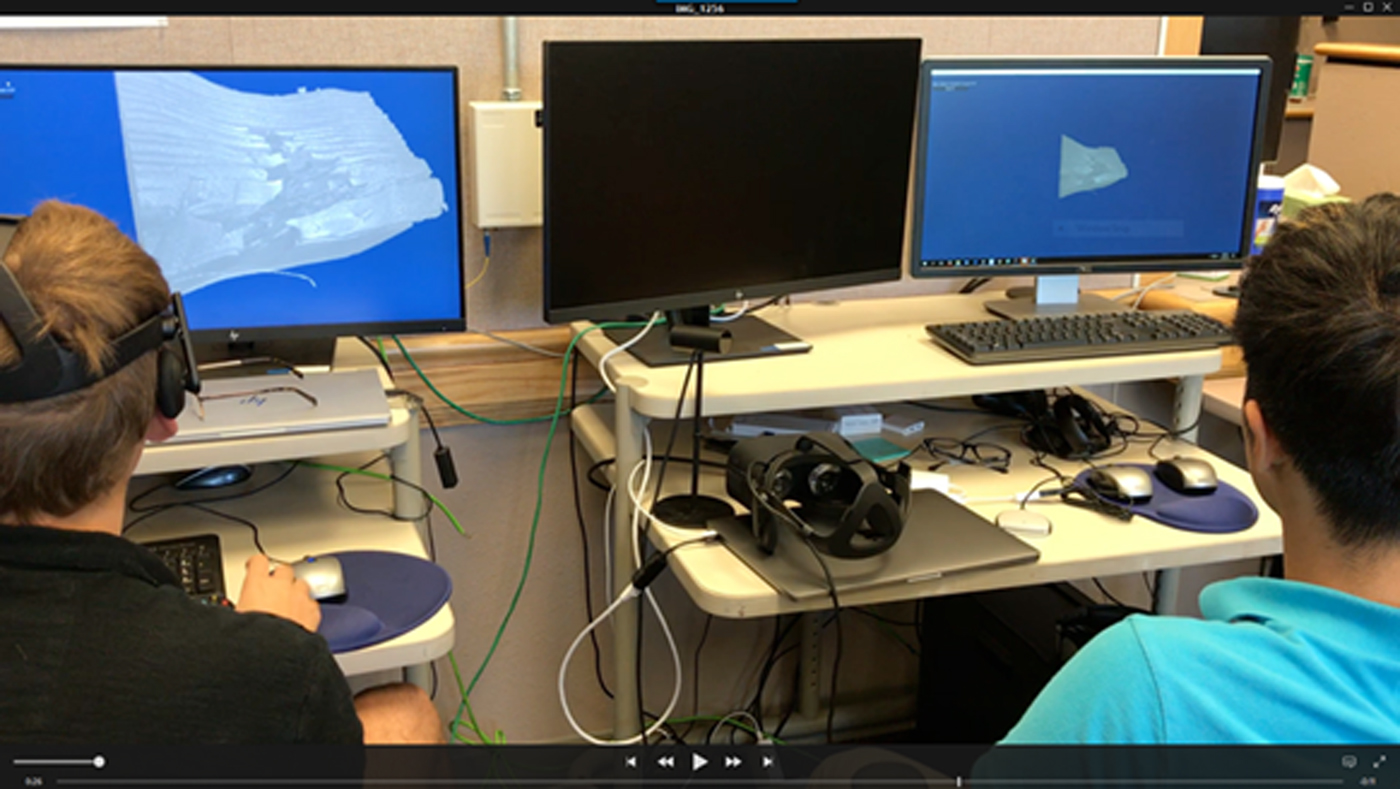
Taking this VR experience one step further, we have allowed for a shared VR experience by linking multiple PCs across the internet to the same immersive VR environment. In this way, a leader along with many guest viewers can simultaneously view the same 3D data, tour via their individual controllers, and jointly discuss details observed in the 3D results. Viewers can choose to watch either on-screen or within VR using a headset. Figure 4 illustrates this type of shared experience where two viewers are evaluating the same data, linked via the internet. The viewer on the left is viewing the dogbone dataset via his VR headset, but also has the data projected on his monitor. The viewer on the right has chosen to view the same data on-screen without the VR headset. Both can employ the use of their Xbox controller to tour the data. This tour can be performed either in tandem or independently. The tandem tour enables the leader to have control of the locations toured by all other guests. In such a case, guest viewers will still have the capability to reorient their own view in any direction (e.g. up/down or behind) but will be tied to the leader's location. This is analogous to a bus tour where the driver controls location, but the sight-seers are free to look around independently. Therefore, we often refer to the tandem tour as being “on the bus.” If a guest viewer so chooses, they can decouple from the leader and move and view with autonomy using their own controller. This independent viewing of the 3D data we refer to as “off the bus.” The ability to simultaneously evaluate 3D data in an immersive environment across a network has vast implications for collaborative discussions regarding 3D data. The ability for viewers at different sites (e.g. Texas and Michigan) to collectively participate and discuss results will empower researchers to gain a more thorough understanding of 3D data which has so often proven difficult to present by other means. The collaborative environment also allows for participants to interact with the data in real-time, thereby allowing all viewers the ability to perform iterative hypothesis-testing of results and draw their own conclusions based on their independent evaluations. This ability to collaboratively evaluate in an immersive environment promises to improve productivity by reducing analysis times required for evaluation of these massive datasets. Note that for collaborative viewing, both parties have a local copy of the dataset on their PC. Network bandwidth is thus not a constraint because the information shared across the network is quite small; i.e. display settings and all participants’ location and orientation information.
(Colour online) Collaborative viewing of 3D data across a network. The viewer on the left has PPS dogbone 3D data on-screen and is also viewing it via his Oculus Rift headset. The viewer on the right simultaneously evaluates the same 3D dataset via the internet connection.

B. Macrostrain via 3D pole figure evaluation
Conventional evaluation of texture and macrostrain in materials using XRD is most often performed by independent measurements (Cullity, Reference Cullity1978). In the case of texture, pole figures are typically obtained via a texture cradle attachment where the sample is tilted along a χ axis and rotated about a spindle axis (ϕ) to generate a near-complete hemisphere of sample orientations (see Wenk and Van Houtte, Reference Wenk and Van Houtte2004). The diffracted intensity of a given (hkl) is measured and mapped onto this hemisphere and this map is then reduced to a 2D projection which becomes the pole figure plot. This pole figure measurement is typically performed at a fixed 2θ position. Since pole figures are a projection onto a 2D polar map, they do not have a 2θ width. In contrast, for the measurement of residual strain the 2θ dimension is essential because residual stress in a part manifests itself via XRD as a strain which alters the interplanar spacing of a given (hkl). For the simple case of bi-axial strain, the out-of-plane strain state at the sample surface will have very little impact on the interplanar spacing of a given (hkl). Therefore, to first-order, the interplanar spacings aligned parallel to the surface can be considered to be under an unstrained condition (Cullity, Reference Cullity1978). However, if one tilts the sample via the χ angle (a.k.a. the ψ angle), the measured interplanar spacing will expand or contract, depending on the magnitude of the strain field. This is the basis for the sin2(ψ) technique (Noyan, Huang and York, Reference Noyan, Huang and York1995; Ferreira et al., Reference Ferreira, Abramof, Leite, Corat and Trava-Airoldi2002). Typically, this method is performed at a fixed ϕ angle where χ (or ψ) is varied and 2θ scans are collected for a given (hkl). In some cases, two measurements are performed at different fixed (ϕ) locations to gain greater detail of the residual stain field in-plane (Cullity, Reference Cullity1978).
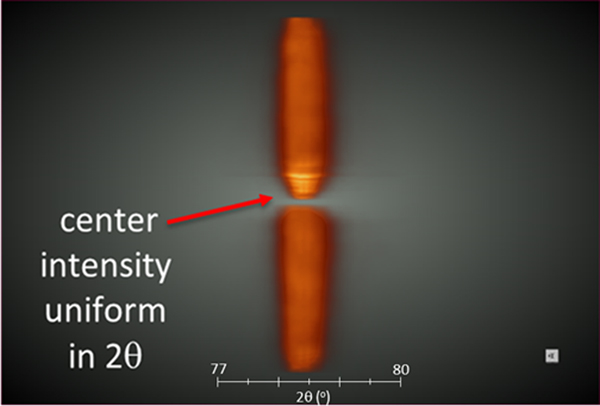
As one might possibly envision, a dataset that provides both texture and strain data can be generated by simply adding the 2θ axis to pole figure maps or performing the χ vs. 2θ scans at all ϕ rotations. Our Tilt-A-Whirl methodology allows for just such a measurement by obtaining spaghetti data with dimensions of (χ, ϕ, 2θ). These types of 3D data can be employed to see both texture aspects when viewed as a 2D projection (pole figure) and strain aspects when the same 3D data are viewed edge-on along the 2θ axis. For the case of an unstrained material, we can expect an intensity maximum through the center of the pole figure 2θ thickness and an approximately equally-weighted distribution of intensity on either side of this center maximum across this pole figure thickness. Figure 5 shows the cross-sectional view of a (311) pole figure collected on the aluminum block (Figure 1(b)) at the low residual strain location. This 3D image was generated within Dragonfly software from an image stack exported via our in-house Tilt-A-Whirl Matlab code (Rodriguez et al., Reference Rodriguez, Pearl, Van Benthem, Griego and Pillars2013). The 2θ axis in Figure 5 runs from left to right; the 2θ scale has been multiplied by a factor of 7× to expand the pole figure thickness in the 2θ dimension. The expansion aides in visualization of the intensity distribution. The pole figure has been sliced through the middle so that the intensity distribution can be seen in cross-section. Light color (yellow) is high X-ray intensity and darker color (orange) indicates lower X-ray intensity. As one can see from this figure, the high intensity (bright yellow) region is well-centered in the middle of the pole figure across its 2θ thickness, much like the center filling in a sandwich cookie. This means that the peak maximums for the (311) planes show little dependency with the χ angle. This is exactly what one would expect for the absence of residual strain.
(Colour online) Cross-sectional view of an aluminum (311) pole figure collected at the low residual strain location in the test part. The expected uniform intensity distribution is observed (see text for details). For reference, visualize you are looking edge-on at a coin where the face of the coin is perpendicular to your line of sight.

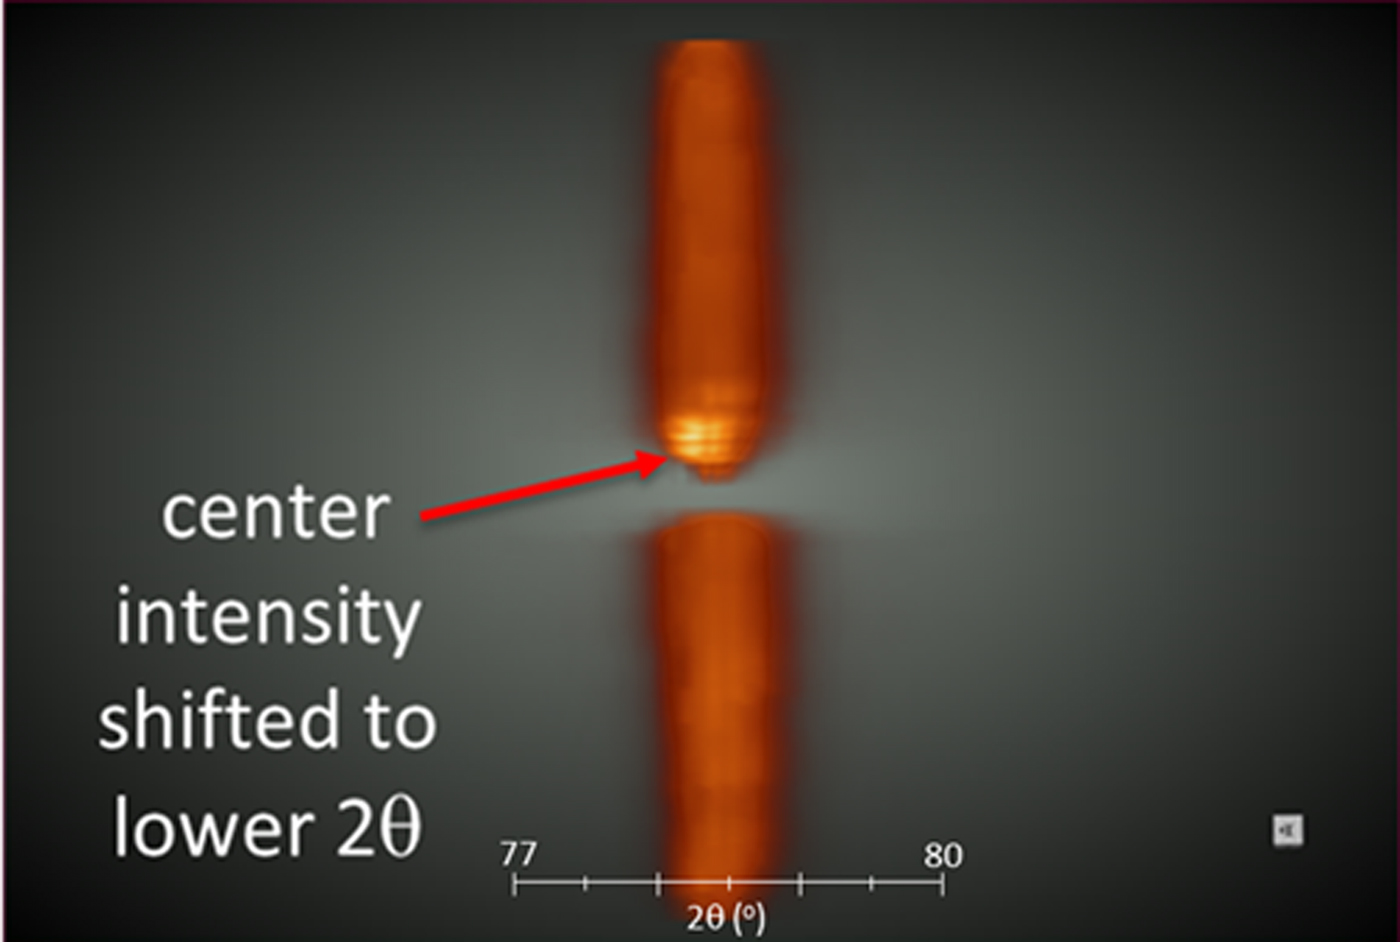
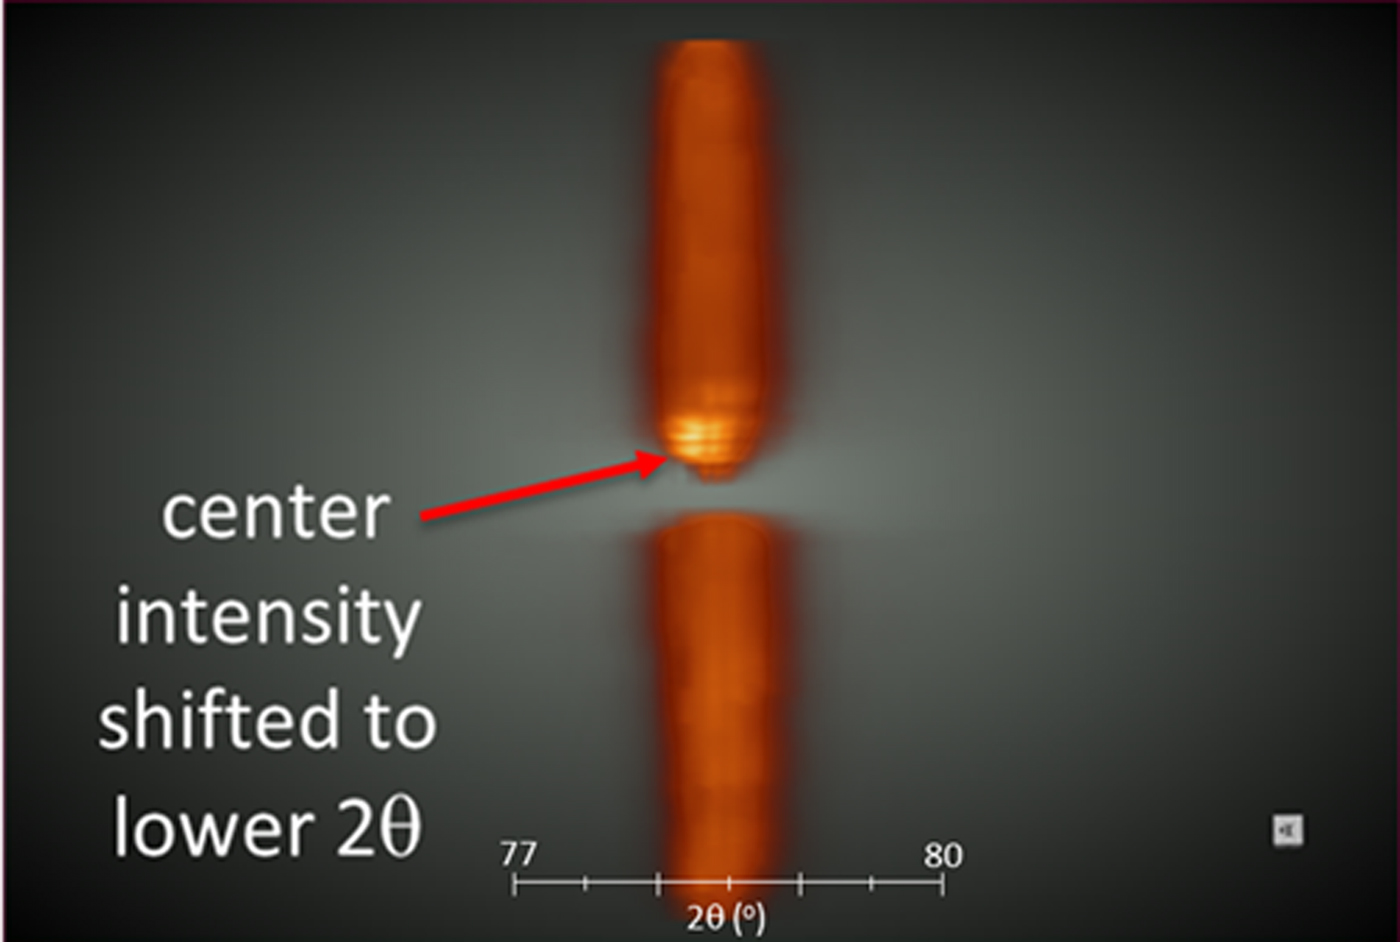
Figure 6 shows a similar pole figure for the aluminum (311) interplanar spacing collected at the high residual strain location near the via (see Figure 1(b)). The pole figure in Figure 6 is also oriented with the 2θ axis running left to right and the 2θ scale is again multiplied by the 7× factor to enhance visualization. Therefore, one can directly compare unstrained (Figure 5) and strained (Figure 6) data in context. Likewise, in Figure 6 the pole figure has been sliced down the center to expose the interior intensity distribution. In this case we can see a clear difference because of the impact of macrostrain on the intensity distribution. There is an obvious shifting of the maximum intensity (bright yellow) to the left side of the pole figure (lower 2θ angle) for the intensity at the center of the pole. This means that the peak maxima in the 2θ dimension have a χ angle dependence, indicative of an in-plane compressive strain. The strain can be quantified via the sin2(ψ) method to obtain a magnitude of in-plane residual strain using conventional methods. However, if one simply needs to qualitatively assess the presence or absence of macrostrain in a part and whether it is compressive or tensile in nature, this visual method of interrogation is intuitive and straightforward. A visual assessment requires very little work on the part of the observer other than observing a non-uniform intensity distribution in the pole figure cross-section.
(Colour online) Cross-sectional view of an aluminum (311) pole figure collected at the high residual strain location in the test part. Note the non-uniform intensity distribution is characteristic of the presence of a compressive residual strain (see text for details). For reference, visualize you are looking edge-on at a coin where the face of the coin is perpendicular to your line of sight.
As mentioned above, the images in Figures 5 and 6 were visualized on-screen using Dragonfly software. However, comparable TIFF-stack images of these data were also ported to the Unity game engine (according to the documented protocol shown in Figure 2) for viewing and comparing in VR. This ability to port into the VR environment made it very easy to toggle back and forth between the strained and unstrained conditions and see the significant change in the intensity distribution because of residual strain effects and view these data from many different orientations and perspectives. This functionality proved very powerful to quickly assess the presence of residual strain, its compressive or tensile nature, and communicate this information in a straightforward manner to the staff involved in the AM of the aluminum parts.
IV. CONCLUSIONS
Our recent developments in software and data processing have enabled an automated protocol for converting 2D TIFF-stack image data to VR-ready asset bundles. This development enables a very rapid means of viewing both μ-CT and 3D XRD datasets in a VR environment. In the case of μ-CT data, consecutive 3D datasets from a polymer test bar at various stages of in situ mechanical strain were viewed in VR in their sequential context. In the case of multidimensional XRD data, the presence or absence of a compressive in-plane residual strain was detected via shifts in intensity distribution through the 2θ thickness dimension of an aluminum (311) pole figure. These 3D (χ, ϕ, 2θ) pole figures were derived from measurements near and far from a via in 3D-printed aluminum test part. In all cases regarding VR viewing, embedded tools within the Unity VR environment were available at the touch of a button through the use of a standard Xbox controller. Such tools as orientation/position adjustment, contrast-level (density) adjustment, and distance measurement were just some of the features present to interact with the data on-the-fly in the VR environment. In addition, the capability of simultaneous host/guest viewing of 3D datasets in VR has been implemented via network connection between computer systems. This allows for a collaborative environment to jointly view, interrogate, and discuss 3D data in a VR context.
ACKNOWLEDGEMENTS
Sandia National Laboratories is a multi-mission laboratory managed and operated by National Technology and Engineering Solutions of Sandia, LLC, a wholly owned subsidiary of Honeywell International, Inc., for the U.S. Department of Energy's National Nuclear Security Administration under contract DE-NA0003525.