Over at least fifty years of research, ideology has been used to explain the political behaviour of voters, legislators and other political agents. Ideologies give structure to an individual's view on various issues. Intuitively, a political ideology specifies which issue positions go together, the ‘knowledge of what-goes-with-what’.Footnote 1 Ideologies do not necessarily imply a logically consistent political, economic or social world view. Indeed, as Converse argued, the association between issues may just be contingent and reflective of a particular, perhaps cultural or historical, experience.Footnote 2 Nevertheless, ideologies constrain. It is quite unlikely (though not impossible) that a randomly selected American voter who opposes universal health insurance, gun control, affirmative action, environmental regulation, abortion and higher taxes also supports gay marriage. Converse expresses this idea as follows: ‘Constraint may be taken to mean the success we would have in predicting, given an initial knowledge that an individual holds a special attitude, that he holds certain further ideas and attitudes.’Footnote 3 Measuring ideological orientations, however, has always been a difficult task. Unlike party affiliation, for example, ideology is not directly observable. Consequently, scholars have employed different strategies to measure ideological positions, ranging from survey responses to statistical estimates based on voting records. In legislative politics, and especially for the US Congress, the most widely used measure of ideology remains the vote-based score developed and refined by Poole and Rosenthal and later by McCarty, Poole and Rosenthal.Footnote 4 The authors estimate ideology in Congress by applying a spatial voting model to congressional roll-call data. Legislators’ ideal points are then estimated in choice spaces of various dimensions. Perhaps the most important finding of the Poole–Rosenthal approach is that much of the voting behaviour in Congress can be explained by a stable, low-dimensional issue space. Indeed, Poole and Rosenthal find that between 1789 and 1985, a two-dimensional spatial model (estimated with nominate scores) can correctly classify about 85 per cent of the individual voting decisions of each member of Congress.Footnote 5 Moreover, for most periods of American history, a single dimension is sufficient to explain nearly all of the variance in voting. For example, in recent years (104th–106th Congress) a single dimension can account for about 90 per cent of all roll-call choices by members of Congress.Footnote 6
Though by no means without controversy, the finding of low dimensionality has been recognized as an important characteristic of congressional decision making.Footnote 7 Yet, many questions remain. First, there is an extensive and ongoing debate on whether the voting patterns reflect a legislator's ideological position or whether the low-dimensionality is an artefact of legislative agenda control, the need to preserve party brands, or constituency concerns and the like.Footnote 8 Indeed, party cohesion, pressure by party whips and strategic voting have been shown significantly to alter the measurement of ideal points in Westminster-style parliamentary systems, and there is at least some evidence that this could also affect the scaling of legislative votes in the US Congress.Footnote 9
Secondly, putting aside these controversies, we would want to know the content of the estimated ideological positions. This is of particular importance from a comparative point of view: for example, to understand the differences between ‘conservatism’ in the American context and in other political systems.
Poole and Rosenthal and others have hypothesized that the first dimension represents a traditional left–right conflict associated with the government's role in the economy and economic redistribution, while the second dimension represents issues that have the potential to divide both parties internally, like regional conflicts over slavery, and later racial and civil rights. Moreover, Poole has argued that the waning importance of the second dimension after the civil rights reform of the 1960s suggests that race-related issues are now largely correlated with questions of economic redistribution, and this finding has been confirmed by survey data and correlations with interest-group ratings.Footnote 10 Other detailed studies of specific debates have indicated the importance of additional issue dimensions in legislative conflicts that are not necessarily related to economic or redistributive questions.Footnote 11 In addition, the lack of comparable data makes both a comparative and an inter-temporal analysis of the content of ideologies infeasible.
Our goal in this article is to investigate systematically the claims regarding the content of congressional ideologies. We do not aim to add to the literature examining the validity of the Poole and Rosenthal measures, but rather to take these measures as given and then investigate what they signify. In other words, we are not taking a stance on whether these ideological orientations reflect the personal belief systems of elected politicians or whether they are the consequence of agenda control, constituency constraints, interest-group influence, career concerns or any of the other factors suggested in the literature. But we assume that a legislator's ‘effective’ ideology, as measured by nominate scores, ultimately influences political behavior, such as his or her legislative voting record, even if it is shaped and constrained by other factors.
In contrast to Poole and Rosenthal and most of the existing literature on legislative ideologies, we are using congressional speech rather than voting behaviour, because it is a richer source of data with which to study the content of political ideologies. While our focus here is on the US Congress, our methods can also be used to compare ideological content over time or across political systems. Political text has been a neglected source of data in political science, in part due to the lack of rigorous methods to extract and process relevant information in a systematic fashion. Traditionally, scholars had to rely on labour-intensive coding methodologies to study political texts, party platforms and campaign speeches.Footnote 12 Recent advances in computational linguistics, however, have opened up new avenues for analysing political language in various domains and contexts.Footnote 13
Researchers have also begun to apply automated text analysis in order to measure ideological positions. For instance, Laver, Benoit and Garry took a semi-automated approach to analysing European party manifestos: first, by using domain experts to place a few parties as reference points on a left–right ideological scale; and then by extracting word frequencies from their respective party manifestos. Other parties’ ideological positions were then estimated from how closely their party manifestos’ word frequency distributions matched the reference distributions.Footnote 14 Monroe and Maeda developed alternative approaches, as did Slapin and Proksch.Footnote 15 These authors use statistical techniques similar to Poole and Rosenthal's to estimate ‘rhetorical ideal points’. In contrast to Poole and Rosenthal, their choice space is a matrix of word counts rather than vote counts for each legislator. The use of text data creates various statistical and computational difficulties, but it does allow researchers to estimate ideological positioning even in the absence of voting data – as long as reliable text documents, such as party manifestos or speech records, are available.
This line of research, however, is in the tradition of estimating ideal points from roll-call data, with voting behaviour replaced by ‘text as data’. That is, ‘unstructured data’ (i.e., text) are translated into ‘structured data’ (i.e., numbers) that can then be further analysed by various quantitative methods. Our emphasis here is less on measurement. Rather, our focus is on providing quantitative approaches that can be used to understand the content of these ideologies better.
More precisely, we will use supervised learning algorithms, Support Vector Machines (SVMs), to analyse the ideological content of legislative speech. The approach works as follows: a group of reference texts is selected to train a classifier, which is then tested on new text not contained in the training corpus. Success of the classifier is measured by its performance on this unseen text. The approach then allows us to identify the most relevant speech features that drive the classification, which will provide us with additional insight into the content of political ideology.
There are only a few applications of this method in the political domain. Examples include Purpura and Hillard, who used supervised learning techniques to identify speech topics in congressional legislation, and Thomas, Pang and Lee, who investigated whether speech classification of floor debates in the House of Representatives on a specific bill can be used as a predictor of subsequent agreement.Footnote 16
Our focus will be on the study of congressional ideologies using congressional legislative speech data. Ideologies are measured by dw-nominate scores, the most common measure of legislative behaviour.Footnote 17 Notice that we are not interested in providing alternative approaches for locating legislators in an ideological space. Rather, we are using pre-existing ideological measures (which are based on voting behaviour) to shed light on the internal structure of political ideologies. Our approach is not an assessment of these measures, but an investigation into their content. Our first goal is to investigate the validity of our approach. That is, can we indeed use a classifier trained on past speech to classify future speech? Once the validity of our approach is established, we can then use it to examine the content of the identified ideological segments.
In this study, we analyse the ideological content of speeches made in the US Senate between 1989 and 2004, fully capturing the 101st to 108th Congresses. We use Senate rather than House speeches because Senate speeches are considerably longer and unconstrained by the germaneness rule, which permits a less restricted expression of political ideologies.Footnote 18
We proceed as follows. First, we rank the senators in each Congress according to their dw-nominate scores. Then, we use the speeches made by the twenty-five most liberal and twenty-five most conservative senators in the 101st to 107th Congresses as our reference set to train an SVM classifier.Footnote 19 Next, we employ this classifier to predict the ideological positions of the twenty-five most liberal and twenty-five most conservative senators in the 108th Congress.Footnote 20 Our choice of more extreme senators is guided by the hypothesis that their ideological positions are more clearly defined. We will later investigate whether this is indeed the case by studying moderate senators.
Notice that our approach goes beyond testing whether the ideology of a given senator is consistent over time,Footnote 21 as the twenty-five most conservative and twenty-five most liberal senators may or may not be identical to the list of senators used for the training set.Footnote 22 Rather, if successful, our method will identify characteristics of political speech that are consistent over time and shared by members with similar ideologies.
In the next section, we briefly discuss our methodology, followed by a section on data preparation. We then outline the details of the estimations and our results. Given the very high success rate in correctly classifying senators over the relevant time frame, we then identify the features (or words) that drove the classification. One of the most important findings of this analysis is the importance of value concepts related to cultural controversies such as abortion and gay rights. We then apply our approach to moderate senators. This provides not only an additional validity check, but also an examination of the difference between speeches by moderate and extreme senators, while at the same time offering deeper insights into the content of congressional ideologies. In the discussion section, we consider various methodological issues, extensions, and consequences for the study of political ideologies and parties. This is followed by a brief conclusion. For the interested reader, Appendix A offers additional details on our methodology, while Appendix B provides supplementary estimation results.
Methodology: text classification algorithms and support vector machines
Many supervised learning algorithms have been used for text document classification. On the basis of the performance in previous classification tasks,Footnote 23 Support Vector Machines (SVMs) have been identified as one of the most effective text classification and feature selection methods.Footnote 24 We chose accuracy as our evaluation criterion, defined as the proportion of correct predictions among all predictions. SVM-based text classification accuracies can vary widely between different tasks. They may be as high as over 95 per cent for some topic categories in news articles, or as modest as around 75 per cent for opinion classification of movie reviews.Footnote 25 A classifier is usually considered effective when the accuracy is higher than a baseline method, which can be something as simple as a random guess for balanced datasets or a majority of cases for skewed data sets.
In our analysis, we have a binary classification problem with two categories: ‘(extreme) conservative’ and ‘(extreme) liberal’. The data – documents in our application – are represented as vectors in an n-dimensional space, each dimension corresponding to a linguistic feature deemed relevant to the classification task.Footnote 26 In the training phase, the category membership of each data point is given. In our case, it would be a ‘conservative’ or ‘liberal’ label based on the legislator's dw-nominate score. To simplify the notation, we label one category as ‘+1’ and the other as ‘−1’. Thus, a training set of l examples is represented as a set of ‘vector and label’ pairs:

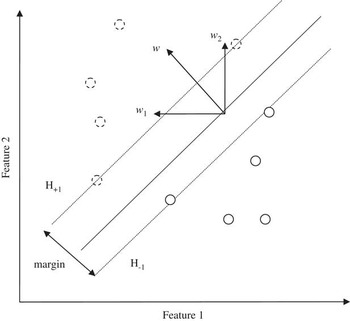
The Support Vector Machine model is based on the following idea.Footnote 27 If the data points in the positive and negative categories are separable by a hyperplane, then there is a hyperplane that is maximally separating, in that the distance between it and the nearest data point is maximized. This ‘ideal’ hyperplane lies at equal distances between two parallel hyperplanes, each of which is determined by one or more of the data points in one of the two categories. These data points on the parallel hyperplanes are called the Support Vectors (SVs). The distance between the two parallel hyperplanes is called the margin.
The task of a Support Vector Machine in the training phase is to find the two separating hyperplanes such that the margin is maximized. This is achieved by computing the parameters w and b in the linear decision function y = w • x + b. In the test phase, the classification of a new data point x – represented in the same vector space but of unknown category membership – is based on the relative location of this point to the maximally separating hyperplane, which is given by the sign of w • x + b.
Aside from its role in the classification of new data, the vector w is of interest in its own right, as it furnishes valuable insights about the informativeness of each feature in determining category membership. In general, since the dimensions of the vector space correspond to the features used in the classification, the components of w can be used as feature-ranking coefficients. If the classifier performs well, those components of w whose absolute values are highest correspond to the most informative features. We will use this feature-ranking method to find the most informative word indicators of liberal and conservative ideologies. More mathematical details of SVM can be found in Appendix A.Footnote 28
Document representation
As noted above, in our text classification model, documents are represented in a vector space whose dimensions correspond to the linguistic features that are relevant in the classification. In our implementation, the relevant features are words (more precisely, word types), and the vector representing each document is determined by the number of occurrences (or tokens) of each of the words in that document. The simplest and most widely used method for obtaining vectors from documents views the latter as ‘bags of words’ (BOW).
The BOW model is insensitive to many potentially informative properties of documents, such as the location of words in the document, grammatical relations, the internal structure of the document at various levels (for example, paragraph and sentence boundaries) and multi-word phrases such as ‘war on drugs’. Some researchers have tested more sophisticated document representations which incorporate such information (for example, relative word position and syntactic structure) in a variety of classifiers. However, experimental results showed that these complex features did not improve the classification performance significantly.Footnote 29 Therefore, we use the BOW approach in this study.
The value of each word type in the feature space can be determined in various ways: It may simply record the word's presence or absence in the document, leading to a Boolean representation, or it can list the word's frequency of occurrence in the document. In turn, this frequency can be normalized by document length or weighted by some other weighting scheme. The most common word frequency weighting scheme is a family of measures subsumed under the label tf*idf. Here, tf and idf stand for ‘term frequency’ (the number of occurrences of the word in the document) and ‘inverse document frequency’ (the inverse number of documents in which the word occurs). The idea is to offset the impact of high-frequency words in the given document by the extent to which they also occur in other documents, based on the assumption that words whose occurrences are dispersed over many documents are less useful in the classification task. Specifically, in our implementation, given a training set of n documents, the tf*idf value of a word with term frequency tf in a document of length l and document frequency df is given by the formula:

The tf*idf weighting applies only to the training data. In the prediction step, the test examples are completely independent from each other, and the total number of test documents is assumed to be unknown to the classifier. Furthermore, normalization does not change the frequency ratios between words, and consequently does not change the classification result. Therefore, we used the raw word frequencies to represent test document vectors in our tf*idf experiments.
The use of computational linguistics to study political behaviour is a fairly new endeavour. It may, therefore, be useful to discuss performance criteria in more detail. As our article is the first to use SVM in classifying political ideology, we cannot compare our findings with pre-existing work in the same domain. However, there are some reference points in other domains, such as customer opinion classification for movie or restaurant reviews. In this last application, the goal is to correctly classify reviews as ‘positive’ or ‘negative’. Opinion classifiers have achieved accuracy levels as high as 88 per cent for product reviews and 82 per cent for movie reviews.Footnote 30 However, Finn and Kushmerick found that an opinion classifier trained on movie reviews was not effective in predicting the polarity of restaurant reviews, and vice versa.Footnote 31
This domain dependence suggests that classification methods can be used to assess coherence across different types of documents. In the political context, we are not dealing with product domains, but different issue domains. A highly coherent ideology will view different issues in the same way. In other words, on the one hand, low classification success across congresses (given the variation of issues over time) will be evidence of highly issue-specific and orthogonal attitudes. On the other hand, high classification success will be consistent with a constrained belief system that categorizes different issues in a predictable manner.
Data preparation
We downloaded all senatorial speeches of the 101st–108th Congresses from the website thomas.gov. We then converted the original HTML files to raw text by removing the HTML tags, headers, tables, lists and unicode characters, and segmented the files into individual speeches. An individual speech is a senator's speech given in a continuous time period until he or she stops. The beginning of a speech is always ‘Mr/Ms/Mrs. XXX’,Footnote 32 and the end of a speech can be the beginning of another senator's speech, an officer's action or a document inserted into the printed record. Details of the speech segmentation method can be found in Yu et al.Footnote 33
We used Poole and Rosenthal's dw-nominate score as the measure to select the ‘extreme’ senators – the twenty-five most conservative and the twenty-five most liberal senators in each senate. In a typical hold-out test for text classification tasks, a certain percentage of documents are set aside for training purposes and the rest are used as test data. In our study, a training document is a senator's complete set of speeches in each senate over the 101st–107th senates, and a test document is a senator's complete set of speeches in the 108th Senate. Thus, there are 350 training documents and 50 test documents, 400 in total.
The documents were subjected to a variety of pre-processing procedures. These procedures comprised different combinations of tokenization, stemming and part-of-speech tagging. We used a simple tokenizer to split the speeches into individual words. The tokenizer recognizes consecutive strings of alphabetical characters as valid words. Part-of-speech tagging is of particular importance, since part of our goal was to investigate the role of each content word class – nouns, verbs, adjectives and adverbs – in isolation.
To reduce the vocabulary size, we arbitrarily set a minimum term frequency of 50 and document frequency of 10 for a word to be selected as a feature, assuming that words with frequencies below that threshold have low coverage and thus are not useful for classification. We also removed the top fifty most frequent words as ‘stopwords’ which do not bear solid meaning (mostly function words, such as the, a, and of). Since every senator's ideological label is expected to be consistent across congresses, and because forty-five out of fifty senators in the 108th Senate (the test set) are also members of previous senates (the training set), we conjecture that senators’ names are correlated with their ideological labels. To prevent the model from predicting based on name matching, we removed all names of senators from the vocabularies. Similarly, there might be a correlation between state names and ideological labels. The senators in the training set represented forty-five states; among them, the senators from seventeen states were all conservative and those from eighteen other states were all liberal during the 101st–107th senates. To prevent the classifier from being dominated by this correlation, we removed all state names and the names for the residents (for example, ‘Marylanders’) from the vocabularies.
The Porter Stemmer was used for suffix trimming.Footnote 34 Stemming reduces the vocabulary size significantly by mapping different forms into the same stem, but it can also be harmful for information retrieval and classification if different forms of the same word contribute differently to the classification. For example, stemming verbs discard the tense information, which would harm the classification if verb tense were an important predictor.Footnote 35
Classification design and results
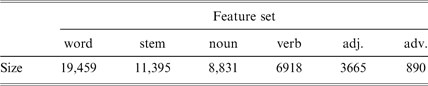
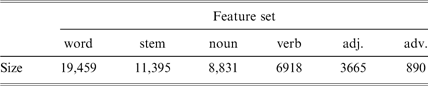
The combinations of classification algorithms, feature sets and feature weighting schemes lead to various classification methods. We tested SVMs using three feature weighting schemes – Boolean (word presence/absence), normalized frequency and tf*idf – and six feature sets – ‘word’ (individual words), ‘stem’ (stemmed words), ‘noun’ (nouns), ‘verb’ (verbs), ‘adj.’ (adjectives) and ‘adv.’ (adverbs). Table 1 lists the vocabulary size for each feature set. Hence, we tested 3*6 = 18 different SVM methods in total.
Feature Set Sizes
In evaluating a classifier on a given fixed dataset, it is necessary to divide the data into a test set and a training set. We used an ‘n-fold cross-validation’ approach. Here, the total dataset is split into n subsets of equal size, each of which is held out and used to test a classifier trained on a corpus comprising the remaining n−1 sets. The overall accuracy of the method is then measured by the average of the accuracies obtained in the n tests. An extreme case of n-fold cross validation is ‘leave-one-out’; here, n equals the size of the dataset, the test is run n times, and one example is held out each time.Footnote 36
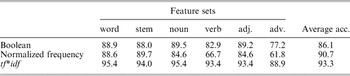
We performed ‘leave-one-out’ cross-validation on the training set to estimate the effectiveness of our classification methods. The cross-validation evaluation results are shown in Table 2. The results show that tf*idf–SVM is the best classification method, reaching an accuracy level as high as 93.3 per cent averaged over the six feature sets. This article focuses on the analysis generated by the tf*idf–SVM classification results.
‘Leave-one-out’ Cross Validation on the Training Set Representations

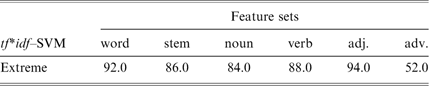
The tf*idf–SVM method achieved an accuracy of 92 per cent with the Word feature set (Table 3).Footnote 37 This result implies that out of the fifty most conservative and liberal senators in the 108th Congress, forty-six were correctly classified based solely on the words they used in their floor speeches. Recall that forty-five of the fifty ‘extreme’ senators were also extreme members of previous senates. The remaining five extreme senators are Reid, Chambliss, Cornyn, Graham and Sununu. Senator Reid had served in Congress for a long time. His dw-nominate score, however, had changed gradually from moderate (−0.235 in the 101st Congress) to extreme (−0.381 in the 108th Congress), and therefore he is not represented in the training data, but only in the test data. The other four senators were new members of the 108th Congress. The four misclassified senators are Dayton, Frist, Reid and Schumer, all represented in the training data except Reid, and therefore the ‘in-sample’ accuracy is 42/45 = 0.93 and the ‘out-of-sample’ accuracy is 4/5 = 0.80.Footnote 38
tf*idf–SVM Extreme Prediction Results (with Extreme Training Set)
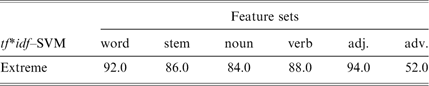
This high classification success speaks for the validity of our approach. First, it shows that senatorial speech (at least for extreme senators) is highly consistent over time. This is true even though senators may face different issues in different congresses. Secondly, speech-based classification on a given set of senators also applies to new senators of the same ideological orientation. In others words, ideology, as expressed in congressional speech, appears to be shared. This latter conclusion, however, needs to be treated with caution as it is based on a small sample. We now turn to feature analysis to examine the content of the political ideologies.
Feature analysis
As discussed above, one of the main goals of this study is to shed light on the content of ideologies. This task can be accomplished by analysing the most discriminative features generated by the SVM classifier. The word features were sorted by their coefficients in the generated SVM linear prediction function. In our implementation, ‘positive’ features indicate the linguistic characteristics of conservative speeches and ‘negative’ features indicate those of liberal speeches.Footnote 39
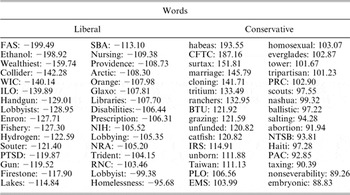
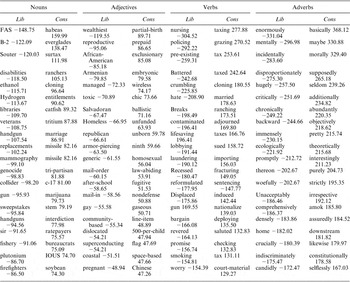
We report the corresponding lists of vocabulary words obtained with the tf*idf–SVM feature set analysis. Table 4 shows the words with the highest feature weights in the classifier, which achieved a 92 per cent classification rate (as seen in Table 3). The feature analysis yields some interesting insights. First, note that we find comparatively few words related to redistribution and taxation issues (wealthiest, surtax, unfunded). Notice also that Democrats are the ones using company names, especially those known from scandals (Enron and Firestone as in ‘Ford–Firestone’). Secondly, many of the top issues for Conservatives are from the domain of culture and values. Examples include marriage, cloning, unborn, homosexual and abortion. Only handgun and gun (in the context of gun control) play that role for Democrats. We also find various terms related to local environmental and economic interests, such as ethanol, hydrogen, arctic (as in ‘Arctic National Wildlife Refuge’) for Democrats, and ranchers, catfish, grazing for Republicans. Note also that ideologies express themselves not necessarily by talking differently about the same issues, but by talking about different issues – with Democrats, for example, using words related to corporate special interests and to the environment, while Republicans talk about abortion and other issues related to values and morality.Footnote 40
tf*idf–SVM Feature Set Analysis for All Vocabulary

Notes: Words are decreasing in weight (from most conservative or most liberal). All words were converted into lower case during classification. In the above table, acronyms and proper names were recovered to upper case for ease of reading.
Glossary: FAS: Federation of American Scientists; WIC: Women, Infants, and Children Program; ILO: International Labor Organization; PTSD: Post-traumatic stress disorder; SBA: Small Business Administration; NIH: National Institute of Health; NRA: National Rifle Association; CFTC: Commodity Futures Trading Commission; BTU: British Thermal Unit; IRS: Internal Revenue Service; PLO: Palestine Liberation Organization; EMS: Emergency Medical Service; PRC: People's Republic of China; NTSB: National Transportation Safety Board; PAC: Political Action Committee.
Source: A complete list of the features can be found at http://textmining.syr.edu/beiyu/BJPS/train-adj-tf50-df10-tfidf-numlabel.svm.fw.sorted.txt.
We also conducted a classification based on nouns, adjectives, verbs and adverbs.Footnote 41 Recall from Table 3 that the classification based on adjectives was particularly successful, followed by nouns and verbs, with adverbs providing by far the poorest classification. A look at Table 5 explains why. Note again the predominance of culture and value-related words, especially among the adjectives.
tf*idf–SVM Feature Set Analysis for Nouns, Adjectives, Verbs and Adverbs

Note: Words related to geography and proper names are removed. Words are decreasing in weight (from most Conservative or most Liberal). The weights are comparable within each feature set (noun, adj., adv., or verb), but are not comparable between feature sets (e.g. comparing the weights of the verb ‘tax’ and the noun ‘surtax’ is not meaningful.) The complete list of features and weights can be accessed from http://nico.tech.northwestern.edu/~byu422/BJPS-feature-weights/. In the Verb category, the first ‘tax’ refers to the verb in the present tense (as in ‘the government should not tax the rich’), while the second ‘tax’ refers to the verb itself (as in ‘to tax the rich is just wrong’). Our algorithm treats different part-of-speech tags as different words. We removed the part-of-speech tags for better readability.
Overall, we see that the key issues discussed by liberals are energy and the environment (or alternative energy), corporate interests and lobbying, health care, inequality and education. For conservatives, the key issues discussed are taxation, abortion, stem cell research, family values, defence and (to a lesser extent) government administration. The issue of taxation is quite subtle. For example, the word tax as a noun (as in income tax) does not discriminate, while the verb tax and in the form taxing is highly discriminating for conservatives. In other words, conservatives tend to highlight the action of taxing, rather than the issue itself. We also find some common topics of discussion, mainly procedural terms (such as adjournment or unanimous consent) and idiosyncratic state-specific economic interests (such as ranching, fishing, catfish and grazing).
In contrast to the findings by Poole and Rosenthal, our analysis does not show a prevalence of economic (redistributive) factors in separating liberals from conservatives. Rather, ‘value’ issues such as abortion and stem-cell research play a big role, especially for conservatives. One possible explanation is that legislators use speeches to communicate with their core electoral constituencies and signal that they are ‘true believers’. If their general electoral constituency is less extreme, this feature can take on the nature of ‘dog whistle’ politics. The core constituency understands the message; the general public may not. Some of our results suggest that these mechanisms are indeed at work. For example, among the separating adjectives for Democrats we find the word gay, and for the Republicans we find the word homosexual. In other words, the correct use of terms signals one's political ‘type’ to constituencies that care a great deal about these issues.
Up to this point, our analysis has focused on ‘extreme’ senators. This approach was based on the hypothesis that their ideological belief systems were more sharply defined as compared to ‘moderate’ senators. To assess the validity of this approach, we investigated the case of moderate senators to see whether their ideologies constitute a ‘blend’ between the more sharply defined lexica found at the extremes. In addition to providing a robustness check for our results, this analysis also sheds some additional light on the internal structure of ideologies.
Classifying moderate senators
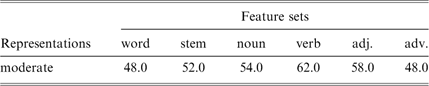
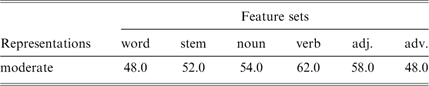
As before, we used the dw-nominate score as the measure to select ‘moderate’ senators. That is, we divided the fifty non-extreme senators into moderate conservative and moderate liberal senators in each senate. If indeed our classification methods captured ideological positions, then the algorithms trained on extreme senators should perform worse on the test set of moderate senators. The results are shown in Table 6. The higher error rate in predicting moderate senators using classifiers trained on the extreme senators is consistent with the interpretation that speech classification is indeed sensitive to ideological differences as expected. To understand how and why moderate senators are misclassified, we analysed the prediction errors made by the classifier trained on extreme senators. To simplify the analysis, we used the Boolean representation with a vocabulary limited to nouns. Recall from Table 2 that Boolean–SVM achieved an 86.1 per cent prediction accuracy in cross-validation, which is lower than the 93.3 per cent accuracy obtained by the tf*idf–SVM. However, since the Boolean representation uses simple word presence/absence information, it is easier to understand which features cause the prediction errors than in the case of tf*idf. Each document vector consists entirely of 1s and 0s.
tf*idf–SVM Moderate Prediction Results (with Extreme Training Set)
For each test example x, the SVM classifier computed a decision value Yx as defined in Equation 3, where w and b were computed during the training process:

To compare between examples with different decision values, we normalized the output to either +1 or −1:

For each i, the value of

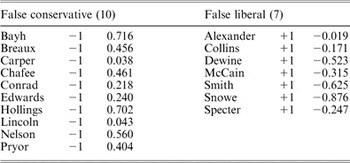
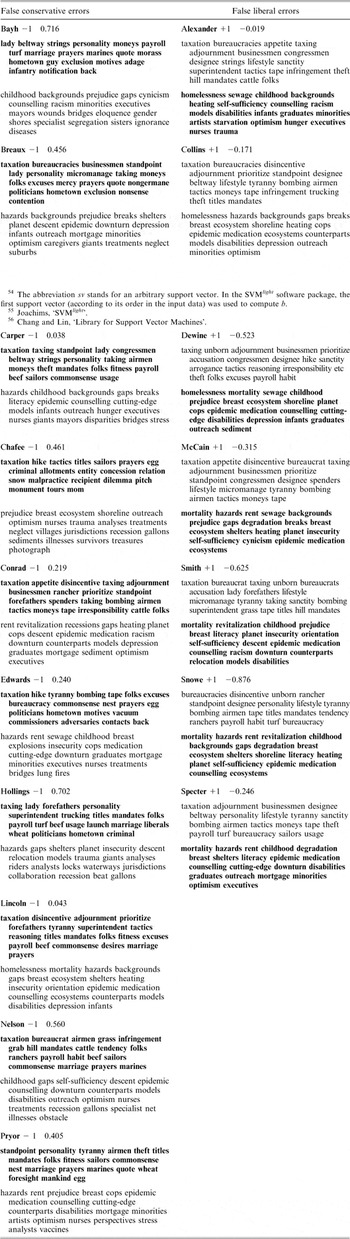
can be understood as the contribution of the feature i to the final decision for x. Thus, we can sort the features by their contributions to the decision. For the misclassified examples, we look at the noun features with the largest contributions to understand which of them are responsible for the misclassification. Table 7 lists all examples of misclassified moderate Senators along with their decision values.
Prediction Errors in the Moderate Test Case with Boolean Noun Features

Table B1 in Appendix B lists the twenty features with the largest contributions to each side for all misclassified examples listed in Table 7 (liberal contributions are listed in the first column). The highlighted features help us understand why these examples are misclassified. This table shows that, on the one hand, some moderate liberal Senators were misclassified as conservative because they talked about some traditionally ‘conservative issues’, such as bureaucracy, taxation, marriage, etc., although mentioning these issues, of course, does not necessarily imply support for the conservative position.Footnote 42 On the other hand, some moderate conservative senators were misclassified as liberal because they mentioned ‘liberal issues’ such as children, ecosystem, literacy, shelter for the homeless, etc.
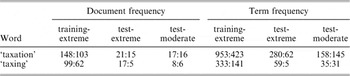
To investigate this in more detail, we took a closer look at the issue of taxation. Table 8 lists the term frequencies and document frequencies of the words ‘taxing’ and ‘taxation’ for three subsamples: 101st–107th extreme senators, 108th extreme senators, 108th moderate senators. Recall from Table 5 that tax and taxpayers are not discriminating between the two ideologies. In contrast, taxation and taxing, which emphasize the action of taxing, are highly discriminative. Extreme conservative senators are much more likely to use these words than extreme liberal senators: For example, taxation was used 953 times by extreme conservative senators in the 101st–107th Congresses and 280 times in the 108th Congress; however, it was used only 423 times by extreme liberal senators in the 101st–107th Congresses and 62 times in the 108th Congress. In contrast, taxation was used by the 108th moderate liberal and conservative senators with nearly equal frequencies (158:145). The usage of taxing follows a very similar pattern. This means that extreme senators collectively use taxing and taxation as strong ideology indicators, while moderate senators, typically, do not. Indeed, moderate senators who do use taxing and taxation in similar ratios as their more extreme peers are more likely to be misclassified.
Example of Words with Significantly Different Numbers of Occurrences in the Conservative and Liberal Speeches

Note: Format of table is: (occurrences in conservative speeches: occurrences in liberal speeches).
Discussion
While the results of our analysis are promising, many questions remain. Of particular importance are robustness issues. For example, we may want to investigate whether our results for the Senate also hold for the US House of Representatives. Unfortunately, we cannot directly compare these findings because the dw-nominate scores are not equivalent across chambers.Footnote 43 However, we can use a simpler but somewhat less informative measure, such as party membership. To investigate the issue, we conducted a classification experiment on party membership with two categories, Republican and Democrat. We used all senators in the 101st–107th Senate to train the party membership classifier (Boolean-SVM and tf*idf-SVM). The two classifiers were then used to predict the party membership of the senators in the 108th Senate. The tf*idf-SVM classifier reached 77.8 per cent prediction accuracy and the Boolean-SVM one reached 86.9 per cent, both indicating a good classification success for party membership. While this is a lower accuracy compared to our previous classification results, this drop is to be expected as we are no longer restricting attention to senators with more extreme ideological positions. Notice that a drop in accuracy would also provide additional evidence for our hypothesis that extreme senators have a more clearly defined ideology. To directly compare classification based on party membership with classification based on ideology, we divided our entire sample of senators by their DW-scores at 0, creating a ‘liberal’ and a ‘conservative’ category. We then repeated our classification test on that sample. The ideology prediction accuracy is 80.81 per cent for the tf*idf-SVM classifier and 83.84 per cent for the Boolean-SVM variant. Thus, the two classification results are highly similar. To investigate the relationship between ideology and party membership further, we computed the kappaFootnote 44 agreement score as a measure of consistency between the senators’ ideology labels and party membership. For our dataset (800 senatorial speech documents for the 101st–108th Congresses), the kappa equals 0.932, which means almost perfect agreement. In other words, the previous result implies that party membership and ideological classification are highly correlated.
With this reassurance, we can now assume that it is possible to compare the classification success rates between the House and the Senate. Some preliminary results along these lines can be found in work by Yu, Diermeier and Kaufmann on party classification. Using tf*idf–representations for the 2005 Senate, Yu et al. reach a prediction accuracy on party membership of 69.7 per cent for the Senate, and yet the same estimates performed on House data yield a classification accuracy of 80.1 per cent.Footnote 45 One possible explanation for the higher accuracy in the House may be related to its germaneness requirements and increased leadership control. Indeed, House speeches are more constrained and thus reflect more consistent positions. Of course, House speeches are also usually much shorter. In related work Yu, Kaufmann and Diermeier have found that 62 per cent of the beginning sentences and 72 per cent of the ending sentences in House speeches clearly indicate the overall positions of the speeches (supporting or opposing the bill under debate).Footnote 46 In contrast, the percentages drop to 49 per cent and 35 per cent in the Senate speeches. From a text classification perspective, the positions of speeches with clear and consistent indicators are relatively easier to classify. As a result, the above differences between Senate speeches and House speeches make the ideology classification of Senate speeches more difficult. These findings suggest some intriguing possibilities for further research. For example, a surge in classification accuracy over time may indicate an increase in agenda control or changes in the partisanship of members and their constituencies. Addressing these questions will require additional data collection that would allow for longitudinal cross-chamber studies.
A longitudinal approach may also help to answer the question whether the time period studied here has some unusual characteristics. For example, given that the period we analysed was characterized by sustained high economic growth, it is possible that political conflict may have shifted to other, non-economic, factors.Footnote 47 That said, a shift towards non-economic conflict would signal an important deviation from the interpretation offered by Poole and Rosenthal. One way to address this issue would be to analyse earlier congresses to see whether we find a similar importance of non-economic dimensions or whether we are witnessing a genuine shift. At this point, such an investigation is severely impeded by the limited availability of text in digital format.
Similarly, we can apply these methods to study language in different legislatures. In subsequent work, Høyland and Godbout have used SVMs to classify the party affiliation of members of the European Parliament (MEPs) based on their plenary speeches in the 5th and 6th Parliaments. Unlike the US Congress, the European Parliament (EP) contains as many as seven distinct party groups in a given session, and therefore the classification task is much more complex. Nonetheless, the overall classification accuracy of their model was relatively high for most parties, reaching as much as 77 per cent for the United Left and Nordic Green parliamentary group. The authors were also able to use SVM to compare the speech similarities of party-group members who represented different countries.Footnote 48 Although most parties displayed a high level of cohesion in their voting records during the 5th and 6th Parliaments, their analysis of legislative speech demonstrated that the same party-group members spoke about different issues in their planetary speeches. This was found to be especially true when comparing MEPs from old versus new member states who shared the same party and joined the European Union after the 2004 enlargement.
In summary, text classification results combined with feature analysis may provide a promising new methodology to study the content, changes and differences of ideological positions quantitatively. By means of some clever comparative designs, it may also be possible to disentangle some of the suggested influence factors of ideological positions, such as constituency pressure, party leadership influence and agenda control.
Conclusion
Perhaps the most important finding of the Poole–Rosenthal approach is that much of the voting behaviour in Congress can be explained by a stable, low-dimensional issue space. Indeed, for recent years (104th–106th Congress), a single dimension could account for about 90 per cent of all roll-call choices by members of Congress.Footnote 49 Poole and Rosenthal have argued that this dominant ideological dimension represents the traditional left–right ideological continuum associated with the government's role in the economy and economic redistribution,Footnote 50 which increasingly is subsuming intra-party conflict and voting on the second dimension.
In this article, we have argued that analysing political speeches rather than voting behaviour can provide additional insights into the ideological positions of members of Congress. We rely on methods from text analytics which allows us to dispense with labour-intensive human coding. In addition, the approach was shown to be replicable, efficient and highly scalable. Our analysis of senate speeches provided strong evidence for consistent and common ideologies expressed in speech. The classification success was much higher than in comparable studies of consumer and voting behaviour. It also allowed us to gain some understanding of what separates the two ideologies at the conceptual level. First, consistent with Poole and Rosenthal, senators appear to separate on economic issues. However, such separation is expressed quite differently by the two sides, with Democrats frequently referring to corporations, special interests and the environment, while Republicans frequently mention the act of taxing (not the more technical ‘taxation’). Secondly, in contrast to Poole and Rosenthal, terms related to values and moral issues are used prominently, especially by conservatives in the context of family and abortion. Thirdly, the speeches seem to be well designed to appeal to partisan constituencies, as in the use of ‘gay’ versus ‘homosexual’. This may provide some evidence that senators consciously use ‘signal’ words to demonstrate their allegiance to core beliefs of more extreme constituents. Fourthly, moderate senators exhibit more nuanced speech patterns, which lowers their classification accuracy. Interestingly, these misclassifications add further support to the importance of some of the key features identified.
It is also interesting to note that part of our findings share some similarity with the work of cognitive linguists such as Lakoff.Footnote 51 Lakoff argues that the Republican and Democratic ideologies reflect different value systems deeply associated with personal views of morality. Our results are consistent with this approach, but further research is necessary. It would be particularly important to investigate whether the content of ideologies has shifted over time. While such an approach is currently not viable due to the limited availability of digitized text data, it marks an important next step in our understanding of political ideologies.
Appendix A
The task of a Support Vector Machine in the training phase is to find the two separating hyperplanes such that the margin is maximized. For illustration, consider the special case that each data point is represented by a pair of co-ordinates in a two-dimensional space, as shown in Figure 1. The general notion of a hyperplane corresponds to a line in two-dimensional space. In the figure, the ‘ideal’ separating hyperplane and the two parallel hyperplanes running through the support vectors are shown as the dotted line and the two dashed lines H−1 and H+1.
Linear-separating hyperplanes with maximized margin

The points x on the maximally separating hyperplane (the dotted line in the figure) satisfy the equation:Footnote 52

where w is a vector perpendicular to the hyperplane and  is its perpendicular distance from the origin (
 is the Euclidean norm of w). The SVM training algorithm yields values for b and w such that for all (xi, yi) in the training set, w • xi} + b≤ - 1 if yi = - 1 and w • xi + b≥ + 1 if yi = +1; the corresponding equalities hold for the points on H−1 and H+1. In the test phase, the classification of a new data point x – represented in the same vector space but of unknown category membership – is based on its location relative to the maximally separating hyperplane, given by the sign of w • x + b.
Aside from its role in the classification of new data, the vector furnishes information about the informativeness of each feature in determining category membership. In general, since the dimensions of the vector space correspond to the features used in the classification, the components of w can be used as feature ranking coefficients. If the classifier performs well, those components of w whose absolute values are highest correspond to the most informative features. This is a common property of all linear classifiers.
More formally, the SVM algorithm maximizes the margin between the two separating hyperplanes by finding the maximum of the functional:

subject to the constraints

Only the support vectors have non-zero αi values. For the other data points, αi = 0. In (6), above, K(xi, xj) is the kernel function. We use the linear kernel  , because it suits the text classification problem well. The linear kernel function can be replaced by other functions to handle non-linear boundaries. Studies show, however, that they do not improve text classification performance significantly.Footnote 53
After training, the parameters w and b are given by (8) and (9).Footnote 54 Given a text example x, the linear decision function is the sign of w • x + b.


There are several efficient implementations of the SVM algorithm, such as LIBSVM and SVMlight.Footnote 55 We used the SVMlight package with its default setting in this study.Footnote 56
Appendix B
The following table lists the twenty features with the most contributions to each side for all misclassified examples listed in Table 6. Conservative contributions are featured first. The features that are highlighted in bold font help us understand why these examples are misclassified.
Prediction Errors in the Moderate Test Case with Boolean Noun Features