

Good evening. It is a pleasure and an honour to be here at NIESR to give the annual Dow Lecture. We are very lucky in the UK to have high-quality independent institutions such as NIESR focusing on the policy landscape, and in my time on the MPC I have always valued their commentary and research.
Today, I will speak about a topic at the heart of the MPC decision making: managing policy trade-offs.
I will make four key points:
-
A major aftershock of the pandemic has been an extraordinary increase in energy prices and global goods prices. For the UK economy, as a net importer of energy and goods, this is a type of negative supply shock, in many ways akin to a reduction in productivity.
-
This shock pushes up on prices, while lowering real incomes and aggregate spending. In contrast with demand shocks, which monetary policy can help offset (stabilising both inflation and activity), there is a trade-off for monetary policy: a (significant) monetary tightening to bring down inflation quickly, would come at the cost of far greater output volatility.
-
Our remit recognises those trade-offs and guides the MPC, in forming and communicating its judgements, to ‘promote understanding of the trade-offs inherent in setting monetary policy to meet a forward-looking inflation target while giving due consideration to output volatility’.
-
One-off shocks to energy prices are not something that we can reliably forecast in advance, while the increase in goods-price inflation has been closely related to the evolution of the pandemic. But even if they had been fully anticipated, trying to fully offset their impact on inflation via much tighter policy would not have prevented the reduction in real wages and incomes. On the contrary, it would have caused an enormous increase in unemployment and driven the economy into a deep recession. I would have viewed this as inconsistent with the MPC remit.
1. Monetary policy trade-offs
Since its inception 25 years ago, the MPC has been tasked with achieving the Government’s inflation target. But the remit has also always recognised that ‘the actual inflation rate will on occasion depart from its target as a result of shocks and disturbances’. And that ‘[a]ttempts to keep inflation at the inflation target in these circumstances may cause undesirable volatility in output’. The MPC is required to balance these short-term trade-offs between meeting the inflation target and avoiding output volatility. In 2013 the remit was clarified to also include exceptional circumstances where ‘shocks are particularly large or the effects of shocks may persist over an extended period, or both. In such circumstances, the Committee is likely to be faced with more significant trade-offs between the speed with which it aims to bring inflation back to target and the consideration that should be placed on the variability of output’. As well as balancing these objectives, the MPC is required to ‘set out in its communication…the trade-off that has been made’.
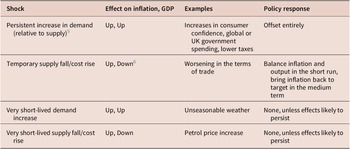
The precise trade-off that policymakers face changes over time, depending on the shocks hitting the economy. When there is a persistent change in demand, for example, owing to what Keynes called ‘animal spirits’, or an exogenous rise in government spending, or a tax cut, increased spending leads to a higher demand for labour and other productive inputs. Following standard Phillips curve logic, tighter labour market conditions and increased input demand bid up wages and costs, and inflationary pressures build. If we observe this happening, the MPC policy response is straightforward: tighten policy to dampen inflation and prevent an unsustainable boom in output. There is no conflict between our objectives.
In contrast, when the economy is hit by temporary cost or supply shocks, policymakers face a trade-off. These shocks typically move output and inflation in opposite directions. For example, an increase in the price of energy drives up consumer prices directly via petrol and utility bills, and indirectly via higher costs for firms. But it also tends to weigh on consumption as household real income falls.Footnote 1 If policymakers aim to keep inflation strictly at target in the face of such shocks, the cost is high output volatility. At the other extreme, a focus only on minimising output volatility implies greater inflation-target misses. In theory, policy can choose between these different options. In practice, I view our remit as consistent with aiming for a balanced approach, accepting some volatility in each objective. Whether tighter or looser monetary policy is required depends on the exact nature of the supply shock, and how it impacts demand. Crucially, this trade-off management can only apply in response to temporary shocks. Price stability, consisting of meeting the inflation target, is the primary objective in the remit. Policy must always focus on bringing inflation back to target in the medium term.
Trade-offs are not the sole reason we do not achieve the inflation target at all times; policy can affect the economy only with some lag.Footnote 2 Since shocks are inherently difficult to predict in advance, it will never be possible to fully offset them.Footnote 3 Moreover, the full effect of policy builds over time. Hence, faced by very short-lived shocks to supply or demand, reacting would be counterproductive. The full effect of policy on the economy would come through only after the shock had already gone, increasing both inflation volatility and output volatility rather than reducing them. It is for this reason that the MPC has tended not to respond to one-off shocks to the level of consumer prices, such as shocks to petrol or government-administered prices; or very short-lived shocks to demand, such as those related to unseasonable weather.
While many trade-off-inducing shocks are externally driven, a robust monetary policy framework is also crucial in limiting adverse trade-offs caused by inflation expectations, and ultimately in ensuring price stability.Footnote 4 If price and wage setters in the economy did not believe that the MPC was committed to setting monetary policy consistent with achieving the inflation target over the medium term, they would adjust their inflation expectations accordingly. Just like an external shock, this would feed into actual inflation for a given level of output, and policy would have to run a persistently positive or negative output gap to bring inflation back to target, at the cost of additional output volatility. To avoid such a situation, which led to persistently high inflation in the 1970s, the UK inflation targeting framework is designed to ‘ensure inflation expectations are firmly anchored in the medium term’.
In setting policy, the MPC is always focused on medium-term inflation prospects.
These different shocks and responses are summarised in table 1. Distinguishing between them, as well as quantifying their impact, is particularly important at present, because to greater or lesser degrees, the UK economy has been affected by all of them over the past 2 years. COVID has essentially led to a combination of all of these shocks together. Moreover, many of these economic shocks have been far larger in size than anything we have experienced in the recent past.
Stylised summary of shocks and policy responses

From early 2020, we were aware that COVID would lead to massive falls on both demand and supply in the economy. Demand fell sharply for sectors where COVID infection risks were viewed as high, particularly in services. But supply also fell during lockdowns, as workers left the labour force or were furloughed on the government’s job retention scheme. On balance, these effects were initially disinflationary, even more so when factoring in the 2020 collapse in energy prices. But given the fall in supply, they were far less disinflationary than would have been expected from the fall in demand alone. In addition, by maintaining incomes, the furlough scheme mitigated some of the second-round effects from lower employment to spending.Footnote 7 The heterogeneous nature of the fall in demand also dampened its disinflationary effects.Footnote 8
As global demand recovered, these disinflationary pressures quickly gave way to inflationary ones, leading to a trade-off for UK monetary policy. An imbalance between strong global demand for goods and disruption to their supply transmitted to the UK as a further negative supply shock (or adverse terms of trade shock). So too did a recovery and then further rises in energy prices. Despite the expected bounce back, output remains below the trend implied by its medium-term potential, and is only now returning to its pre-COVID level, with market-sector output not quite fully recovered. My policy decisions have sought to balance those trade-offs, as required by the remit. Recently, we have seen an intensification of the trade-off, which will continue further in the coming months.
These wide-ranging effects, each requiring different solutions, create challenges for monetary policy. We need to accurately assess how much current data reflect shocks that are likely to be very short-lived, and best to look through; how much represents more persistent demand pressure that we should seek to fully offset; and finally, the extent to which we are seeing persistent but ultimately temporary supply shocks, which create a trade-off that we are required to manage. To add a further complication, expectations of whether shocks are temporary or persistent, and of how we will manage these trade-offs, also have the potential to feed back into further economic shocks. With those uncertainties in mind, I will use the rest of my speech to offer my own assessment of the current trade-off, starting with developments in inflation.
2. Inflation and real incomes
Over recent months, the sharp increase in consumer-price inflation has understandably become a key concern for UK households and firms, and of course for the MPC. Inflation in January was 3.5 percentage points above our 2 per cent target, and it is set to rise further over the next few months.
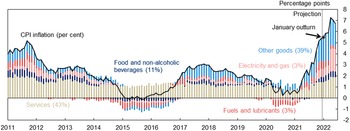
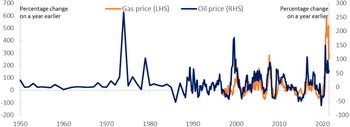
The vast majority of current and prospective inflation stems from external factors, rather than demand in the UK. At the projected peak of inflation of 7.3 per cent in April, 5.3 percentage points were expected to be accounted for by increases in energy and goods prices (Chart 1). Both sets of prices are largely determined on globally traded markets, so the price increases represent a specific type of negative supply shock: a worsening in the UK terms of trade. Energy prices, in the form of petrol and domestic gas and electricity, were projected to account for 2.4 percentage points of April inflation, despite making up only 6 per cent of the CPI basket. And in light of recent geopolitical events, energy prices have increased further since these forecasts were published in our February 2022 MPR. Having fallen to a low of £19 per barrel in April 2020, sterling oil prices have risen to a monthly average of £70 so far in February, over one and a half times higher in the past 12 months alone (Chart 2). Wholesale gas prices have also risen to record highs, nearly quadrupling over the same period.
Contributions to CPI inflation.
Sources: Bloomberg Finance L.P., Department for Business, Energy and Industrial Strategy, ONS and Bank calculations.
Notes: See notes to Chart 2.19 in the February 2022 MPR. January 2022 outturn shown for aggregate CPI inflation only, all other data from January to June 2022 are Bank staff’s projection at the time of the February Report.

Monthly average of sterling energy prices.
Sources: Bloomberg Finance L.P. BP Statistical Review of World Energy 2014, Thomas and Dimsdale (Reference Thomas and Dimsdale2017) and Bank calculations.
Notes: Oil price inflation rate calculated using monthly average in £ per barrel from July 1987, spliced with annual average from 1950 to 1987 (Arabian Light until 1983, Brent thereafter). Gas price inflation is calculated using monthly average spot price in £ per therm from April 1997. February 2022 averages use data to February 18.

On top of the steep rise in energy prices, goods prices explain most of the remainder of the inflation rise (Chart 1). As I discussed in a speech in October, the increase in global goods prices has been closely related to the pandemic and the ensuing policy response.Footnote 9 The global demand for goods rocketed, in part because of a rotation of demand away from services during COVID, and in part because of the large-scale fiscal stimulus that boosted household incomes in the US, the largest buyer of durable goods.Footnote 10 This increased demand has met with a limited capacity to expand supply, especially given lockdowns and transportation bottlenecks in many goods-producing countries affected by COVID.
The worsening in the UK terms of trade is leading to a sharp squeeze in households’ real incomes. In the February 2022 MPR, Bank staff projections suggested that household real incomes will have fallen by 1.8 per cent over the year to 2022 Q2.Footnote 11 While this hit to real income will be felt by households across the country, its effects are likely to be unevenly distributed. Poorer households, who spend a larger fraction of their income on non-discretionary energy consumption, are often more affected.
The distributional impact on this occasion will also depend on the effects of recent fiscal policy announcements on energy prices. Although monetary policy can influence aggregate inflation over a period of time, the painful fall in real incomes is unfortunately not something it is able to offset, in the same way as monetary policy cannot offset the direct impact of a fall in productivity.
Moreover, even the direct impact of energy prices on aggregate inflation is not something monetary policy can often influence. Shocks to energy prices are not something that we can typically predict in advance. Markets setting oil and gas prices are forward looking, so their current price reflects not only supply and demand of those commodities today, but expectations about their future price. Predictions about the evolution of oil and gas prices are typically already incorporated in either their spot or future prices. Those prices may go up or down, but it is usually not because of something that the MPC could have known about beforehand, so responding in advance is impossible. At the same time, once prices have moved, responding after the fact is likely to be counterproductive, given the lags with which policy affects the economy.Footnote 12
Importantly, even if the MPC had somehow been able to predict the full extent of the current increase in energy and tradable goods inflation, I would not see it as consistent with the remit to try to fully offset it. This point was clearly illustrated by a scenario shown by my colleague Ben Broadbent in a speech a few months ago.Footnote 13 Because it is such an important point, I have updated the scenario for the latest data, which contain further increases in the rise in inflation and the fall in real incomes.
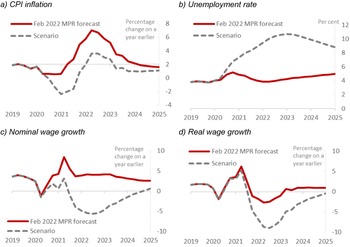
The hypothetical scenario asks: what monetary policy would have ensured inflation was at target this quarter, had we known exactly how the rest of the economy would evolve? In practice, there are many different precise paths for monetary policy that could have achieved this,Footnote 14 but all of them would have required a significant tightening in policy over the past 2 years. As a reasonable path, I assume that the policymaker fully foresees the rise in inflation from 2020 Q2, and starts on a tightening path, raising interest rates sharply each quarter until 2022 Q1, before loosening policy thereafter. Chart 3 shows the scenario outcomes (in grey dashed lines), alongside the February 2022 MPR forecast (in red lines), for CPI inflation, the unemployment rate, and annual nominal and real wage growth.
Hypothetical policy scenario, inflation at target in 2022 Q1.
Sources: ONS and Bank calculations.
Notes: Nominal wage growth is the four-quarter growth rate of private sector AWE excluding bonuses and arrears. Real wage growth is the four-quarter growth of private sector AWE excluding bonuses and arrears, divided by CPI.

The alternative scenario underlines two key points. First, tighter monetary policy cannot offset the fall in real incomes and real wages. The worsening in the UK terms of trade represents a real shock–for a given level of nominal wages, it increases prices and therefore reduces real wages and real income. If we had perfect foresight, monetary policy could have chosen to offset the inflationary impact. But when a monetary policy tightening affects inflation, it does so by reducing all nominal variables, including wages, so this would not have benefitted real wages or real incomes. In fact, since tighter policy would have led to a much looser labour market, the scenario suggests that it would have led to even more negative real wage growth in the short term.
Second, the exercise makes clear that monetary policy faces a trade-off. Given the scale of the inflationary shock we are currently experiencing, completely offsetting the impact on inflation would have required an enormous rise in interest rates at the height of the pandemic. Unemployment would have risen to over 10 per cent and we would have induced an undesirable degree of volatility in output and employment, at a time when monetary policy was aiming to fulfill its remit by helping households and businesses bridge through the worst of the pandemic. Moreover, in addition to the trade-off between current inflation and output volatility, the scenario suggests that bringing inflation back to target in the current quarter would not have led to inflation sustainably at target. Inflation falls below target in 2020, when energy prices were falling rather than rising, and again in the medium-term, given the large recession. This highlights the potentially counterproductive impact of responding to short-lived shocks.
In sum, we did not know with any certainty about the persistent increases in energy and goods prices in advance. But, importantly, had we known in advance, given the trade-offs they created, monetary policy should not have sought to fully offset the overshoot in inflation in the way it would normally offset overshoots caused by demand shocks. Doing so with the goal of hitting the inflation target in the near term would have generated a deep recession as well as a likely undershoot in inflation later on. I would not have viewed this as consistent with our remit.
How should policy now proceed? We have been surprised by the persistent strength in energy prices over the past year. But as I have discussed, this should not make us anticipate further price rises to come, over and above what markets are currently pricing in. Indeed, in a scenario using the futures curves for energy in place of our forecast assumption, inflation falls far more quickly, to 1.2 per cent in the second and third years of our forecast. Recent geopolitical events suggest continued uncertainty around energy prices, however, and, in my view, policy based on the more conservative energy price assumptions in the MPC forecast is likely to be more robust to further volatility. Our forecast predicts that global price pressures affecting goods will be more persistent, before unwinding towards the end of our forecast. Higher goods and energy prices are also likely to weigh on demand over the coming quarters. The appropriate policy response therefore also requires assessing how large that fall in demand will be.
3. Output, the labour market and domestic inflationary pressures
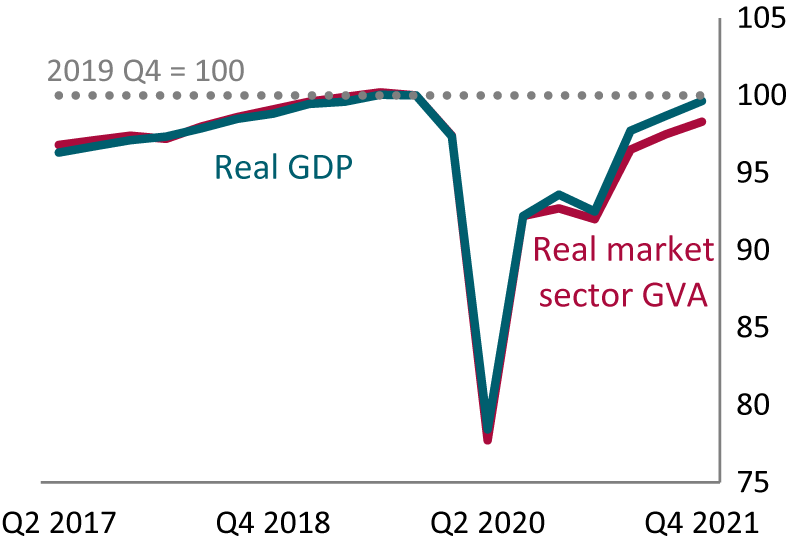
Our success in minimising output volatility will be determined by how quickly demand recovers towards its medium-term potential. This will also determine medium-term inflationary pressures: trade-offs between the two objectives only arise at shorter horizons. By the end of 2021, aggregate output had reached around its pre-COVID level (Chart 4). Compared to many previous recessions, particularly the 2008 global financial crisis, the recovery has been relatively quick, in part due to the scale of fiscal policy support. That should help limit some of the scarring we have seen in past recessions. But the recovery is not yet complete. Given increases in government output, market-sector output is still lagging its pre-COVID level somewhat. And aggregate output remains well below its pre-crisis trend, suggesting demand still has room to catch-up towards its medium-term potential, even allowing for the scarring built into the MPC’s forecast.
GDP.
Sources: ONS, Bank calculations.

As always, assessing potential supply, and thus the trend to which we should aim to recover to, is fraught with difficulty. Looking at international comparators, the US, where demand has been strongest, has managed to recover to its pre-COVID trend. But it is not yet clear whether this is a sustainable growth path for the US—while there are also some UK-specific channels that may influence supply here. In particular, a combination of factors, including Brexit and the pandemic, appear to have led to outward migration of EU workers. This could influence both the skills mix and the participation rate of the labour force, somewhat slowing potential supply growth.Footnote 16 Other channels influencing medium-term productivity may also differ across countries: for example, the amount of elective working from home after the pandemic, which should increase productivityFootnote 17; and the growth in the capital stock, with weak investment in the UK likely to weigh persistently, if not permanently, on supply.
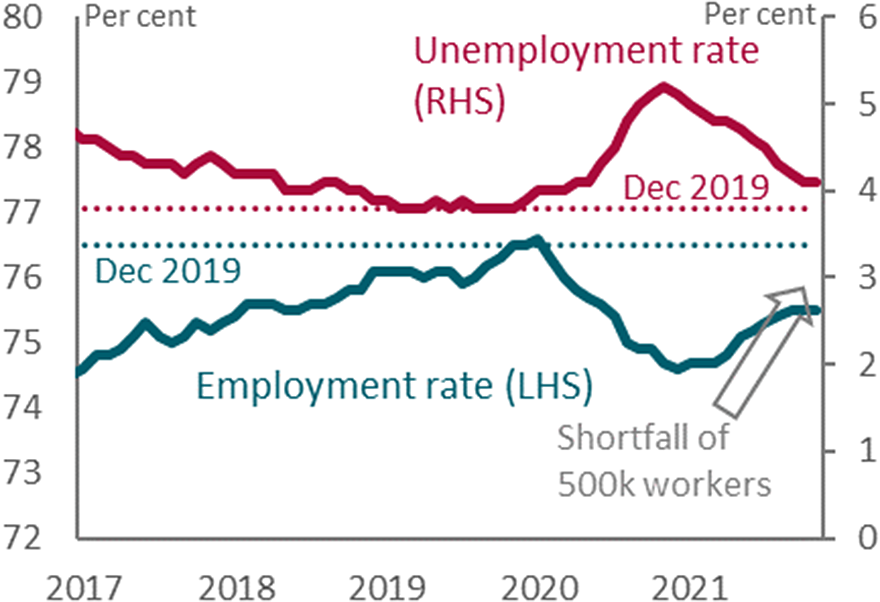
In the short term, we can infer the balance of supply and demand from the behaviour of the labour market. That balance determines domestic inflationary pressures, which are both less volatile and more directly affected by monetary policy than the external influences currently driving inflation. A key downside risk I had worried about during the pandemic was that the end of the furlough scheme, if demand had not yet recovered, would lead to a rise in unemployment, weighing further on spending and inflation. That risk has not materialised. The headline unemployment rate had fallen to 4.1 per cent by Q4, just a touch above its pre-pandemic rate (Chart 5). HMRC data suggest that the number of employees continued to increase in January, despite the impact of Omicron, while job vacancies remain at record highs. At the same time, the level of employment is still some way below its pre-COVID level, as around half a million workers on net have left the labour force. The scale of the drop in participation suggests there is still a margin of labour supply to come back on stream.Footnote 18
Unemployment and employment.
Sources: ONS, Bank calculations.
Notes: Unemployment rate aged 16 and over, employment rate aged 16–64Footnote 15.

While the labour market is clearly tight right now in the UK, this was also the case in the period before COVID, when inflationary pressures remained subdued. And this was not just a UK phenomenon: the US and the euro area also both entered the pandemic with puzzling disconnects between their labour markets and inflation readings.
What is the evidence on whether the tightness in the UK labour market is now feeding through into wages and domestic prices? Complicating the answer, both sets of data have been affected by a number of measurement issues over the pandemic, which has injected volatility and made it harder to discern the underlying trend. Many prices were not collected during parts of the pandemic and others were affected by changes in VAT. The furlough scheme and the skew in employment outcomes among low-paying jobs introduced large compositional effects into wage data. Base effects have distorted growth rates, especially when the base occurred during a time of national lockdown. To try to mitigate these distortions, I will focus on the levels of prices and wages, and use Bank staff estimates of underlying wages, excluding compositional effects. I should note that these estimates are very uncertain, so there are limits to how confident we can be about how the data have been evolving.
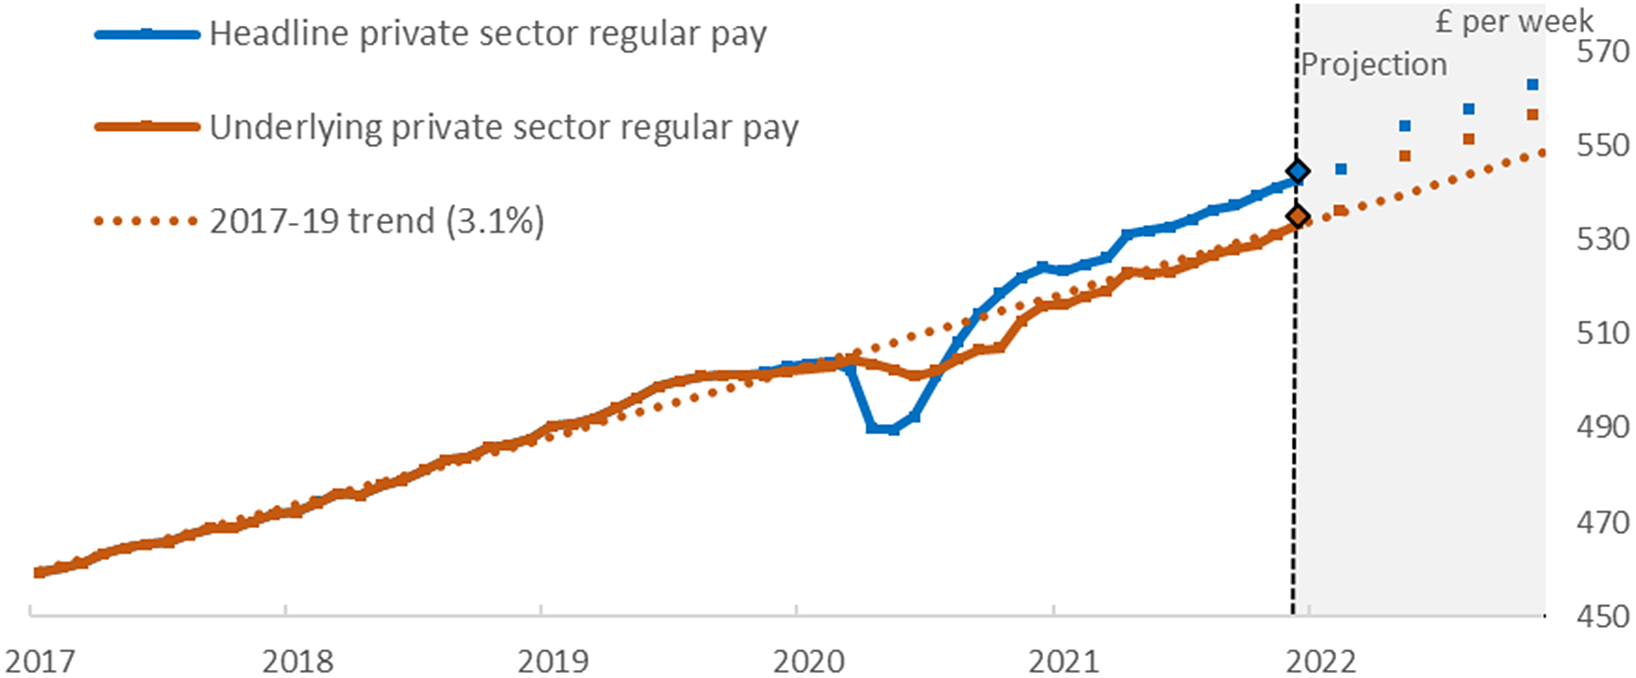
Caveats aside, my reading is that there is mixed evidence on the extent to which a tight labour market is feeding through to wage pressures so far. On the one hand, as best we can estimate it, the level of underlying private-sector wages has been growing broadly in line with its pre-COVID trend of 3.1 per cent, and has not yet started the near-term acceleration embodied in our February forecast (orange line, Chart 6). The level of headline pay is higher (blue line), as changes in the composition of employment have led to a greater proportion of workers in higher paid industries. There is lots of uncertainty about the size of these effects, but the same compositional effects should also be affecting productivity, all else equal. This implies that the uncertainty is relatively smaller for unit labour costs and inflationary pressure.Footnote 19
Headline and underlying private sector pay (excluding bonuses).
Sources: ONS and Bank calculations.
Notes: Blue line shows Private sector AWE excluding bonuses and arrears. Orange line shows Bank staff estimates of private sector regular pay adjusted for furlough and compositional effects. Data are monthly wage levels, projections show quarterly averages consistent with the February 2022 MPR forecast and diamonds show December outturns.

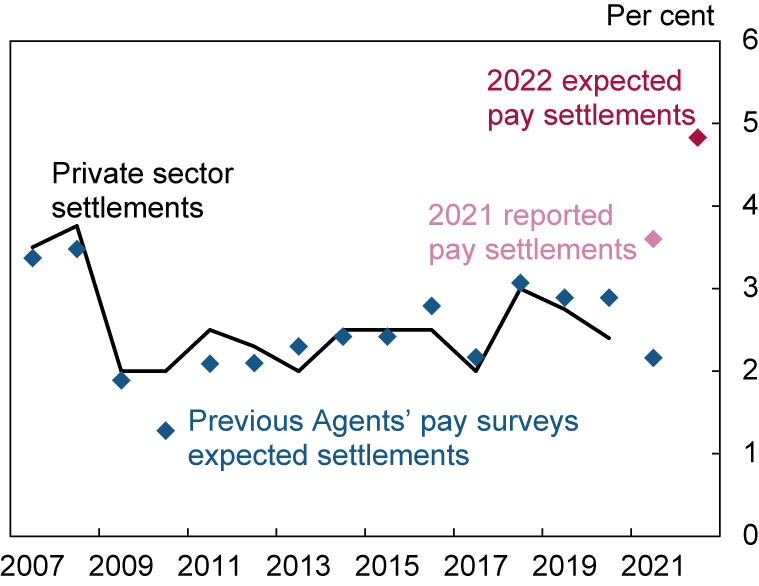
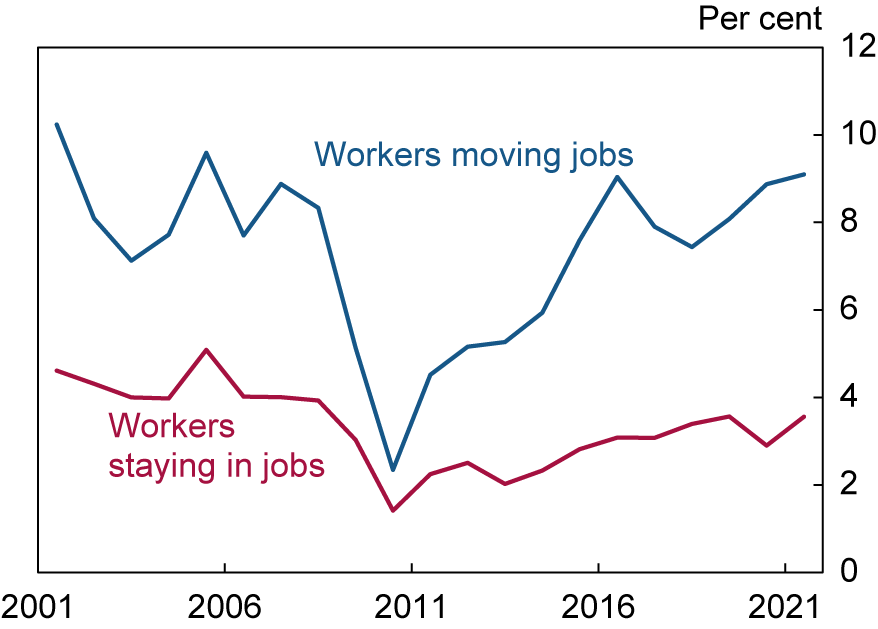
On the other hand, some forward-looking indicators are pointing to a sharp increase in wage pressures over 2022, some consistent with our forecast, and others presenting upside risks of a faster acceleration. In particular, the annual pay survey by the Bank of England’s Agents suggests that firms expect their annual pay settlements to reach 4.8 per cent in 2022, following an increase of 3.6 per cent in 2021 (Chart 7). If realised, that would imply wages moving above previous trends, consistent with the observed tightening in labour market quantities. Within those totals, separate ONS data suggests that wages for those workers switching jobs accelerated in 2021, which may lead companies to pay more to retain existing workers (Chart 8).
Pay settlements.
Source: Bank of England, including the wage settlements database (which draws on information from the Bank’s Agents, Incomes Data Research, Incomes Data Services, Industrial Relations Services and the Labour Research Department).
Notes: See notes to Chart 3.9 in the February 2022 MPR.

Median annual growth rates of pay.
Sources: ONS Annual Survey of Hours and Earnings and Bank calculations.
Notes: See notes to Chart 3.6 in the February 2022 MPR. Latest data point is for April 2021.

A critical question in determining domestic wage and price pressures will be whether workers and firms collectively all push for larger increases in their nominal wages and profits, in the face of a real-income squeeze.Footnote 20 One factor that could cause them to do so is if their inflation expectations have increased. The MPC monitors a range of different metrics of inflation expectations, as expectations often differ across firms, households and financial markets, each of whom are likely to play different roles in the transmission mechanism.Footnote 21 For example, financial market measures of inflation compensation have picked up in recent months, which may partly reflect an increase in expectations of inflation.Footnote 22 While unlikely to directly influence price or wage-setting decisions, these could affect the economy via the exchange rate, or serve as a lead indicator of inflation expectations of households and firms.
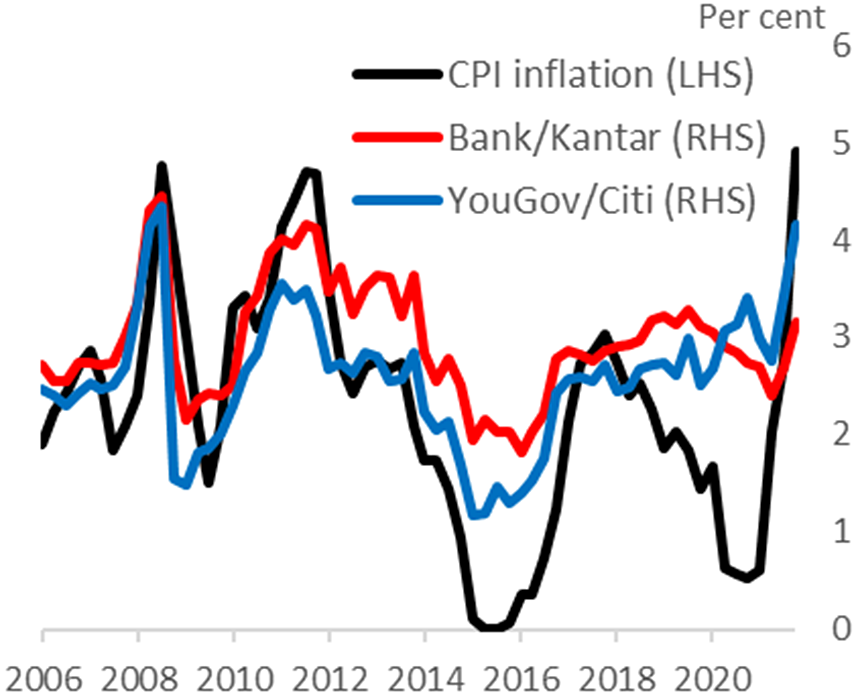
Shorter-term household inflation expectations have also increased, after falling at the beginning of the pandemic (Chart 9). But these tend to be closely correlated with observed movements in the actual inflation rate (and with food and energy prices in particular). In previous episodes of temporary energy-price inflation, they had also increased sharply, only to fall back as inflation subsided. The close correlation makes it very difficult to disentangle any independent influence of short-term inflation expectations from the effect of realised inflation on wages. For my part, I think a more backward-looking relationship between realised inflation and wage setting is more likely. Persistent movements in longer-term measures of expectations, which have so far been more stable, would be a more concerning sign to look out for.
One-year ahead household inflation expectations and CPI inflation.
Sources: Bank of England, Citigroup, Kantar, ONS, YouGov and Bank calculations.
Notes: The surveys ask about expected changes in prices but do not reference a specific price index. Summarised as a weighted median. YouGov/Citi data are quarterly averages. CPI inflation are quarterly averages of the 12-month inflation rate.

The extent to which we see any second-round effects from higher inflation feeding into domestic inflationary pressures will be an important determinant of how policy should balance the trade-off between inflation and output. If it occurs more than in the past, with real wages and profits adjusting less, this will insert more inherent persistence into inflation, and policy will need to be tighter to bring inflation back to target at an appropriate horizon. While real wages fell sharply following previous energy price increases in 2008 and 2011, those were both periods when unemployment was elevated, very different to today’s labour market. The exchange-rate depreciation following the 2016 EU referendum may therefore be a better comparator. On that occasion, despite a tight labour market, real wages fell in response. But inflation only increased to a peak of 3.1 per cent in 2017, so it is possible that a higher peak leads to greater second-round effects than we saw then.
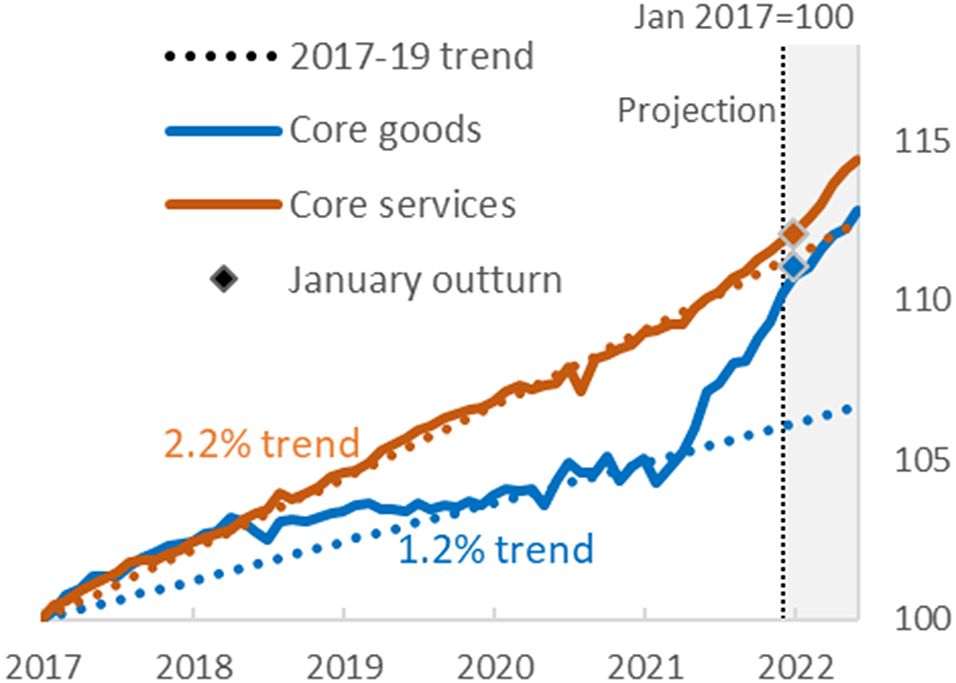
To complete the picture, I am also paying close attention to whether increases in non-labour input costs continue to be passed through, and how higher import and energy prices start to feed through into domestic pricing. In the face of large external shocks, it is useful to look at core services prices, which tend to give a clearer read on domestically generated inflation (DGI) and are more directly affected by domestic demand and by monetary policy. The measures shown in Chart 10 also attempt to strip out changes in the rate of VAT, which would otherwise distort the underlying trend. As with wages, so far, core services prices are running broadly in line with their pre-COVID trend, a period in which aggregate inflation averaged 2.1 per cent. This contrasts with the rapid increase in goods prices.
Core goods and core services price levels (seasonally adjusted).
Sources: ONS and Bank calculations.
Notes: Core services CPI excludes airfares, package holidays and education. Core goods CPI excludes energy, food, non-alcoholic beverages, alcoholic beverages and tobacco. Bank staff have adjusted for the estimated direct impact of changes in VAT and there is uncertainty around the precise impact of that adjustment. Projections show forecasts consistent with the February 2022 MPR. January outturns apply the January annual growth rate to the seasonally adjusted level from January 2021.

While we can draw some comfort from the relatively slower rates of domestically generated inflation, meeting our inflation target will depend on the whole inflation basket. COVID has led to a very large increase in the prices of goods and energy relative to wages and services. There have been further relative-price adjustments within these broad categories, with the price of rent increasing and package holidays falling within services, for example. How these relative price adjustments evolve matters for appropriate policy. If the relative price of goods were to continue increasing, policy would have to tighten to ensure that services inflation fell below its pre-COVID rate. In our February forecast, energy prices stabilise and supply bottlenecks unwind, consistent with some reversion of goods prices towards trend. In either scenario for relative prices, monetary policy will need to influence DGI in a way that ensures that it is consistent with aggregate inflation falling back to target.
In all, the data to the end of 2021 painted a picture of an economy with a tight underlying labour market and demand that was recovering towards trend. This had not yet fed through to domestically generated inflation, although standard transmission channels and more forward-looking indicators have suggested that it would over the course of 2022, in line with the MPC’s forecast. Looking ahead, we have to layer on top that we are now experiencing a very large terms-of-trade shock, which will increase headline inflation and drag on demand and the labour market.
4. Monetary policy outlook
By the end of last year, my view had been that some modest tightening in policy was likely to be required over our forecast period, to balance the trade-off between above-target inflation on the one hand, with demand running below its medium-term potential, on the other. With the labour market continuing to tighten, and risks associated with the end of the furlough scheme not materialising, downside risks to both demand and medium-term inflation had lessened, while upside risks to inflation from the persistent imbalance in the demand and supply of global goods had increased.Footnote 23
Looking ahead, further increases in energy costs and tradable goods prices are likely to imply somewhat greater persistence in inflationary pressures, particularly if they influence wage negotiations, or firms’ decisions on margins. The associated fall in real income is also likely to weigh on demand, independently of the policy stance. These developments will intensify the current policy trade-off in the near-term, although their effects should ultimately still prove temporary, conditional on inflation expectations remaining well-anchored, and on monetary policy tightening enough to prevent demand overshooting its medium-term potential.
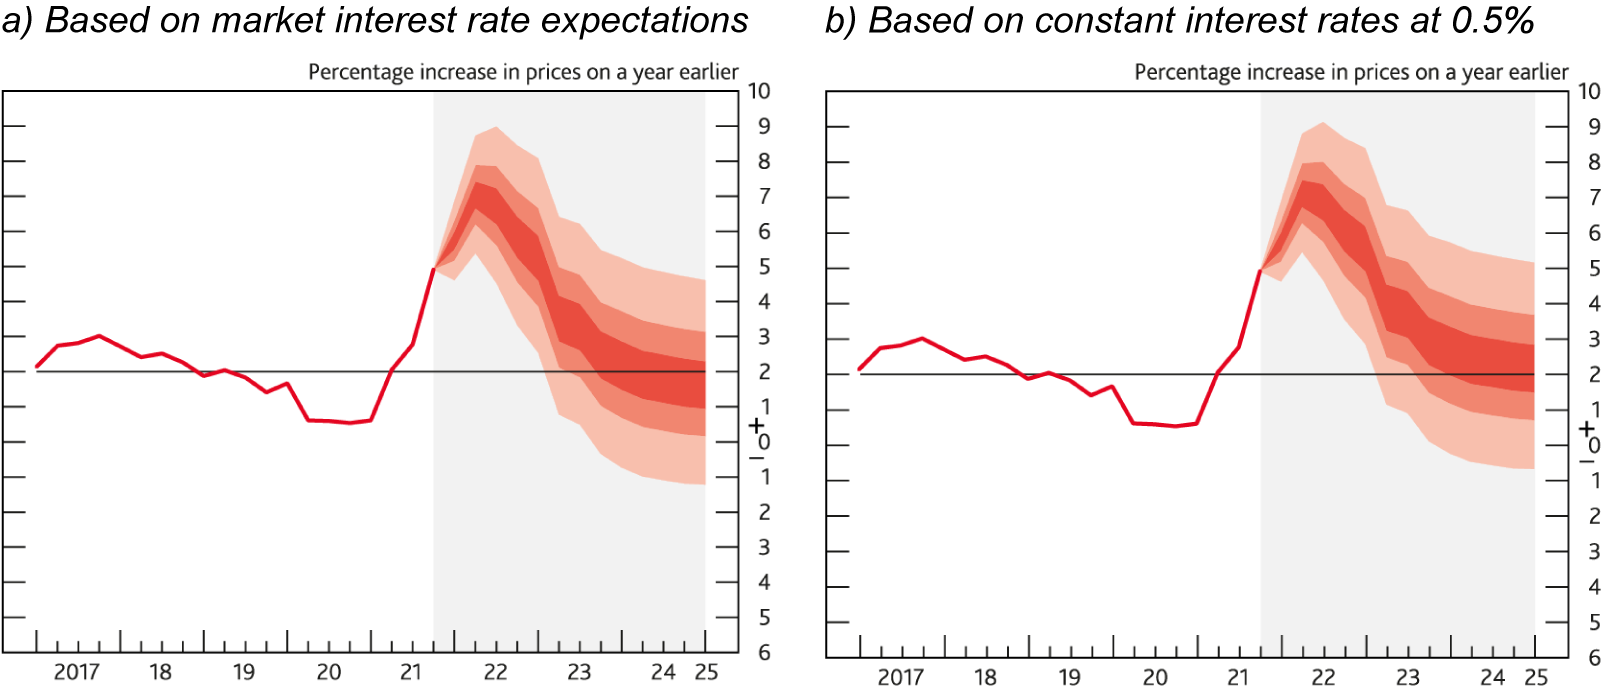
The exact scale of the tightening required is uncertain. Over the forecast period, it will depend on the short-run equilibrium rate of interest, r*.Footnote 24 As recently discussed by my colleague Huw Pill, the equilibrium rate is difficult to measure at the best of times.Footnote 25 The MPC forecast published in the February MPR suggests that conditional on the market curve at that time, which rose to 1.4 per cent, inflation would fall below target by the third year of the forecast; conditional on a constant rate of 0.5 per cent, inflation would remain slightly above target (Chart 11). In our central projections, a further modest tightening would therefore be consistent with inflation returning to target sustainably. Of course the forecast fan charts encompass a far wider range of possible outturns, to which we also have to add uncertainty over our conditioning assumptions for energy prices, the exchange rate and fiscal policy. Different MPC members will also each have their own individual views about the risks to the outlook.
February 2022 MPR inflation forecast.
Notes: See notes to Chart 1.7 in the February 2022 MPR. See notes to Chart 1.8 in the February 2022 MPR.

Another way of assessing what interest rate we might return to as the economy recovers is to compare it to the period just before the pandemic. At the start of 2020, Bank Rate stood at 0.75 per cent, with a fairly flat market curve. At that policy setting, inflation had been running at around, or slightly below, our 2 per cent target.
This metric would also suggest only a small amount of policy tightening will ultimately be required, reflecting the small share of the overall stimulus in the pandemic provided by monetary policy in the UK. Partly because of the nature of the COVID shock, fiscal policy was the main actor during the pandemic. The interest rate cut of 65 basis points was small relative to monetary policy stimulus in previous downturns, and even more so when adjusted for the scale of the shock. In my view, the size of the QE programme is unlikely to have much effect on the appropriate path for Bank Rate. In March 2020 asset purchases helped prevent market dysfunction that would have led to a tightening in financial conditions, rather than injecting significant additional policy stimulus. For me, later rounds of QE mainly had an insurance motive, with limited impact on yields, which were already very low. If carried out in a gradual and predictable manner, in line with the MPC’s guidance, I would expect QE unwind to have a similarly limited impact on the monetary stance.
The implied scale of tightening is also small relative to the uncertainty around how much will ultimately be required. While much of the economy should return to its pre-pandemic state as COVID subsides, there are also many differences with the situation in early 2020, which could require a greater or smaller tightening in policy. Fiscal policy has been highly supportive during the pandemic, but on current plans, this support will reverse over the next few years. This will leave the fiscal stance tighter than pre-pandemic, lowering the interest rate path consistent with inflation at target. Acting in the other direction, a stronger housing market and a greater stock of household savings than we had before the pandemic may encourage greater spending, pushing up on the required policy rate. Brexit uncertainty is less likely to be dragging on demand relative to supply, although COVID uncertainty may now be doing so in its place, while Brexit itself is likely to be having a greater impact on the supply side of the economy directly.
5. Recent policy votes
From a starting point that some modest tightening was likely to be required, my recent policy votes have hinged on the optimal timing of that tightening. In December, my overriding concern was the uncertainty that had been introduced by the arrival of the Omicron variant. There were a wide range of plausible health outcomes, which in turn would have led to a wide range of economic effects. It was clear that the variant would slow activity, given additional social distancing, but unclear what the scale of the effect would be or the impact it would have on inflation, which would depend on the health outcomes, government responses, and associated impacts on demand relative to supply, at home and abroad. Crucially, the uncertainty around the new variant was likely to be mostly resolved in a matter of weeks, so I saw little cost in waiting for more information before deciding whether to adjust policy.Footnote 26
Subsequently, the properties of the variant and the behavioural responses to it have meant that the economic effects of Omicron were at the benign end of the scenarios that were possible in December. In particular, the rapid speed of the wave, alongside lower perceptions of individual risk from the virus (given vaccinations, boosters, and the intrinsic severity of the variant), appear to have led to effects on aggregate consumption that have been both small and of short duration, relative to previous waves.
With Omicron effects fading, the key question for me was whether the policy tightening should be front-loaded, or deferred until the recovery had progressed further. At an earlier stage in the pandemic, with output and employment well below their medium-term potential, and a large part of the inflation overshoot down to the direct impact of energy prices, which policy was unable to affect, I had felt that deferring any tightening achieved an appropriate balance. The possibility of becoming constrained by a lower bound on interest rates (even if at a negative rate), in the event of further negative shocks, added to the risks of tightening too early. A faster recovery, assisted by lower interest rates, would also help limit the scale of any scarring effects from the pandemic.
By February, I felt that the outlook and the risks had shifted in favour of a more front-loaded tightening and voted for a rise in Bank Rate to 0.5 per cent. The furlough scheme had ended without any rise in unemployment, suggesting that policy had helped mitigate one source of scarring from hysteresis in the labour market. While participation and employment remain below their pre-COVID levels, the labour market continues to tighten. And with the inflation pick-up from higher tradeable goods price inflation now set to be larger and likely more persistent than previously expected, I thought an earlier tightening would strike a better balance between inflation and output volatility. The impact of the February rise in Bank Rate is more likely to have its peak impact when inflation is still above target than if we had waited too much longer, given our forecast for external inflationary pressures to subside.
To conclude, whatever risks materialise, my policy decisions will seek to manage any temporary trade-offs that arise between inflation and the volatility of output, in line with our remit, subject to bringing inflation back sustainably to target in the medium term.
Acknowledgements
I would like to thank Michael McLeay and Lukas von dem Berge for their help producing this speech. I am also grateful to Andrew Bailey, Alan Castle, Ambrogio Cesa-Bianchi, Jenny Chan, Harvey Daniell, Kieran Dent, Andrew Hauser, Olga Maizels, Catherine Mann, Ed Millar, Huw Pill, Andrea Rosen, Tuli Saha, Michael Saunders and Martin Seneca for input and comments. The views are my own and do not necessarily represent those of the Bank of England or its committees.