Implications
Changes in dairy cows’ behaviour and production due to claw diseases are often associated with lameness as a clinical sign, but there are claw diseases which do not always cause lameness in animals. Therefore, it was our aim to investigate whether two specified claw diseases influence dairy cows’ behaviour and productivity. A criterion for the selection of animals for this study was based on clinical diagnosis of either of the investigated claw diseases. The study shows that one claw disease had more effect on dairy cows’ behaviour and production. This shows the importance of checking and trimming claws of the cows regularly in order to minimise the influence of claw diseases on milking cows’ behaviour, health and milk yield, thus improving their welfare and performance.
Introduction
Claw diseases are an increasingly important welfare problem in dairy production because of the increase in the incidence of lameness (Whay et al., Reference Whay, Main, Green and Webster2003). The affected cows show symptoms of pain and frustration, especially when performing normal locomotive behaviours (Whay et al., Reference Whay, Waterman, Webster and O'Brien1998; Rushen et al., Reference Rushen, Pombourcq and de Passillé2007). Claw diseases are also of concern to the farmers because of their economic consequences. Claw diseases have been found to cause reduced milk yield, decreased reproductive performance and an increased risk of culling (Sprecher et al., Reference Sprecher, Hostetler and Kaneene1997; Rajala-Schultz et al., Reference Rajala-Schultz, Gröhn and McCulloch1999). Advanced stages of claw disease cause lameness (Murray et al., Reference Murray, Downham, Clarkson, Faull, Hughes, Manson, Merritt, Russell, Sutherst and Ward1996), but during the development of claw diseases, behavioural signs may be more subtle. The mean annual prevalence of lameness has been reported with a wide range, from about 13.7% to more than 50% (Wells et al., Reference Wells, Trent, Marsh and Robinson1993; Clarkson et al., Reference Clarkson, Downham, Faull, Huges, Manson, Merritt, Murray, Russell, Sutherst and Ward1996; Warnick et al., Reference Warnick, Janssen, Guard and Gröhn2001; Rutherford et al., Reference Rutherford, Langford, Jack, Sherwood, Lawrence and Haskell2009). It has been found that the most common claw problems, which cause lameness were sole ulcer (SU), white line lesions and digital dermatitis (DD), with a prevalence of 28%, 22% and 8%, respectively (Murray et al., Reference Murray, Downham, Clarkson, Faull, Hughes, Manson, Merritt, Russell, Sutherst and Ward1996). The annual animal health report from the Swedish Dairy association recalls that about 6% of the regularly trimmed cows had SU and about 10% had dermatitis, of which 2% was DD (Svensk Mjölk, 2009).
SU (Pododermatitis circumscripta) was first described by Rusterholz (Reference Rusterholz1920). He associated the lesion with an exostosis of the posterior part of the pedal bone (distal phalanx, P3). Many authors have proposed that there is a close relationship between SU and laminitis (e.g. Nilsson, Reference Nilsson1963; Peterse, Reference Peterse1979; Bergsten, Reference Bergsten1995). SU is a continuous opening in the sole horn that exposes the corium, which is a painful and lameness-causing problem for the cow (Whay et al., Reference Whay, Waterman, Webster and O'Brien1998; Flower et al., Reference Flower, Sanderson and Weary2005; Blackie, Reference Blackie2009). The typical site for SU is in the central, posterior part of the claw sole, which corresponds to the flexor process of the pedal bone (Greenough, Reference Greenough2007). The lateral hind claws are generally the most commonly affected (Greenough, Reference Greenough2007).
DD (Dermatitis digitalis, Mortellaro disease) was first described by Cheli and Mortellaro (Reference Cheli and Mortellaro1974) in Italy, and has now become one of the most common causes of lameness across Europe and North America (Somers et al., Reference Somers, Frankena, Noordhuizen-Stassen and Metz2003; Bicalho et al., Reference Bicalho, Cheong, Cramer and Guard2007; Cramer et al., Reference Cramer, Lissemore, Guard, Leslie and Kelton2008). DD is a contagious disease most likely caused by micro-organisms of the genus Treponema (Pringle et al., Reference Pringle, Backhans, Otman, Sjölund and Fellström2009). The most obvious clinical signs are lameness, lifting of the foot and walking on the tip of the toe (Blowey and Sharp, Reference Blowey and Sharp1988; Bassett et al., Reference Bassett, Monaghan, Lenhan, Doherty and Carter1990). Furthermore, when the foot is investigated, painful bleeding from the erosive or proliferative dermatitis of the digital or interdigital skin can be seen. This dermatitis is usually located between the heel bulbs of the plantar aspect of the foot and can also reach the skin of the coronary margin.
Dairy cows with SU or DD have not been studied before with regard to changes in their behaviour. However, lame cows have been found to lie longer (Galindo and Broom, Reference Galindo and Broom2002; Walker et al., Reference Walker, Smith, Routly, Jones, Morris and Dobson2008; Blackie, Reference Blackie2009) and spend more time lying outside the cubicles and less time eating than non-lame cows (Galindo and Broom, Reference Galindo and Broom2002). Hassall et al. (Reference Hassall, Ward and Murray1993) found that lame cows on pasture entered the milking parlour later, were more restless during milking and ruminated significantly more when lying than when standing compared with healthy herd mates. Thus, it was of interest to investigate lying, standing, eating and how much cows ruminate while lying and standing when they have been diagnosed for SU and DD in this study.
Milk yield has been found to decrease after identification of lameness (Warnick et al., Reference Warnick, Janssen, Guard and Gröhn2001; Green et al., Reference Green, Hedges, Schukken, Blowey and Packington2002) and the decrease was more severe in older cows and in cows with more severe lameness (Warnick et al., Reference Warnick, Janssen, Guard and Gröhn2001). Amory et al. (Reference Amory, Baker, Wright, Mason, Blowey and Green2008) have found that cows with SU were higher yielding before they were diagnosed, and their production decreased to the mean level of unaffected cows’ production level and remained at the decreased level after diagnoses. They also found that cows with DD had no significant decrease in production before being diagnosed, but they produced more milk a month after they were treated. The major management risk factors for SU and DD are suggested to be related to diet and feeding (Cook et al., Reference Cook, Nordlund and Oetzel2004a), concrete floors, poor claw trimming exposure of the claw horn to slurry and wet conditions (Wells et al., Reference Wells, Garber and Wagner1999), inadequate use of footbaths (European Food Safety Authority, 2009), and the introduction of possibly infected animals to the herd (Wells et al., Reference Wells, Garber and Wagner1999).
Early detection of disease implies improved possibility of successful treatment, less suffering and less economic loss. Although several studies of both DD and SU have been published in recent years, no studies seem to have been performed regarding their impact on cow behaviour in combination with their possible impact on milk production.
Therefore, the aim of this study was to investigate associations of DD and SU with behaviour and milk production in lactating dairy cows. It was predicted that cows with DD and SU would lie more, eat less, ruminate less, explore less and show less vigilance, and in accordance with this we predicted that they would produce less milk.
Material and methods
Animals and management
The study was performed from January to April 2006 on a 300-cow dairy herd. Milking cows, mostly in their first and second lactation, were divided into five milking groups. This was an embryo transfer nucleus herd, which was established by recruiting heifers from high-performing Swedish Red and Swedish Holsteins, from contracted farms that were members of the national milk recording scheme.
The cows were kept in a cubicle system with mastic asphalt alleys scraped six times daily. Two layered rubber-foam mattresses (Kraiburg Soft Bed System®, Tittmoning/Mayerhofen, Germany) were used in the cubicles and a thin layer of sawdust was used as bedding. Cows were fed ad libitum twice a day with a total mixed ration that consisted of approximately 52% silage, 21% dried sugar beet pulp, 26% concentrates (special solid F20 Viken food: corn pellets, rape cake, mashed barley, ‘Mingla 39’ protein mix) and 1% of straw. They had ad libitum access to water in two large water troughs for each milking group. They were milked three times daily (at 500, 1300 and 2100 h) in a rotary milking system with 32 places (TURN-STYLES® HBR, DeLaval, Tumba, Sweden). The cows were trimmed three times yearly by a professional claw trimmer.
The first case of DD in this herd was diagnosed in December 2004. In January 2006, when the claws of all lactating cows were examined and trimmed, the average prevalence of DD and SU was 17% and 13%, respectively (Bergsten et al., Reference Bergsten, Hultgren and Hillström2006). During this study, a controlled footbath study was also performed on the same herd (Bergsten et al., Reference Bergsten, Hultgren and Hillström2006). In that study, the feet on the left side of the cow were treated in a walk-through footbath twice daily after milking with a solution containing peracetic acid, copper sulphate, glutaraldehyde and ammonium chloride in a total concentration of 5% (Footbath solution 500®, DeLaval). The feet on the right side of the cow were treated at the same time with water as a control in the walk-through footbath. Cows with SUs at trimming were treated with trimming, for example, removal of the damaged claw horn until good drainage of the ulcer was achieved. The wounds were covered with a light protective bandage. If the wound was very severe, the opposite claw was sometimes equipped with a shoe (‘cowslip’) to let the damaged claw heal without bearing weight from the cow. No cows having such a severe SU problem were involved in my study. Treatment of SUs by trimming usually has a very good effect on healing. Owing to animal welfare considerations, it would have been impossible not to treat them. Cows with DD were not treated with tetracycline at trimming on this farm. Cows participating in this study were only treated for SU with trimming at the claw trimming process and cows with DD only with the footbath that did not seem to affect the DD (Bergsten et al., Reference Bergsten, Hultgren and Hillström2006). No other medical treatment was used for the cows participating in this study.
Experimental design and claw assessment
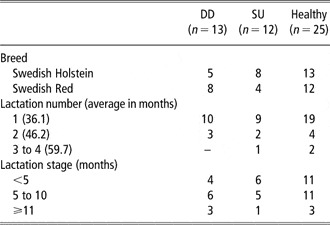
A clinical claw examination of all cows in the herd was made by the same person at claw trimming, 2 weeks before the behavioural observations began. Scoring was made in the following way: SU score 1 – open connection to the corium with fresh tissue visible of one foot; score 2 – open connection to the corium with damaged, discoloured tissue protruding as a granulation and/or undermining of the sole of one foot. DD score 1 – inflammation of the digital and/or interdigital skin with slight exudation or crusts on one foot; score 2 – inflammation of the digital and/or interdigital skin with a circumscribed, open, bleeding ulceration and painful when foot palpated. Ten cows affected with each disorder were selected from two high-yielding lactation groups (DD score 1 – 1 cow, score 2 – 12 cows; SU score 1 – 4 cows, score 2 – 8 cows). For each affected cow, a paired healthy control cow of the same breed, age, parity and lactation stage was selected from within the same high-yielding milking group. From each of the two groups, five cows were selected to the DD-affected group, and five to the SU-affected group, to form focal cows as a control group. The selection criteria were as follows: the cows had developed no claw lesions, had no other health problems and had calved at least a month prior to the study. After the first observation period (2 to 3 weeks after claw trimming; WACT), 10 cows were removed from the study due to the following reasons: having dried off (one cow), moved to another study (seven), culling (one) and death (one). Excluded animals were replaced by other cows following the previous selection principles. In total, 13 DD-affected, 12 SU-affected and 25 healthy cows were used during the course of the study. The distribution of cows according to the breed, age, lactation number and stage is given in Table 1.
The distribution of cows with DD, SU and healthy according to the breed, age, lactation number and stage

DD = digital dermatitis; SU = sole ulcer.
Behavioural observations
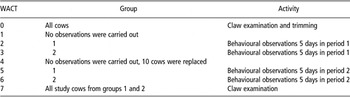
Behavioural observations on paired cows (DD- or SU-affected cow paired with a healthy cow) in both high-yielding groups were carried out over two observation periods, each of 2 weeks’ duration (Table 2). The first period was carried out 2 to 3 WACT and the second period 5 to 6 WACT. As it was important to be able to observe all animals without interruption, observations were made from 800 to 1230 between two milking sessions. There was a 30 min break after the first 2 h of observations. Two pairs of cows were observed per day: one pair consisted of a DD-affected cow and a healthy cow and the other pair of an SU-affected cow and a healthy cow. The behavioural observations of these four cows were performed during 1 day alternately for 10 min for each cow so that each cow was observed for 6 × 10 min a day, resulting in 60 min of observations per individual cow per period. This was done to eliminate the influence of time of day on behaviour. Different behaviours were recorded as absent or present with a 0 to 1 sampling method (Martin and Bateson, Reference Martin and Bateson1993) within each minute of observation. In this way, all 20 pairs (40 cows) were observed over 10 observation days per period.
Schedule of claw investigations and behavioural observations on dairy cows with DD or SU and paired healthy controls kept in group 1 or 2 at the different WACT

DD = digital dermatitis; SU = sole ulcer; WACT = weeks after claw trimming.
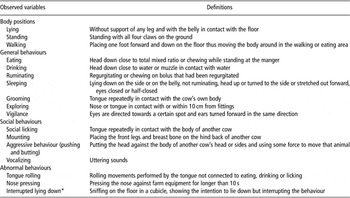
In both observation periods, the sequence of pairs observed was selected randomly. Healthy cows were always observed before the cows were affected by DD or SU. All the behavioural observations were made by one observer who was trained by an experienced ethologist. The observer followed the focal cow from outside the cubicle housing and the distance from the observer to the observed cow was approximately 5 to 7 m. Three body positions, seven general behaviours, four social behaviours and three abnormal behaviours were recorded (Table 3). In addition, whether the cow was a sender or a receiver of social licking and aggressive behaviour (pushing and butting) was recorded. The body area where social licking was performed was not recorded.
Body positions and behaviours recorded during direct observations, and their definitions

WACT = weeks after claw trimming.
*Only recorded during 5 to 6 WACT.
Milk production and milk composition
Milk yields in kg energy-corrected milk (ECM), milk fat (%), milk protein (%) and somatic cell count (SCC, number of cells × 10 000) were recorded during the three milkings on one day per study period. It was based on control milking results from the test day closest to the observation period and taken from the Swedish milk recording scheme.
Lameness recording
Lameness was scored once during the daytime on each focal cow while she was freely moving around in her group. This was done by a single assessor person before the beginning of the first period of behavioural observations. A modified scale based on Sprecher et al. (Reference Sprecher, Hostetler and Kaneene1997) was used for lameness scoring where cows with normal walk, no arched back and normal standing were scored 0; cows with normal walk but shorter steps, arched back, changed feet or rose one foot when standing were scored 1; and cows with arched back while walking and standing, difficulties in walking, asymmetric gait or difficulties while standing were scored 2.
Claw health was not controlled between 2 to 3 and 5 to 6 WACT, but if they had developed disease with lameness, we would have treated them for that disease. However, none of the observed cows became lame during those 7 weeks.
At the claw examination seven WACT (see Table 2), three previously healthy cows had developed DD and one cow had developed SU, whereas the four previously SU-affected cows had recovered from SU but had developed DD instead. Moreover, two DD-affected cows had recovered completely, but the remaining eight DD cows and six SU cows were still diseased as earlier.
Statistical analysis
The statistical analyses were performed with software package SAS version 9.1 (Statistical Analyses System Inc., Cary, USA). The behaviour data were analysed with the logit-linked generalised linear models (PROC GLIMMIX) to test the effects of claw health status (DD, SU or healthy), WACT (2 to 3 or 5 to 6) and claw health status × WACT interaction (six levels). The random effect of the cows’ pair (triple in case of replaced cows) was considered to take into account the confounding effects of breed, parity and lactation stage. In addition, the first-order autoregressive covariance structure was assumed across the repeated measures nested to the combined categories of period (2 to 3 or 5 to 6 WACT), cow and 10 min observational period. Initially, the models with the observations’ day effect within the 2 to 3 or 5 to 6 WACT were also fitted, but as there were no significant differences in behaviours between days, the day effect was omitted from the final models. To compare the DD- and SU-affected cows with the healthy cows, odds ratios with 95% confidence intervals were calculated. Also, least square means on the inverse linked scale (on the scale of the mean) were evaluated to better illustrate the differences between claw health groups and 2 to 3 or 5 to 6 WACT. In addition to the variables presented in Table 3, two parameters, namely standing and ruminating, were later merged into a single behaviour ‘ruminating while standing’. The control milking data were analysed with general linear models (PROC MIXED), except for SCCs, where the log-linked generalised linear model (PROC GLIMMIX) was applied. The random effect of cows’ pair (tripled in the case of replaced cows) was considered to take into account the confounding effects of breed, parity and lactation stage. Also, the first-order autoregressive covariance structure was assumed across the repeated control milkings of the same cow. The milking group had no significant effect on the variables analysed and was omitted from the models. Fisher's exact test was used to compare the number of healthy cows with DD- and SU-affected cows with regard to lameness. Owing to the small number of recorded social behaviours, only descriptive statistics were used to analyse the data. Significance was considered at P < 0.05 and showed a tendency when P < 0.1. The results with P ⩾ 0.1 were considered to be not significant (ns). In addition, the significance level was corrected for multiple testing using the Bonferroni method considering the comparisons of behaviour, milk production and lameness data as different experiments.
Additional statistical analyses were performed to compare continually healthy cows with those newly infected and continually infected cows with recovered cows; no statistically significant differences were found.
Results
Body position
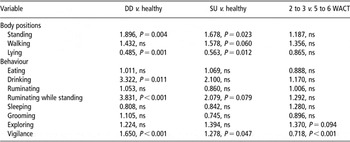
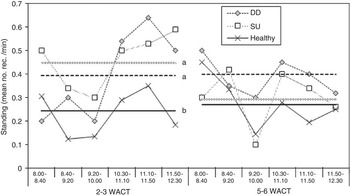
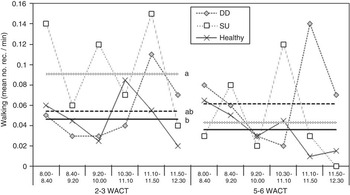
SU- and DD-affected cows had a higher number of recordings of standing (Table 4, Figure 1), and SU-affected cows tended to have a higher number of recordings of walking (Table 4, Figure 2) than did healthy cows during 2 to 3 WACT. However, during 5 to 6 WACT, there were no differences in standing or walking between healthy and claw health-affected cows (Figures 1 and 2). The claw health status was also associated with lying, such that DD- and SU-affected cows had a lower number of recordings of lying than healthy cows (Table 4). After Bonferroni correction, only the difference between DD-affected and healthy cows in lying remained significant.
Adjusted odds ratios of behavioural observations, evaluated applying the model where the effect of health status, WACT, matched pairs and repeated measurements of the same cow were taken into account

WACT = weeks after claw trimming; DD = digital dermatitis; SU = sole ulcer.
DD: n = 10; SU: n = 10; healthy: n = 20.
Model-based least square means of the number of recordings of standing by disease groups and WACT (straight lines), and arithmetic means by disease groups and observation times within the WACT (broken lines). Least square means within 2 to 3 and 5 to 6 WACT with different letters (a, b) are significantly different (P < 0.05). DD = digital dermatitis (n = 10), SU = sole ulcer (n = 10) and healthy (n = 20).

Model-based least square means of the number of recordings of walking by disease groups and WACT (straight lines), and arithmetic means by disease groups and observation times within the WACT (broken lines). Least square means within 2 to 3 and 5 to 6 WACT with different letters (a, b) are significantly different (P < 0.05). DD = digital dermatitis (n = 10), SU = sole ulcer (n = 10) and healthy (n = 20).

General behaviour
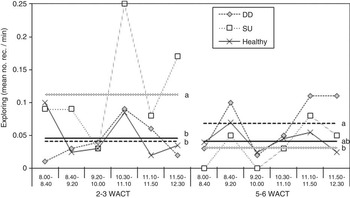
DD-affected cows had a higher number of recordings of ruminating while standing than healthy cows, and SU-affected cows had the same tendency (Table 4). There were no differences between DD- and SU-affected cows and healthy controls in the number of recordings of exploration, but there was a significant difference between 2 to 3 and 5 to 6 WACT (Table 4). However, when considering the interaction between claw health status and WACT (P = 0.0004), SU-affected cows had a higher number of explorations during 2 to 3 WACT, whereas DD-affected cows were recorded to explore more than healthy cows during 5 to 6 WACT (Figure 3). After Bonferroni correction, only the difference in ruminating while standing between DD-affected and healthy cows remained significant.
Model-based least square means of the number of recordings of exploring by disease groups and WACT (straight lines), and arithmetic means by disease groups and observation times within the WACT (broken lines). Least square means within 2 to 3 and 5 to 6 WACT with different letters (a, b) are significantly different (P < 0.05). DD = digital dermatitis (n = 10), SU = sole ulcer (n = 10) and healthy (n = 20).

DD-affected cows and SU-affected cows had a higher number of recordings of vigilance than healthy cows (Table 4). During 2 to 3 WACT, the cows had a lower number of recordings of vigilance than during 5 to 6 WACT (Table 4). When considering the interaction between claw health status and WACT, no statistical significance was found. DD-affected cows had a higher number of recordings of drinking than healthy cows, but there was no difference between SU-affected cows and healthy cows in this behaviour (Table 4). After Bonferroni correction, only the differences in vigilance between DD-affected and healthy cows and between 2 to 3 and 5 to 6 WACT remained significant. The cows with DD and SU did not differ from the healthy cows in the number of recordings of grooming, sleeping or eating (Table 4).
Social and abnormal behaviour
The most common social behaviour was pushing and butting, which the focal cows performed on 1.26 occasions/cow per h and received on 0.65 occasions/cow per h. Social licking was performed 0.4 and received 0.44 times/cow per h. There were no recordings of mounting. Vocalisation was recorded 0.2 times/cow per h. There were 0.075 recordings of tongue rolling and 0.6 recordings of nose pressing/cow per h. It was noted that during 2 to 3 WACT, some cows showed interrupted lying down behaviour. During 5 to 6 WACT, 0.15 recordings of interrupted lying down were recorded.
Milk yield
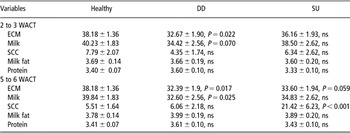
DD-affected cows produced less ECM than healthy cows during 2 to 3 and 5 to 6 WACT, whereas SU-affected cows tended to produce less ECM only during 5 to 6 WACT (Table 5). DD-affected cows had lower milk production than healthy cows during 5 to 6 WACT and a similar tendency during 2 to 3 WACT (Table 5). SU-affected cows had significantly higher SCC than healthy cows during 5 to 6 WACT (Table 5). There was one SU-affected cow that had very high SCC (155 × 104) during those WACT, which had a strong effect on the group scores. Leaving this cow out from the analyses resulted in no significant difference between SU-affected and healthy cows. There were no differences between DD- or SU-affected cows and their healthy controls in the percentages of fat or protein in the milk (Table 5). After Bonferroni correction, none of the milk production parameters were statistically different between DD- or SU-affected cows compared with healthy cows.
Least squares means (±s.e.) of kg ECM, milk, SCC (number of cells ×104), milk fat (%) and protein (%) in dairy cows with DD or SU compared with healthy controls (healthy) during 2 to 3 and 5 to 6 WACT, evaluated following the model considering effects of health status, WACT, similar cow pairs and repeated measurements of the same cow (DD, n = 10; SU, n = 10; healthy, n = 20)

ECM = energy corrected milk; SCC = somatic cell count; DD = digital dermatitis; SU = sole ulcer; WACT = weeks after claw trimming.
Lameness
Results from the lameness scoring showed that 12% of the healthy cows were lame (score 2), whereas 41.7% SU-affected (P = 0.083) and 30.8% DD-affected (ns) cows had a lameness score of 2. No significant differences were found between healthy and DD- and SU-affected cows with regard to a lameness score of 1.
Discussion
Body position and general behaviour
In this study, the cows with DD and SU were lying less, whereas standing, walking, ruminating while standing and vigilance were recorded more often in DD- and SU-affected cows than in healthy control cows, especially during 2 to 3 WACT. This is in agreement with the study of Cook et al. (Reference Cook, Bennett and Nordlund2004b) where lame cows stood for longer in their cubicles and were lying less compared with healthy cows. In contrast, Hassall et al. (Reference Hassall, Ward and Murray1993) showed that lame cows on pasture lay down and ruminated for longer periods than healthy cows. Furthermore, Blackie (Reference Blackie2009) found that zero-grazed lame cows lay down for longer, and Walker et al. (Reference Walker, Smith, Routly, Jones, Morris and Dobson2008) found that lame cows stood while ruminating less than healthy cows, which was the opposite of our findings. In this study, less than half of the DD- or SU-affected cows showed lameness, whereas in Blackie's (Reference Blackie2009) study they had been chronically lame for at least 3 months. Cows may respond differently to lameness on pasture compared with indoors, particularly if cows are housed in cubicles, and especially when cubicles are less comfortable. Cook et al. (Reference Cook, Bennett and Nordlund2004b) found that cows with sand bedding stood less than did cows on mattresses, suggesting that sand is a more comfortable material. Even if there are enough cubicles for each cow, a diseased cow which has lost her rank order in the herd (Beilharz and Zeeb, Reference Beilharz and Zeeb1982) may have to struggle to find a free cubicle, whereas on pasture the space is less restricted and it is more likely that a cow can lie down when she needs to. Thus, if the effort to find a lying place costs too much, the result may be that a lame cow will be standing for longer and thus she will also be more likely to stand when ruminating. In the study of Cook et al. (Reference Cook, Bennett and Nordlund2004b), cows were overstocked, which could have contributed to his results, and Blackie (Reference Blackie2009) observed that lame cows were more active and stood more between 1200 and 1500 h compared with the healthy ones. Thus, different results between studies (Hassall et al., Reference Hassall, Ward and Murray1993; Galindo and Broom, Reference Galindo and Broom2002; Walker et al., Reference Walker, Smith, Routly, Jones, Morris and Dobson2008; Blackie, Reference Blackie2009) may be caused by differences in how the cows were housed, especially with regard to access to comfortable cubicles, as well as when and how often observations were made. In this study, the observations lasted for 4 h/day between the morning and afternoon milking when the cows were, in general, active. It may still be possible that cows with DD and SU lie down more during the evening and night-time when they were not observed. For future studies, it would therefore be better to observe cows throughout the 24 h periods. Differences between periods could also be explained by the replacement of some cows after the first observation period, but considering the principle of the replacement (described earlier), we are quite confident that population differences have had no systematic effect on the results.
Haley et al. (Reference Haley, de Passillé and Rushen2001) and Cook et al. (Reference Cook, Bennett and Nordlund2004b) found that a lack of comfort may result in reduced time spent lying, and a subsequent increase in time spent standing without eating. Haley et al. (Reference Haley, de Passillé and Rushen2001) also reported that a lower frequency of standing and lying and an increase in the duration of lying bouts suggests that cows on less comfortable flooring had difficulties in standing up and lying down. Our results indicate that cows with claw diseases may have had difficulties in lying down, as they stood and walked around significantly more than healthy cows. In this study, the cows had two-layered rubber-foam mattresses with a thin layer of sawdust on top. These mattresses were supposed to give the cows a soft lying surface, but it might be that the lying down and getting up behaviour was still difficult for the cows with DD or SU. The dimensions and design of the cubicles could also have influenced cows that already had problems in lying down and getting up. Resting behaviour and lying are highly motivated behaviours for dairy cows and lying time has higher priority than eating time and social contacts (Munksgaard et al., Reference Munksgaard, Jensen, Pedersen, Hansen and Matthews2005). Deprivation of lying down increases the time spent in eating, standing with and without ruminating and behavioural signs of discomfort (Cooper et al., Reference Cooper, Arney and Phillips2007). However, in this study, no reductions in eating or social interactions were found.
In this study, cows with claw problems explored farm equipment and/or the ground numerically more than healthy cows, but SU-affected cows did it more at 2 to 3 WACT and DD-affected cows more at 5 to 6 WACT. Cows usually sniff at the ground before they start a lying down movement, and this is the first step in a seven-step process that the cow goes through before she is lying in a comfortable position (Schnitzer, Reference Schnitzer1971; Lidfors, Reference Lidfors1989). If cows have problems in finding a suitable lying place or problems with lying down, this first exploratory process can take a longer time and it can also be interrupted (Lidfors, Reference Lidfors1989). Ladevig and Borell (Reference Ladevig and Borell1988) found that tied dairy cows explored the ground up to an hour before they started to lie down, presumably due to the problems they had in lying down. In this study, cows with DD and SU were lying less than healthy cows, which may suggest that they prepared themselves for lying down by sniffing the ground and stall equipment but that lying down was interrupted for some reason. As the observation time was so short for each cow and there were so few interrupted lying down movements recorded in this study, we do not know if the higher number of explorations in this study was associated with more problems in lying down in the claw diseased cows. However, this area needs more attention in future studies.
Social and abnormal behaviour
In this study, social behaviour was performed infrequently, by only a few cows, and thus no meaningful statistical analysis could be carried out. However, it has been found (Galindo and Broom, Reference Galindo and Broom2002) that lame cows were less likely to start an aggressive interaction, and that they were licked more often by the other cows. This suggested that the results could be caused by the cows trying to reduce the discomfort of the injuries or trying to maintain stable relationships with other herd members.
Head/nose pressing has been suggested to be a way for the cow to redirect pain from a body part with pain to the nose, thus releasing endorphins (Broom and Fraser, Reference Broom and Fraser2007). Snider et al. (Reference Snider, Hoyt, Coats, Graves, Cooper, Storts, Luther and Jenny2003) found that nose pressing was performed more in cows that had encephalitis caused by lentivirus. It was therefore expected that cows affected with DD or SU would also show more head/nose pressings as a response to pain caused by the claw disease. However, there were only a few nose pressings in this study and no differences were observed between cows affected with DD and SU compared with healthy cows. However, the observation period per cow was quite short and nose pressing may have been performed at other times of the day.
Milk yield
According to our results, DD-affected cows produced less ECM and SU-affected cows had a tendency to produce less ECM during the 5th and 6th WACT than healthy cows. These results agree with the study of Green et al. (Reference Green, Hedges, Schukken, Blowey and Packington2002) where the most frequent lameness-causing claw diseases such as SU, white line disease, interdigital necrobacillosis and DD were associated with reduced milk yield. Warnick et al. (Reference Warnick, Janssen, Guard and Gröhn2001) also showed that lame cows produced less milk (up to 1.5 kg per day) than healthy cows, and Amory et al. (Reference Amory, Baker, Wright, Mason, Blowey and Green2008) found a slight increase in the milk yield immediately after treatment against DD. According to Green et al. (Reference Green, Hedges, Schukken, Blowey and Packington2002), the estimated reduction in milk yield per 305 days lactation caused by lameness was approximately 360 kg.
In this study, we did not compare milk production before and after cows were diagnosed for claw diseases, and therefore we do not know if there was any production loss among DD- and SU-affected cows before they became infected. However, Hultgren et al. (Reference Hultgren, Manske and Bergsten2004) showed that animals prone to contracting SU produced more milk than those that did not develop SU.
Our results showed that only SU-affected cows had significantly higher cell counts during the 5th and 6th WACT compared with the healthy cows. However, the explanation for this is that one SU-affected cow had an extremely high cell count, most likely due to an udder infection that never developed into clinical mastitis. This situation supports the findings of Hultgren et al. (Reference Hultgren, Manske and Bergsten2004) where no association between SU and high cell count was found.
Lameness
It is a common finding that not all cows with claw disorders show lameness (Flower et al., Reference Flower, Sanderson and Weary2005). For example, Manske et al. (Reference Manske, Hultgren and Bergsten2002a) has found that 72% of trimmed Swedish dairy cows had at least one claw lesion, but only 5.1% were lame. Manske et al. (Reference Manske, Hultgren and Bergsten2002a) also suggested that a clear cause of lameness is not always found in lame cows. The fact that some of the healthy cows showed lameness might indicate that a disease process might have started some time during the period from when they were examined as healthy, and therefore selected as a healthy cow in the pair, until the observations were made. However, the misclassification bias, especially with regard to the healthy cows, could have been present during our study as the lag between clinical diagnosis of the disease and the actual presence of hoof lesions, but this was not considered as a possible confounding factor for our analysis. In this study, claw trimming was performed before the observations began, which probably initiated healing, reducing pain and thus reducing the risk of developing chronic lameness and long-term secondary infections. Manske et al. (Reference Manske, Hultgren and Bergsten2002b) showed that nearly 90% of cows diagnosed with lameness and claw horn lesions at trimming recovered within 4 months by the time the next trimming took place. In our study, two DD-affected cows out of 13 and four SU-affected cows out of 12 had recovered by 7 WACT. However, all the recovered SU-affected cows went on subsequently to develop DD. Furthermore, trimming twice yearly compared with once reduced the risk of SU by 40%, whereas infectious claw diseases such as DD were not influenced to the same degree (Manske et al., Reference Manske, Hultgren and Bergsten2002b). Most dairy cows in Sweden are trimmed one to three times yearly on a regular basis, and at about one-third of the trimmings claw lesions are scored by the trimmers (Manske et al., Reference Manske, Hultgren and Bergsten2002b).
Study design
As our results were slightly different from earlier studies, it is possible that the design of our study had more influence on the results than we expected. The replacement of cows, even if we tried to choose very similar animals, could still have some effect on the results due to the cows’ individual differences. In addition, we did not calculate sample size because the number of cows was chosen according to the claw trimming results and how many cows one observer could manage to observe as focal cows between two milkings. It is possible that a larger number of animals and/or a longer observation time per cow could have given stronger associations. In this study, all cows received footbath on the claws of one side of the body, and this could have affected how quickly they healed from DD or SU depending on which side of the body they had the diseased claw. Another possible difference between symptoms and behaviour of DD- and SU-affected cows could be that DD-affected cows were not treated in addition to the footbath trial, whereas cows with SU were additionally treated by claw trimming. Therefore, this study can be regarded as a pilot study from which we will be able to design better studies for future research. For follow-up studies, it would be better to observe animals for more hours per day (hopefully to cover the whole 24 h) and to perform these observations during shorter periods after diagnoses of claw diseases, hence avoiding unexpected replacements and other disturbing factors in the study environment.
Conclusions
It is concluded that DD- and SU-affected cows performed less lying, whereas they performed more standing, ruminating while standing and vigilance, and they also produced less milk and ECM compared with their healthy control cows. DD-affected cows performed more drinking, whereas SU-affected cows performed more walking compared with healthy controls. However, when adjusting for multiple testing, the only remaining results were that DD-affected cows performed less lying and more ruminating while standing and more vigilance. The behavioural effects were stronger at 2 to 3 compared with 5 to 6 WACT, and only 31% of the DD-affected and 42% of the SU-affected cows showed lameness at the start of the study.
It may be concluded that DD-affected cows showed a stronger behavioural response to the claw disease than the SU-affected cows, even though they showed less lameness than the SU-affected cows. This shows the importance of regular claw checking and claw trimming of the cows in order to avoid negative effects on behaviour and milk production.
Acknowledgements
The authors thank the owners and employees at Nötcenter Viken for allowing them to carry out the study on their farm and for all practical support. They also thank PhD student Hanna Lomander for diagnosing claw diseases and Evgenij Telezhenko and Jenny Loberg for their useful advice and discussions. The study was funded by Ekman's foundation, Bröderna Jonsson's research foundation and the Archimedes foundation. The authors would also like to give particular thanks to David R. Arney for his dedication and efficient help in polishing the English language.