


Introduction
There is a near-complete consensus that the growing concentration of greenhouse gases has induced a moderate increase in temperature since 1970, and will induce even more significant increases in global temperature until 2100. This has been confirmed in virtually every climate scenario under consideration.Footnote 1 With the help of ever improved climate models becoming more exact with their temperature projections, the global temperature is expected to increase between 1.4°C and 5.8°C (under different emission scenarios) by the end of this century, on top of the 0.6°C increase that has already been experienced since the 1970s. Along with this effect other weather effects are also expected, and in some cases have already started to be observed. In a recurring pattern, global increases in rainfall are anticipated, along with large areas where rainfall will actually decrease. This will also increase the precipitation variation that is observed. In general, climate variability is expected to increase, making extreme heat events much more likely.Footnote 2
Starting with the World Health Report of 2002,Footnote 3 mortality patterns have been increasingly associated with climate change, with a new focus on temperature’s current and future impact on the critical health sector outcomes for populations. Initial public health reports suggested importance be given to the effects of climate change in tropical zones and changes in the extreme weather events. However, further studies have documented health effects in the temperate zones, but the moderate part of the temperature distribution can also have mortality effects, especially in the European setting.
Demographic changes in world population for the same time frame have also been documented, mainly in terms of an increase in the average age of the global population,Footnote 4 with an increase in the 65+ old-age population group. Especially in the developed part of the globe, this demographic structure already resembles a perpendicular box rather than a pyramid. Thus the increasing importance of old-age vulnerabilities in the health sector is starting to become apparent, especially with the relative increase in non-communicable diseases (NCDs), as the weight of NCDs on mortality and morbidity increases with age. As is increasingly recognized, public health systems will need to address their vulnerabilities regarding care of the elderly and to detect vulnerable populations with chronic respiratory and cardiovascular diseases.Footnote 5 In the event of climate change, these vulnerabilities become more likely to lead to increased morbidity and mortality,Footnote 6 especially in the older demographic groups.Footnote 7
Empirically, both adult and older-age mortality with temperature has been substantiated most commonly with daily maximum temperature; yet it has not been studied at the developing country level (with national data) while considering already existing public health system and economic system vulnerabilities. This paper intends to fill in this gap by carrying out a mortality analysis at the monthly level for Turkey with respect to temperature changes in the environment.
This paper focuses specifically on the vulnerable elderly population in Turkey, in the specific context of changing temperature levels and increasing maximal temperatures. In the specific group of the elderly population, we determine the exposure–response relationship (that is location specific) between monthly temperature extremes and mortality for each province using observed data from 2009 to 2016. We collect with regression analysis the crucial socioeconomic regressors that ameliorate or worsen the crucial health outcomes for the elderly population that we focus on. We estimate future mortality patterns assuming the mortality–temperature pattern will stay constant for the locations that are under analysis, based on the future projections of changes in the critical temperature parameters.
The paper is organized as follows. Section 2 contains the basic discussions on the temperature–mortality relationship in the international literature, while Section 3 presents the current state of the Turkish literature in this special area. Section 4 provides information on the data and methodology, Section 5 summarizes national and then regional projections, and Section 6 discusses population vulnerability and characteristics of the Turkish health system in terms of the expected extreme heat events, with the corresponding mortality patterns. In the last part we review the future extensions, the conclusions that could be useful for future research and the limitations of our research.
Review of the international literature
In terms of the basic temperature–mortality relationship, there are two clear hypotheses in the relevant literature, which we would like to differentiate. The first one, which is substantiated in some empirical studies in Western Europe, suggests that mortality rises linearly with increasing temperature, and even moderate heat change can lead to excess deaths. The alternative hypothesis, which has also been well substantiated, prioritizes identifying an average threshold temperature beyond which mortality rises rapidly.
For this research the contesting hypotheses in the case of the temperature–mortality relationship is reduced to these two: the linear and the threshold hypotheses. The former would suggest that a single unit increase in temperature would have the same effect on mortality no matter where we are in the distribution. The latter would suggest that the heat–mortality relationship would be completely different (with a different slope) over a certain threshold temperature level, and under a certain threshold, too cold temperature. It is also classified under the U- or J-shaped temperature–mortality relationship, which would anticipate elevated mortality risks at extreme high and low temperatures in Turkey.
It is important for our research to both differentiate between these two hypotheses using our data and to see how much support exists for the specific threshold hypothesis in the Turkish data, investigated both nationally and regionally. In terms of the mortality effect, our research focuses on a specific part of the population in an especially vulnerable position, where mortality effects are easier to observe and where sudden increases in death levels during extreme health events are more common. The elderly (65+) age group is typically the focus in this area of research. This is because, especially in the context of developed countries, the elderly suffers the majority of mortality when extreme heat events occur. One reason for this is that they have a limited capacity for thermoregulation and a larger probability of suffering from already existing cerebrovascular and respiratory diseases. As a result, a significant amount of data analysis linking temperature to mortality is conducted mainly with the 65+ aged section of the population, with analysis on adult mortality working as a robustness check on the results.
When it comes to mortality due to heat stress, various studies have conducted spot estimations of changes in mortality due to climate change using cities with good records of past mortality statistics. These varied climate studies,Footnote 8 from different citiesFootnote 9 and countries in different parts of the world,Footnote 10 specify the causes of death in each regionFootnote 11 according to the classifications set out by the World Health Organization.
However, the first case of estimations performed by a grid cell, in which the space is divided into a grid covering regions from the continental to the global scale, is a paper by Takahashi et al.Footnote 12 estimating mortality increases for the temperate zone in the northern hemisphere. That research estimates increases in mortality within a threshold from 100 percent to 1,000 percent over the next seventy years for the temperate regions of the northern hemisphere, where daily mortality increases are estimated from changes to daily temperature maximals. The limitation of Takahashi et al.’s study, especially in terms of the developing country context that we are interested in, is that the past mortality patterns in their analyses are taken from the Japanese context, which might not be representative of the developing country and public health system context. In the present research we will try to impute the public health and health system capacities that Turkey has been able to generate, rather than assume that they are equal to those in developed countries.
Although investigation of the climate–mortality relationship is becoming more prevalent, the majority of these empirical investigations are carried out in a Western industrialized country setting,Footnote 13 with detailed and disaggregated data in the mortality and climate change dimensions. For other countries, studies are still rare, and since most papers have found that the mortality effects are contextual the confounding effects have to be controlled for at the national and regional levels.
In the temperate regions where Turkey lies there is a clear-cut seasonal variation in mortality. The death rate in winter is 10–25 percent higher than the rest of the year.Footnote 14 However, the extent of winter-associated mortality that is directly attributed to low temperatures (and not to seasonal patterns of respiratory infectionsFootnote 15) has been difficult to determine.Footnote 16 It is also well established that the Mediterranean basin where Turkey lies is particularly vulnerable to the effect of increases in summer temperatureFootnote 17 and increased heat-related mortality.Footnote 18
To date there has been a trend exclusively focusing on variations in summerFootnote 19 or winter temperaturesFootnote 20 and looking at the resulting mortality levels in specific urban hot spots.Footnote 21 These studies focus on the effects of extreme events on mortality. The limitation of this approach is that the crucial characteristic of climate change will mean that as well as the extreme events becoming more likely, there will be a secular increase in surface and water temperature, pushing the entire temperature distribution to the right, increasing all the temperature moments that we might be interested in.
Consequently, the main question motivating the present study is to assess the temperature distribution of the entire Turkish map with mortality data on the same disaggregated level. This is the first study plotting the full Turkish temperature–mortality relationship. We have utilized time effects to check for time factors that affect mortality, while controlling for the regional fixed effects that create different climate challenges in different parts of Turkey. Along with this major aim we tried to pinpoint the crucial regional disparities/discontinuities in this temperature/mortality relationship and finally to identify the set of crucial interaction variables that counteract or worsen temperature-related mortality. Establishing the national temperature–mortality relationship, together with quantifying the sensitivity of mortality to the tail ends of the temperature distribution, allows us to understand to what extent the results in the international literature are applicable to the Turkish context.
Studies on Turkey’s vulnerability regarding the effects of heat on health have not been carried out to the full extent yet. One reason for this is that the data are far from complete at the national level and not at the right frequency level for a full analysis. In order to carry out this study the data on many different dimensions were brought together. Regional climate simulations have confirmed that Turkey is one of the most vulnerable countriesFootnote 22 in the European regionFootnote 23 to the increased intensity of heat waves up to the end of the twenty-first century. However, the mortality and morbidity effects of these waves have not been adequately studied for Turkey, largely because temperature data and health data need to be combined for such a study. Our estimation study, in the presence of the minimal acclimation assumption, is a crucial first step of this analysis.
Sources and method
Data sources
In order to respond to issues that have been raised the present paper brings together mortality data at the provincial level and temperature measurements for the same provinces, as well as information about their economic development and public health system development. The creation of such a novel dataset will improve our ability to investigate and validate the climate effect in a developing country context, regionally diversified with public health system and economic development controls. We hope that the results will motivate further research on the channels of causation and deciding on what in the public health, economic, and social system should be strengthened to make the Turkish health sector more resilient against what the Lancet commission has called “the biggest global health threat of the 21st century.”Footnote 24
The secondary aim of our data analysis is to understand which locations in Turkey will be at greatest risk. For this purpose the project brings together future temperature projections, along with current dimensions of temperature, socioeconomic development, demography, and the health system. The methodology first establishes, from the differences in future projections, the locations in Turkey that will have the greatest temperature increases. Then, from the current paths of demography and the current relationships between temperature and mortality differentiated in a regional manner, we identify where temperature increase has an attenuated or inflated mortality effect because of the demographic, health, and socioeconomic intermediaries, identified in the regression with current data.
Our novel dataset brings together the most recently collected data on mortality, temperature, and public health system and socioeconomic development (assembling different dimensions of economic output and socioeconomic development and overall human development) at the provincial level for Turkey. The Turkish Health Ministry collects data every year on health development within the provinces. The estimation method aims to establish a first estimate of the health effects of changing temperature and increasing heat, with the crucial dependent variable being changes in elderly mortality patterns at the provincial level. This methodology is based on estimating current effects. In the second stage we focus on projecting what the future effects will be under two different climate scenarios.
The data for temperature and mortality at the provincial level in Turkey are available from two different sources. Monthly mortality data for the different age breakdowns (15–64 and 65+ are the main age categories we have focused on) are collected from TURKSTAT. Monthly temperature variables are collected from the ISIMIP-2b initiative, which collects temperature data for the provinces within the same period (between 2009 and 2016). For our purposes the two sets are analyzed for correlation and for comprehending the specific national and regional contours of the Turkish temperature–mortality relationship for the first time; this study combines these two datasets on a monthly basis.
The data on temperature and weather data are collected for the current and earlier time periods spanning from 1980 to 2016. The data for the provincial temperature distribution of Turkey for the entire year from 1980 to 2016 come from the ISIMP-2b initiative, giving the maximum temperature, minimum temperature, average temperature, and mean relative humidity, all at the daily level. For monthly level data the monthly maximum of the daily maximum temperature, monthly minimum of the daily minimum temperature, monthly average of the daily average temperature, and monthly average of the daily average humidity are obtained by our calculations.
Our Turkish mortality data come from TURKSTAT, which provides data on the monthly distribution of mortality levels for the entire Turkish adult population at province level (eighty-one data points per month). Additional information is also provided for the age-by-age and gender disaggregation of the overall mortality levels. Monthly deaths among the resident population for all natural causes (ICD-9: 1–799) are considered for the age groups 18–64 and 65+ years. As the emphasis of our paper is on the elderly mortality distribution, we focus on the 65+ age part of the mortality distribution, using the adult mortality figures (18–64) for robustness checks. As this is a first attempt, trying to get an idea about the level of overall vulnerability rather than understanding all the individual channels collectively creating the overall vulnerability, in this analysis we focus on all causes of mortality rather than on specific ones.
The data on the health system dimensions, level of economic development, and demographic characteristics for the different Turkish regions and provinces are collected from multiple sources. Our data on the indicators for socioeconomic and health development are from TURKSTAT for the indices of urbanization and old and young age dependency. Data on the level of public health system developmentFootnote 25 of provinces are collected from the annual reports of the Health Ministry of Turkey. The economic development level of provinces for 2009–16 is also from TURKSTAT. Variables influencing local climatic conditions such as latitude and longitude are also employed in the present study.
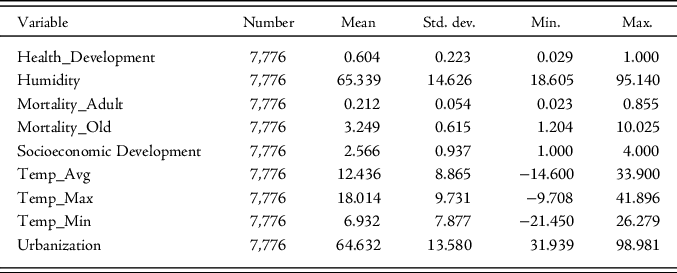
The data that are projected for the future weather and temperature levels (spanning from 2017 to 2100) are collected from the GFDL-ESM2M global climate model of the National Oceanic and Atmospheric Administration Geophysical Fluid Dynamics Laboratory. The temperature data are dynamically downscaled to the coordinate level of the provincial centers of Turkey. The projections are performed based on the RCP 2.6 and RCP 6.0 emissions scenariosFootnote 26 of the Intergovernmental Panel on Climate Change. Projections are carried out for all the critical temperature variables that we have data for, namely the maximum, minimum, and average points of the distribution for Turkish temperature collated from different station temperature data in Turkey. All the data on these different dimensions are summarized in Table 1.
Descriptive statistics of critical variables

Method
The method we use in this paper focuses on plotting the full mortality relationship with respect to climate and different socioeconomic and demographic interaction variables. In theory, different parts of the climate–mortality relationship have been decomposed, in addition to humidity interactions, together with the health and demography interactions.
The basic formula employed can be summarized by Equation 1 thus:
 $${M_{it}} = {{\rm{\beta }}_o} + {{\rm{\beta }}_1}{t_i} + {{\rm{\beta }}_2}{t_j} + {{\rm{\beta }}_{3{\rm{\;}}}}{t_k} + {{\rm{\beta }}_4}{h_i} + {{\rm{\beta }}_5}({h_i} \times t) + {\rm{B}}6{{\rm{H}}_t} + {\rm{B}}7{{\rm{D}}_t} + {u_t} + {v_{it}}$$
Here M represents the mortality data of the country, defined by the year in which it happened (monthly data);
 $${t_i}$$
,
 $${\rm{\;}}{t_j}$$
, and
 $${t_k}$$
represent the daily observable moments of the temperature distribution, which have been aggregated to the monthly level, usually by averaging; and
 $${h_i}$$
and
 $$({h_i} \times t$$
) represent the pure and composite (together with temperature) measures of humidity, which are hypothesized in the literature to be highly correlated with mortality patterns.Footnote 27 Following the Takahashi methodology, H
t
represents the health development and D
t
represents the socioeconomic development of the country, which correlates with overall mortality patterns, and specifically the country-specific mortality to heat change gradient.Footnote 28 The humidity measures are aggregated to the monthly level by averaging. Regional random effects (u
t
) are also included in the regression to establish the regional heterogeneity in the mortality levels and the mortality change during the period in question (2009–16).
The fixed effect methodology keeps the geography-specific patterns of mortality constant and looks at the effect of changes in the extreme parts of the distribution, keeping the regional averages constant. Use of this structure allows us to introduce regional thresholds and analyze the difference in thresholds between regions and what differentiates and attenuates the mortality effect when regions cross these region-specific thresholds.
Results
In anticipation of our results, the main findings of the paper are as follows. First, we confirm the V-shaped mortality–climate relationship, both at the national and regional level. Second, there is a room for regional differentiation, as there is a significant regional effect that is independent of the national effect. Inflection points of the V-shaped relationship occur at different points of the temperature distribution, supporting additional hypothesis of the regional acclimation hypothesis. Third, increases in mortality as expected have been found not only to be correlated with extreme temperature events (supporting the threshold hypothesis in the case of Turkey) but also to show a relationship between overall increases in temperature variation and an increase in the underlying mortality rate. All the results are in line with international literature findings but can be confirmed in the case of Turkey.
Projecting our results into the future, the relationships we have found between elderly mortality and temperature change will be further strengthened as the size of the vulnerable population grows and the extreme heat events becomes increasingly commonplace.
In addition to these results that are in line with the international literature, the Turkish contextual variables that are influencing the temperature–mortality relationship are found to be urbanization, level of socioeconomic development, and health system capacity, which have independent effects on the regional-level temperature–mortality effects. Robustness checks support that the adult mortality profile is related in the same direction with temperature variables, but in a much more attenuated manner.
Basic model framework
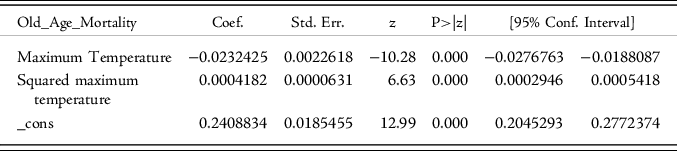
The basic model tries to assess the current epidemiologic evidence available for the purpose we are interested in, which relates retrospectively the changing temperature conditions to all-cause mortality trends and then projects these trends into the future. Figure 1 shows that, for Turkey, the monthly average of maximum temperature values and mortality exhibit the famous U-shaped relationship. This is in the context of Turkey’s death figures since 2009 and in terms of the 65+ age group mortality. The U shape is also confirmed in Table 2, where we investigate the effect of including higher-powered relationships of temperature, as the first power is negative and the second power is positive, just as the U-shaped relationship between temperature and mortality would suggest.
Turkey (national), mortality and temperature relationship

Main regression, U-shape

Note: With 7,776 observations and eighty-one provinces, the R2 in this simple regression is equal to 0.1252.
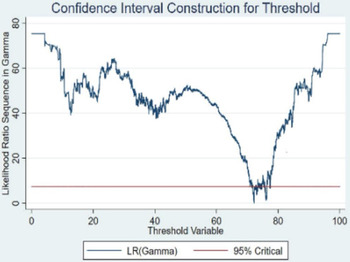
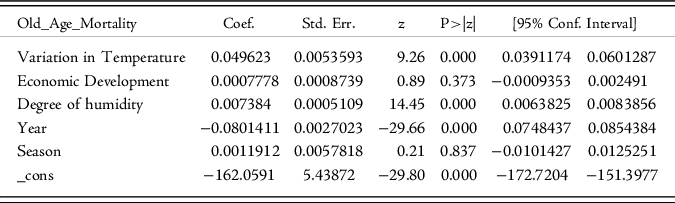
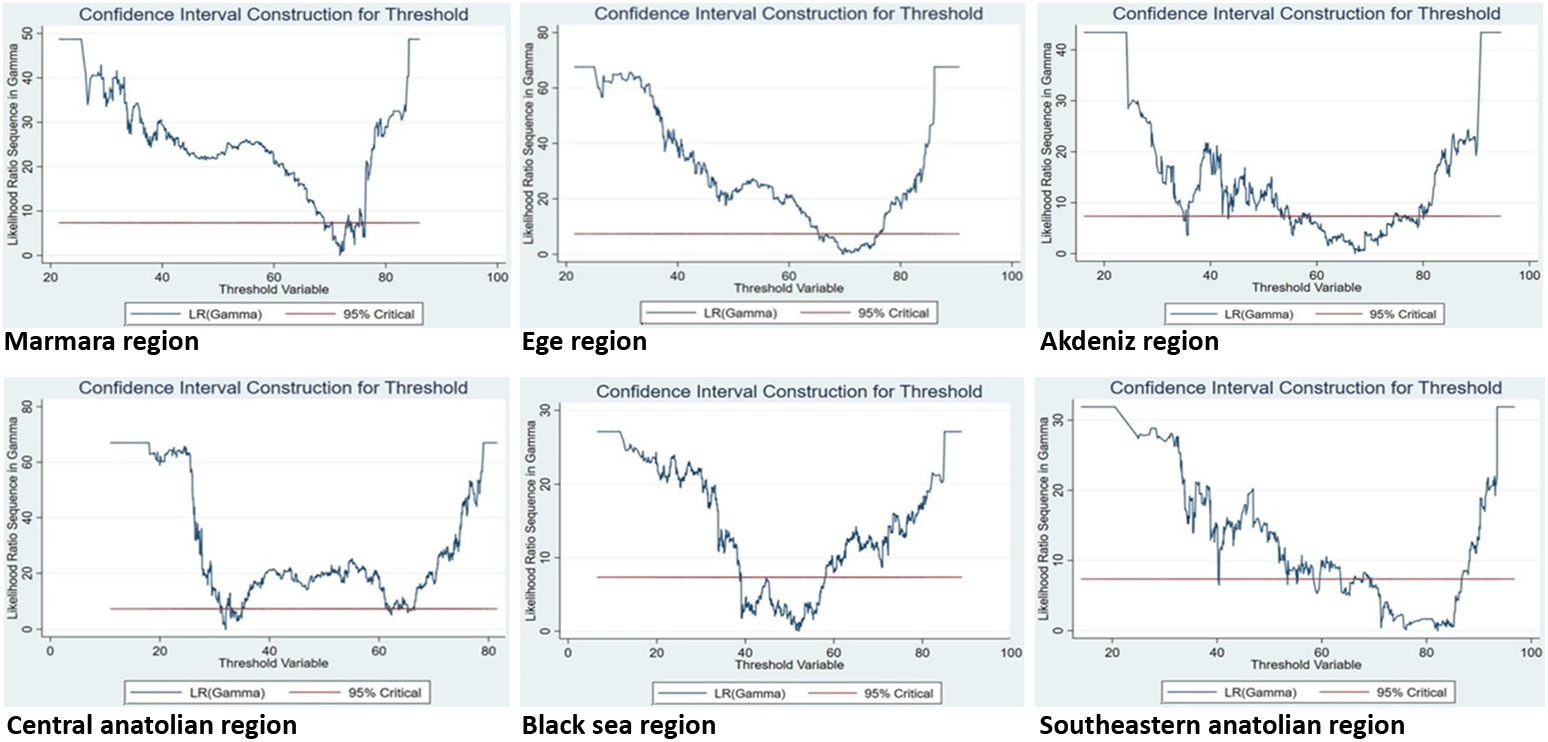
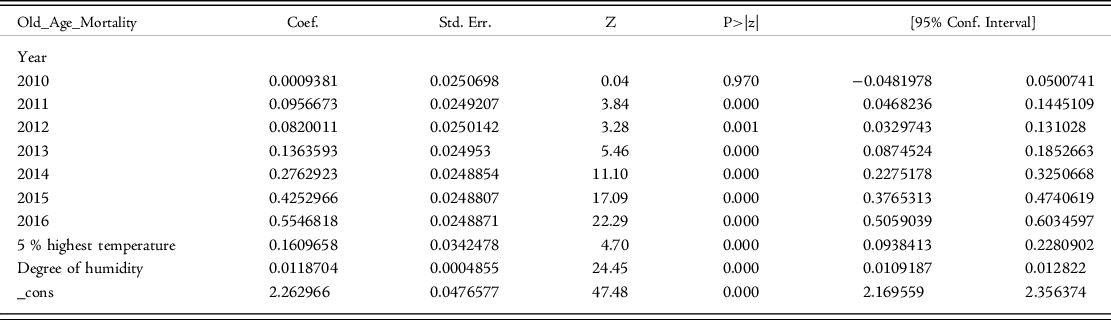
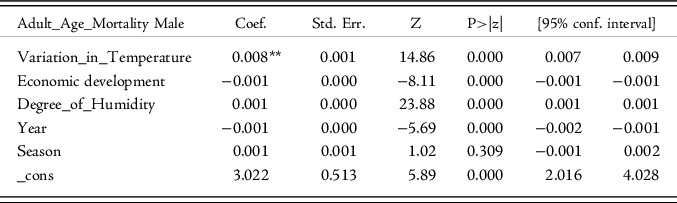
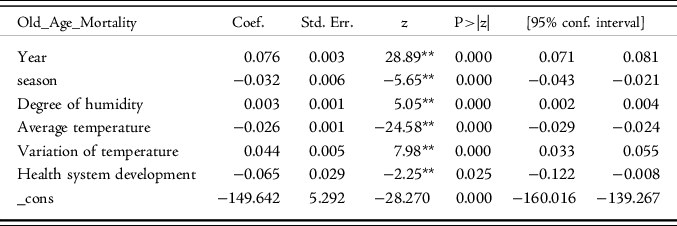
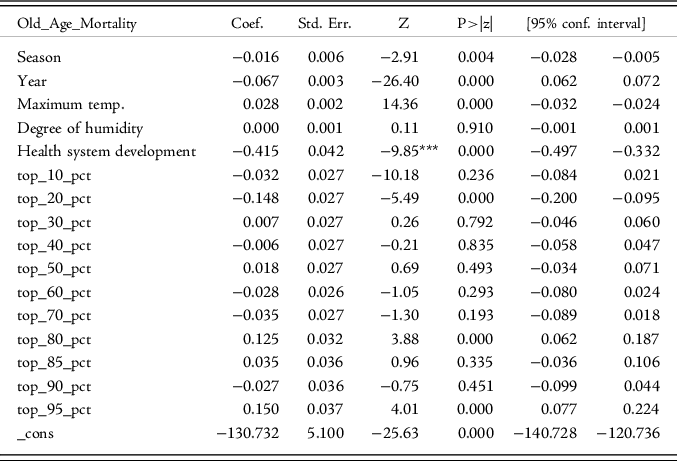
In line with health shock literature,Footnote 29 increasing temperature variation, in conjunction with humidity, is clearly one of the underlying reasons for increasing elderly population mortality for both genders (Table 3). By further analysis of Figure 1 in the case of the national pattern and Figure 2 in the case of the regional pattern, to understand where exactly on the temperature distribution the specific mortality trough occurs, we confirm graphically and in terms of regression that the 80th percentile is the crucial point where the mortality–temperature trend changes. Although the 80th percentile is the global minimum of the temperature–mortality relationship and as such is a natural candidate for optimum temperature (OT), one more result can be obtained by further analysis. The effect of extreme heat and extreme cold is confirmed in our data in terms of its relationship with old age mortality (Tables 4 and 5).
Important economic and temperature predictors of old-age mortality

Turkey’s regional climate–mortality curves

Extreme heat effects on old-age mortality (year and province effects controlled)

Note: The equation focuses on the extreme points of the temperature distribution and looks at how much extra mortality exists in those intervals of the distribution.
Extreme heat and extreme cold effects on old-age mortality

Note: The equation focuses on the extreme points of the temperature distribution and looks at how much extra mortality exists in those intervals of the distribution.
Table 5 shows the changing effect of temperature on mortality. The most important change in the slope of the temperature–mortality relationship occurs at the 95th percentile, which is the particularly vulnerable section of the temperature distribution that researchers need to focus on. The extreme temperature effect, which is substantiated originally by Table 6 (where average temperature changes are accounted for), is further refined with a specific threshold result and critical threshold identification in Table 10.
Temperature variables and old-age mortality

Note: With regional fixed effects and region-time fixed effects, the significance of the results do not change, but the error terms become smaller.
One of the main results substantiated in the burgeoning climate change and health field is that certain temperature parameters covary significantly with mortality figures.Footnote 30 In the simplest regression format (where only the first and second moments of the temperature distribution are used as predictors of old-age mortality) we find that while controlling for the temperature average increasing the variation in the temperature distribution increases old-age mortality (Table 3). This is in line with the established results in the literature, both in terms of regional analysisFootnote 31 and work that investigates national mortality patterns.Footnote 32
In the next step we investigate whether this increase in variation effect is related to the hypothesis that as extreme weather events occur they influence the mortality patterns in a nonnormal way. Focusing on first the highest (Table 4) and then the lowest and highest 5 percent of the temperature distribution (Table 5) for Turkey from 2009 to 2016, we see that the mortality figures indeed are higher during these periods compared to the normal level of mortality, and the differences from the baseline mortality level are significant (Table 4).
Finally, the results are corroborated when we focus on the adult population (18–65 years old), but the temperature effect we calculate is much less substantial compared to that on elderly mortality (see Table 7).
Adult mortality distribution and temperature and economic predictors

Note: In line with the general literature, adult mortality moves in the same direction as old-age mortality with temperature, but at a much smaller level of effect.
Current model results with regional effects
As discussed above, in the international literature certain differences can influence temperature’s effect on mortality. To a certain extent the increasing temperature variation and changing weather conditions are another kind of health shock that tests the resilience of the social and public health system. In this case, variables that capture the level of economic deprivation or backwardness will hamper the buildup of this resilience and public health systems’ institutional development will strengthen it. Together with the temperature variables, the new socioeconomic and public health system related variable(s), and regional fixed effects, the expected heat-associated excess mortality can be written as a function of:
 $${M_{it}} - {M_{iOT}} = {{\rm{\beta }}_o} + {{\rm{\beta }}_1}{t_{max}} + {{\rm{\beta }}_2}{t_{min}} + {{\rm{\beta }}_{3{\rm{\;}}}}{t_{avg}} + {{\rm{\beta }}_4}{h_{avg}} + {{\rm{\beta }}_5}{s_t} + {R_j}{\rm{\;}}$$
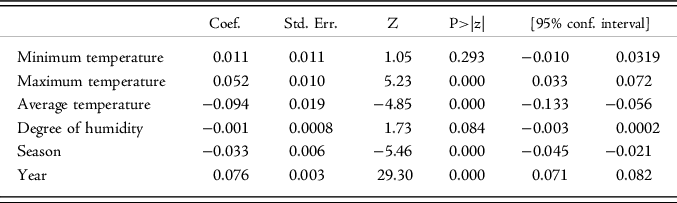
When we include the regional effects and include the fixed differences between the seven different regions of Turkey, the majority of the results we corroborated in Section 2 remain valid. The U-shaped relationship holds (Figure 2) both graphically and in terms of the equation estimate (Table 6), and the maximum temperature effect holds (2.7 percent, 95 percent CI 0.65–4.75). However, now with the seasonality effect included the minimum temperature effect completely disappears from the set of significant explanatory variables in explaining mortality patterns (Table 8). Moreover, there are significant regional differences in terms of the temperature–mortality relationship. Although the shapes of the curve are identical, the inflection points, when we draw them using both absolute temperature and relative temperature (relative to the national average), occur at different points depending on the regions (see Table 9). The differences are of such a magnitude that, at the maximum, a difference of 12.5°C exists between the hottest region in Turkey and the coldest region, in terms of the optimal temperature distribution. This is roughly in line with the Europe-based climate resiliency results.Footnote 33 The sizeable differences in regional thresholds are first validated in the UK climate and old-age mortality analyses, but then are also corroborated in many different European locations.Footnote 34
Climate variables and mortality (regionality effects controlled)

U-shape in the climate–mortality relationship (regionality controlled)

Note: The multilevel diagnostics again suggest the added regional level is significant at the 0.05 significance level and the chi-square test (chi_2= 156.62) suggests significant regional variation.
Similarly, once we control for the regional differences in health capacity we can also explore the effect these differences have on mediating and potentially mitigating the heat stress effect (Table 10). The reason why this heterogeneity is important is that although there has been significant convergence in health inputs and health outputs in the last decade, significant differences exist among the health capacities of different regions in the Turkish health geography. This could have an effect on how the public health system reacts to increases in population risk parameters. The regional analysis shows that there are significant differences in the ability of the public health systems to protect against extreme heat (and cold conditions), and the regions with the highest health capacity indeed present the highest protection capacity against the risk posed by extreme temperature conditions (Table 11). Thus, to a certain extent, it is the development of the public health systems and the readiness of the health infrastructure,Footnote 35 and the imperfections of the system of adaptability to high heat (and low heat) conditions, that drives the mortality patterns that we are observing in the data. Moreover, these public health system characteristics are expected to continue to be influential in the following years.
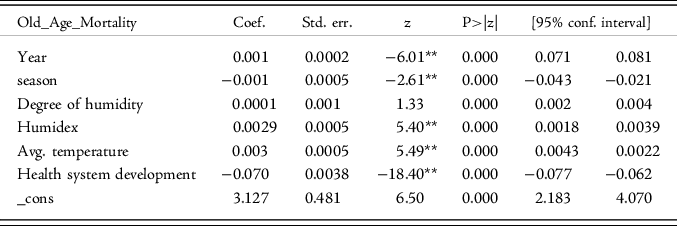
Important variables driving old-age mortality (seasonality and province-effect controlled)

Note: ** represents p<0.05, which is the probability level at which our results are found to be significant.
All temperature and socio-demography variables

Note: *** represents p<0.01, which is the probability level at which our results are found to be significant.
The regionality effects can be investigated further by breaking up the results in terms of urbanization levels and change in urbanization levels. Turkey displays significant differences in urbanization, with a different temperature–mortality pattern in its highly urbanized areas compared to its areas with significant rural populations. There is a substantial amount of research that substantiates the fact that the urban locales must be treated differently, because the climate change characteristics of city will be different,Footnote 36 the effect of rapid urbanization on climate change will be different,Footnote 37 and how climate change resilience will be built up in the urban settingFootnote 38 will be different. These effects have been substantiated for the countries that have experienced significant urbanization processes in the 1950s,Footnote 39 1970s,Footnote 40 1980s,Footnote 41 and 1990s.Footnote 42
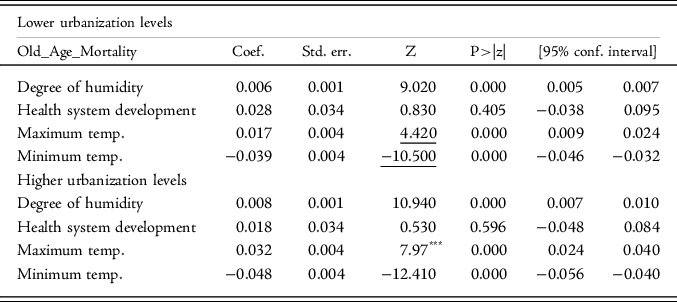
The main climatological reason for this is that cities, with their solid urban infrastructure, can absorb heat and form “urban heat islands,”Footnote 43 creating localized pockets of high temperatures and high humidity in the summer months. Such results have been corroborated in the Turkish context by Turkish climatologists.Footnote 44 A rural context creates a different set of coefficients for maximum and minimum temperature effects. Our results suggest a similar effect, with maximum temperature effects in particular being strengthened in more urbanized contexts compared to less urbanized contexts (Table 12). One potential channel for this is the urban island heat effect commonly discussed in the literature. Furthermore, the elderly are more confined to their homes and less mobile in urban contexts, which makes the high-temperature days especially risky in imperfectly maintained residential environments.Footnote 45
Temperature–mortality relationship in different parts of the urbanization continuum

Note: *** represents p<0.01, which is the probability level at which our results are found to be significant. The between variation in the regional regression as a proportion of total variance is equal to 0.25, with significant variation between provinces with different urbanization ratios. The urbanization dummy differentiates between provinces higher than 66.5 percent in terms of urbanization rate and provinces that are lower than the 66.5 percent threshold.
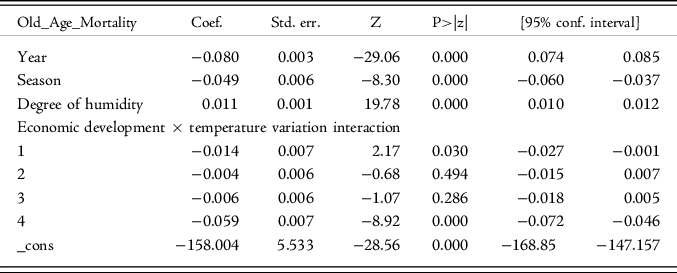
Finally, we control for social deprivation by looking at provincial level economic development. When we control for this dimension, we find that temperature variation is creating increased mortality in the regions more underdeveloped economically, suggesting that it is crucial to have the resources to combat the health effects of climate and to decrease individual vulnerabilities (Table 13).
Temperature resilience of different provinces (ranked in terms of economic development)

Note: With 7,776 observations and eighty-one provinces, the R2 in this simple regression is equal to 0.2552, and with regional fixed effects and region-time fixed effects, the significance of the results does not change but the error terms become smaller.
Theoretical framework for the future heat–mortality relationship
The important variable in the model to be estimated is Excess_Dt, which is the excess mortality that will be caused by temperature conditions in the future diverging from the optimal temperature, estimated from today’s mortality–temperature relationship in the case of Turkey.Footnote 46 As well as using today’s data to estimate the optimal temperature, we need to estimate the weight of excess mortality resulting from medium heat days (a1) and from higher heat days (a2).
The model indicates that extra mortality over the baseline is caused by aberrant heat events; the Turkish mortality data suggest that the crucial points of the temperature distribution where aberration is important are dates when the temperature is higher than 80 percent of the distribution and dates when temperature is higher than 95 percent of the distribution.
 $${\rm{Excess}}\_{\rm{Dt}} = \left( {{\rm{a1}}*{\rm{n1}} + {\rm{a2}}*{\rm{n2}}} \right)/{\rm{365}}$$
The crucial coefficients of this equation are a1=0.02 and a2=0.10, where n1 is the number of dates that temperature is higher than T0 but lower than T0+5, and n2 is the number of dates that temperature is higher than T0+5.
The excess death model (summarized in Equation 3) is based on Takahashi et al. (Reference Takahashi, Yasushi and Seita2007) and the next section utilizes it to make projections for future mortality patterns, depending on the temperature projections that have been constructed by climatologists for Turkey’s local weather conditions.
As already mentioned, the estimations in the present study do not take physiological or social adaptation and acclimation into consideration. Furthermore, population density and age compositions are assumed to be constant in the future. In other words, changes in risk are estimated on the supposition that the climate will suddenly change tomorrow. In reality, adaptation to some extent can be expected to follow long-term changes in climate, so from this perspective our estimations are on the high side.
The future projections in this section are conducted in the RCP 6.0 scenario and share the estimates of future mortality projections in this scenario. The main reason for the choice of RCP 6.0 is that it is the best estimation of the situation under a no action, business-as-usual scenario. Moreover, it is customary in the literature to calculate the cost associated with a high future level of emissions (Huang et al. Reference Huang, Adrian Gerard, Xiaoming, Pavla, Gerard and Shilu2011) in the first estimation in order to motivate discussion on the benefits and costs of climate-related policies.
Expected changes in national mortality values for the next eighty years
Using a1=0.05 and a2=0.10 and comparing the n1 and n2 averages for our decade and comparing it with the N1* and N2* numbers (projected) for the next seventy years (at decade level) the estimation results project a 196 percent mortality increase in the elderly population using the aggregated monthly temperature distribution.
If we account for the number of consecutive days with extreme heat (over 31.5°C), the baseline old-age mortality rate will be increasing at a 200 to 260 percent rate. This independent change seen in the daily data will create a compounding effect on the monthly mortality–temperature relationship we have estimated. Clearly further work needs to be done on daily mortality patterns (all causes). In Turkey these data, at the time of writing, have not been made available to public health researchers.
Our future elderly mortality projections (between 156 percent and 260 percent – average estimate: 196 percent – of this decade’s baseline value) are made in the scenario where current climate change patterns continue unabated in the temperature dimension. However, we would like to discuss the main reasons this value might be understated (it is indeed lower than the 400 percent estimated by the Takahashi study)Footnote 47 compared to some international counterparts.
First, we would like to point out that the main difference with the Takahashi et al. paper is that their paper sketches the relationship between daily temperature effects and daily mortality effects, whereas we are following the same methodology with monthly data (because of the limitations with Turkish mortality data). The fundamental truth is that the higher level of variation in daily compared to monthly data at the level of the independent and dependent variables would allow the temperature–mortality relationship to be estimated much more precisely. This might explain why the daily effect appears stronger than the effect at the month level that we have estimated. The second reason is that a crucial co-indicator or co-dependent variable of humidity levels is also increasing during the same period, and this will have a (1) independent and (2) co-dependent effect on mortality figures (Tables 10 and 18), increasing old-age mortality figures. Third, another crucial difficulty arising from not being able to use the daily temperature patterns is to lose the dimension of consecutive hot days, which is found to be very highly correlated with mortality patterns in the literature.Footnote 48 When we further investigate the Turkish temperature values, we find that the number of consecutive days that are mildly but not severely hot (over 27.5°C, less than 31.5°C) will be increasing at a 150 to 175 percent rate and extreme heat days will be increasing at a higher clip, as previously quoted. We would like to reiterate that in the international literature the broad consensus suggests for old-age mortality that consecutive heat is more lethal than sporadic heat, and extreme-heat events are more significant than mild-heat events in predicting old-age mortality.
Regional heterogeneities analyzed in a future-looking model
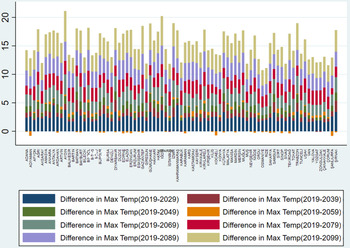
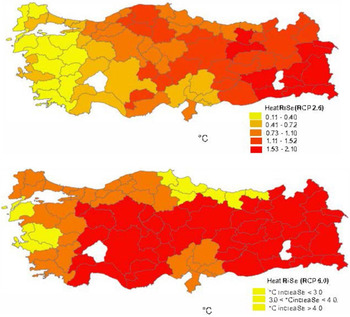
Figures 3 and 4 substantiate the expected result that the trend of global temperature increases will also be observed in Turkish temperature levels. The U shape is substantiated graphically at the national level in Figure 1. However, this effect is forecasted to be distributed unequally, with significant regional heterogeneity in temperature increases and significant differences in regional temperature–mortality relationships (Figure 2). In addition to the already existing climate differences (Turkey has temperature differences of significant proportions between different regions), namely altitude and latitude differences, the regional heterogeneity of the temperature effect means that one needs to investigate regional vulnerabilities, especially for regions where the greatest climate change risk occurs.
Forecasted differences in maximum temperature for different time periods at province level, Turkey (decadal change 2019–99)
Source: ISIMIP2b, RCP 2.6, and RCP 6.0 scenarios.

Forecasts of future increases in temperature (°C), Turkey; regional distribution under different RCP scenarios
Source: ISIMIP2b, RCP 2.6, and RCP 6.0 scenarios.

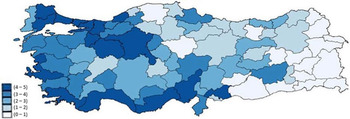
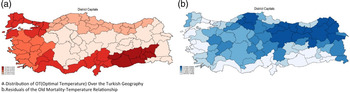
When we look at regional inequalities in future mortality risk, we can confirm that the burden of climate change impact is quite unequal among Turkish regions, at least from the viewpoint of the heat stress mortality investigated. Significant increases in excess mortality density can be seen in the eastern Anatolian, inner Mediterranean, and central Anatolian (except the capital Ankara) regions. These regions are characterized by large losses due to higher than national average increases in local temperature levels (Figure 3), as well as increased vulnerability, due to lower OT (Figure 6a), lower public health system development (Figure 5), and higher excess mortality, measured as ϵt (Figure 6b).
Health development of different provinces: Health Resources Index
Source: TUIK, Health Systems Yearbook, 2009–16.

Map of (a) optimal temperature and (b) the residuals of the old mortality–temperature relationship

Model extensions into population vulnerability and system vulnerability
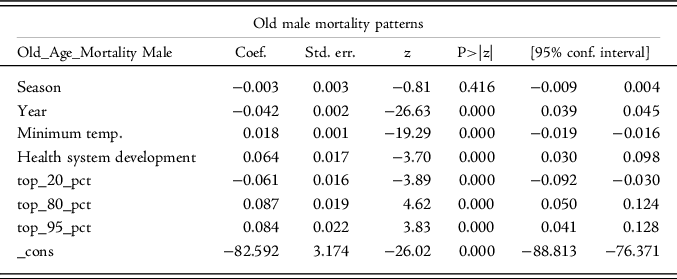
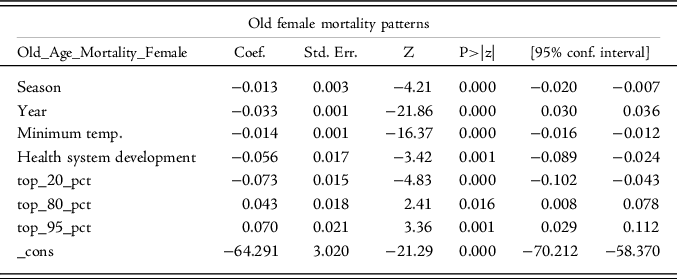
In terms of applying the Takahashi framework to the Turkish system and values, the fundamental variables we will focus on, which dovetail with climate change sensitivity, are health system characteristics and population vulnerability as measured by the population with a high old age/working age ratio. Incorporating these characteristics and dividing the risk context into two separate equations for the two main gender groups,Footnote 49 we observe the relationships and results illustrated in Tables 14 and 15.
Old male mortality and temperature variables

Note: With 7,776 observations and eighty-one provinces, the R2 in this simple regression is equal to 0.2272, and the same 80 percent and 95 percent threshold is observed in the old-age mortality/temperature relationship. For the interest of brevity we have only included the percentage thresholds that have been found to be significant, but all 5 percent thresholds have been tested for significance.
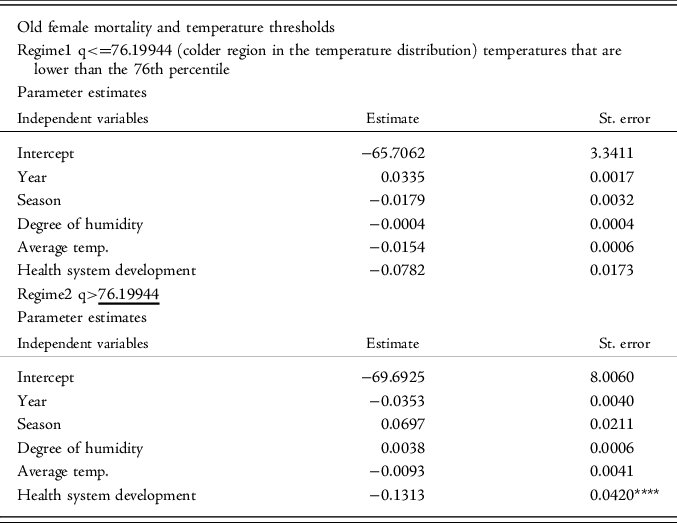
Old female mortality and temperature variables

Note: With 7,776 observations and eighty-one provinces, the R2 in this simple regression is equal to 0.2233, and the same 80 percent and 95 percent threshold is observed in the old-age mortality/temperature relationship. The mortality effects for females, although statistically as significant, are smaller in absolute size over the whole distribution. For the interest of brevity we have only included the percentage thresholds that have been found to be significant, but all 5 percent thresholds have been tested for significance.
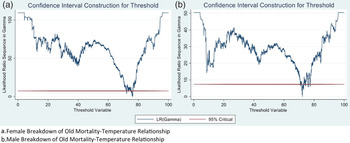
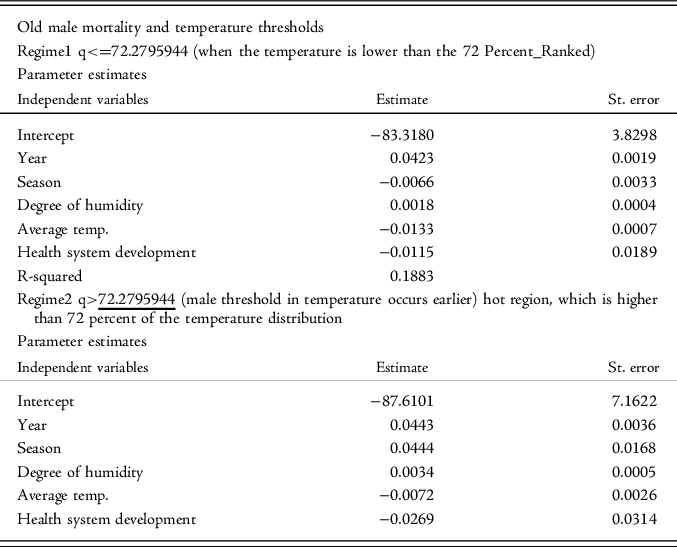
One additional result we find when we divide the mortality risk between the genders is that they share similar V-shaped temperature–mortality relationships (Figure 7) and similar temperature thresholds (Tables 9 and 10) and socioeconomic covariates of mortality. Although female mortality starts increasing at a slightly higher temperature (they have a higher resilience to the effects of heat, mostly related to the heart attack statistics), once both genders are in the excessive heat part of the temperature distribution, where the heat–mortality relationship slopes upward, the effect of the public health system in mitigating mortality effects is much more significant for the female population (Table 17 compared to Table 16). This suggests that underdevelopment of public health systems is more formative for the climate resilience of the female population compared to the male population.
Gender breakdown of the temperature–mortality relationship for (a) women and (b) men

Male mortality (different points of the threshold relationship with temperature)

Note: Interestingly male old-age mortality is not positively associated with health system development in the part of the temperature distribution of uncomfortably high heat.
Female mortality (different points of the threshold relationship with temperature)

Note: Female threshold temperature, where the mortality distribution changes slope, occurs at a higher temperature level for the old female group compared to the old male group. Female old-age mortality, at the higher part of the temperature distribution, is also much more strongly associated with health system development.
Discussion
This study identifies the urban elderly population with pre-existing cardiovascular diseases (heart attack and stroke) or chronic respiratory diseases living in the central Anatolian, eastern Anatolian, and inner Mediterranean areas as being at particular risk, both now and in the future. The research supports the case for pre-emptive health policies to bolster the adaptation mechanism and to prepare their population by informing before the extreme heat events are likely to occur, monitor their progress, and increase the health resources when and where most needed. The result suggests that the heat vulnerability of the system will only grow as the population gets older, the temperatures become more variable, and extreme heat becomes more commonplace, and so the public health system must be cognizant of these weather- and climate change-related risks that are likely to arise.
This study has several limitations. We do not contend that our analysis captures the full effect of climate change on the mortality figures of Turkey. Data limitations and a first-stab approach mean that we focus on an old-age cohort (which is more sensitive to sudden temperature changes, and more importantly changes in maximum and minimum heat spikes)Footnote 50 and monthly temperature values. Moreover, our approach gives priority to understanding the overall size of the effect, rather than understanding the channels of effect. This has led us to focus on all-cause mortality figures, in order not to overlook or understate the change in mortality. However, the cost of that choice is that we do not know which diagnosis codes are especially important to focus on, in terms of either crucial comorbidities or the resulting cause-specific deaths in the context of increased heat. Furthermore, the crucial interactions we have noted (between high heat and high humidity (Table 18) and high heat and high pollution, for which insufficient data exist in the Turkish context) would be more clearly identified when analyzing cause-specific mortality.
Humidity effect interacted with temperature maximums (seasonality and province-effect controlled)

As discussed above, our approach takes all-cause mortality as its starting point, and looks at how all-cause mortality rates shift around in days exceeding the minimum mortality temperature (MMT),Footnote 51 to varying degrees. Rather than working on mortality attribution, we believe the mortality movement around the temperature dimension, with space and time effects being controlled, gives a rough idea about the extent to which mortality related to heat and cold stress does exist. Future studies should focus on identifying the specific ICD codes (the International Statistical Classification of Diseases and Related Health Problems, a medical classification list compiled by the World Health Organization).where the temperature-related mortalities are concentrated. The analysis carried out supports the hypothesis that the old-age group we focus on is the most sensitive to temperature changes,Footnote 52 although adult populations are by no means immune to the effects of heat. The demographic projections for Turkey and globally support the fact that this cohort will be increasingly important for mortality projections in the future.Footnote 53
Our analyses focus on quantifying the heat-related mortality avoided in the Turkish context when a radical mitigation path is followed. This study uses a large initial condition ensemble to assess uncertainty due to internal climate variability versus greenhouse gas-induced changes and to compute return periods of extreme mortality events. In line with baseline extreme event attribution studies, we differentiated the heat-health benefits of additional mitigation by keeping all other conditions – including (1) population, (2) temperature–mortality relationships, and (3) MMTsFootnote 54 constant for the future path. The original values, which condition future projections, have been estimated using 1980–2016 data.
The results are very much determined by assuming that many structural factors in Turkey will stay constant. In fact, the population of Turkey and the population distribution among demographic groups and among the cities and regions is ever changing. If the current trends persist for Turkey, urban centers will grow, with the population structure changing in the direction of older women and men both with significant added risk to succumbing to extreme heat, increasing their mortality and morbidity levels. Therefore, the given patterns of population increase and the aging population along with changes in other demographic characteristics that contribute to heat vulnerability and increases in urbanization will likely exacerbate heat-related mortality in the coming years. This will be compounded by higher levels of warming associated with urban heat island effects (depending on choices relating to the type of urbanization). Thus, the avoidable deaths projected in the present study may be conservative estimates,Footnote 55 reinforcing the benefits of ratcheting up mitigation ambition to prevent elevation of heat-related mortality in Turkey. Further studies need to be undertaken to discuss what local measures could limit heat-related mortality and morbidity in the hot spots of heat stress.
We simultaneously assessed the nonlinear relationship between temperature and mortality over the whole range of observed temperatures in each province, establishing a U-shape with a clear minimum temperature of mortality, both at the national and the regional level. We should acknowledge that we have not estimated the lag effects, as the month-level data do not allow for the estimation of those interplays.
Previous studies that took the same approach estimated the mortality impacts of both heat and cold. We did not estimate cold-related mortality changes or compute the combined changes in heat- and cold-related mortality because extreme high and low temperatures have different exposure–response relationships and different lag structures, which we did not fully account for in this study. High ambient temperatures, which we have focused on herein, will have an immediate and direct effect on mortality. Associations between low ambient temperatures and different causes of mortality are less direct, with longer lags. Therefore, we think that heat- and cold-related mortality should be studied separately. As different adaptation strategies are also needed to offset the impacts of heat and cold on health, future work is needed to specifically model the relationship between low ambient temperatures and mortality and to look at cold-related mortality in the specific case of Turkey.
If the current trends in population movement continue, the central Anatolian region and the inner Mediterranean regions will become especially high-risk areas, with very high levels of temperature increases, high levels of old age/adult age populations, and lower relative MMTs (where the U-shaped mortality curve inflects). The health system here must be strengthened and made more sensitive to the health needs of the elderly population. In fact, the research substantiates that the mitigation efforts related to heat mortality must prioritize the health development dimension, especially in the case of mitigating old-age female mortality. Our national results demonstrate that strengthened mitigation ambition would result in substantial benefits to public health in Turkey.
A crucial limitation is the basic empirical fact that the daily mortality patterns, usually used by international researchersFootnote 56 in the climate–mortality relationships field, are not available to Turkish researchers. This limitation meant that the present research used the most disaggregated and higher-frequency data on all-cause mortality found in the longest continuous form, which happened to be monthly mortality data.
Data on air pollution for Turkey’s provinces are incomplete, but clearly the quality of air is a crucial intermediary in heat effects and for creating a cumulative effect on the old-age population that our data are focusing on. Future research must also include this critical area, to fully conceptualize the temperature–mortality relationship.
Data on NCDs among the elderly population, which can inflate mortality, are also incomplete. Although general information exists concerning which diagnosis codes are more important for the overall population, information about this crucial demographic group is missing and needs to be added to the analysis. Not only this, but sensitivity analysis can also be undertaken, if we find causes of death for the elderly population, looking at whether for instance respiratory conditions cause more deaths among them on the hottest and coldest days of the year.
We are also limited by our projections methodology. Our analysis may suffer from the non-acclimation assumption, which would lead us to overestimate the mortality effects. We also assume that population densities will stay constant during the seventy years and there will be no within-country flight from high temperatures. In general, the public health system adaptation and social adaptation to increasing temperatures are assumed to be minimal. In accounting for these strong assumptions in our modeling, we make clear that as a first stab one needs to start from the most bare-bone set of assumptions (future studies can simulate for different levels of adaptation), and that our figures represent a higher threshold rather than an actual prediction, illustrating the maximal levels of health effects if nothing is done or changes in the next seventy years concerning the crucial greenhouse gas emission, health, and social dimensions.
Conclusion
What we contribute to the Turkish public health literature on climate change is first of all the overall confirmation of the U-shaped relationship between old age mortality and monthly maximal temperature data. This is important because it shows that the special mortality sensitivity of extreme heat events is also supported by the Turkish epidemiological evidence, and makes reaching certain conclusions much more possible in the event of broad climate change making extreme events significantly more likely (as we are able to show in the temperature and climate data). Our findings also support the extreme sensitivity of old-age mortality (compared to all other age categories) and the high humidity–high temperature interaction,Footnote 57 which compounds the mortality effect that is observed. The main reason for this is that for the majority of climate-health channels the degree of humidity is a crucial interaction variable that makes the effect of high temperature that much worse.
In terms of the heterogeneity of the effect on Turkey, significant regional differences exist in the mortality effects as well as the age group heterogeneities. Part of the regional heterogeneities can be explained by different regions having different baseline temperature levels. However, other than this within the region-temperature groups the urbanization rates, the provinces’ economic development, and the development of the regional/intraregional public health systems are found to be significant variables that mitigate or exacerbate the baseline temperature effect on mortality patterns.
Understanding the effects that we have identified, the channels that lead to mortality,Footnote 58 and the potential for increasing the climate mitigation capacities of Turkey requires more plentiful multidimensional climate-related data, and work carried out with multidisciplinary research teams to perform true multidisciplinary analysis on the topic of climate vulnerability and climate change readiness.
When discussing basic mitigating adaptation mechanisms, the readiness and capacity of the public health systems that need to deliver health in the face of increasing health risk and uncertainty turn out to be vital, as has been shown by recent events.Footnote 59 In the context of climate change, health policymakers need to think more about not only making the health resources and health infrastructure in Turkey more equal (or more efficiently distributed against climate change effects, which will not be spatially homogeneous), but also making the public health system more resilient to health shocks. The reason we give importance to the interplay between health and extreme heat events in our research is that these events are expected to become more prevalent in the worldFootnote 60 and in our regionFootnote 61 in the second half of the twenty-first century.
In discussing future policy related to improving the climate change resilience of Turkey’s public health system, we stress that these reform programs must be informed by observational studies such as ours and intervention studies that will come out of this. High-value intervention strategies must be based around high-level and rapid identification of high-risk conditions, geographies, and persons. This identification will only be possible by a new perspective in research bringing together spatiotemporal data in the socioeconomic, health, and climate dimensions. In the early part of the twenty-first century it has already become clear that our health systems and populations are more vulnerable than we thought. In order to meet the challenges of the rest of the century we must prioritize this work of identification, systems thinking, and multidimensional research.