INTRODUCTION
Parasite infections often negatively impact the fitness of their hosts, can modulate the dynamics of host populations, and can have consequences for non-host populations through changes in the strength of interspecific competitive relationships (Power and Mitchell, Reference Power and Mitchell2004). Host responses to infection include altering their life-history traits prior to maturity when individuals allocate more resources to reproduction than growth and survival, as this ensures reproduction before resource depletion and/or castration (Michalakis and Hochberg, Reference Michalakis and Hochberg1994; Agnew et al. Reference Agnew, Koella and Michalakis2000). This can affect their reproductive effort (Christe et al. Reference Christe, Richner and Oppliger1996; Sorci et al. Reference Sorci, Morand and Hugot1997) and body size (Arnott et al. Reference Arnott, Barber and Huntingford2000). Understanding these infection consequences for hosts at the individual level then enables understanding of infection impacts at the population and community levels (Pagan et al. Reference Pagan, Alonso-Blanco and Garcia-arenal2008).
In freshwaters, the opportunity for fish parasites to be moved between localities is high due to the introduction pathways of aquaculture, the ornamental fish trade and sport angling (Gozlan et al. Reference Gozlan, Britton, Cowx and Copp2010). Bothriocephalus acheilognathi is a cestode that is originally from Asia (Xiang-Hua, Reference Xiang-Hua2007) that has been introduced around the world through the global aquaculture trade in Asian grass carp Ctenopharyngodon idella and common carp Cyprinus carpio (Salgado-Maldonado and Pineda-López, Reference Salgado-Maldonado and Pineda-López2003). Whilst the parasite has a broad host range, having been recorded in over 200 fish species, pathological consequences appear to be more severe in fishes of the family Cyprinidae (Williams et al. Reference Williams, Poddubnaya, Scholz, Turnbull and Ferguson2011; Linder et al. Reference Linder, Cole, Hoffnagle, Persons, Choudhury, Haro and Sterner2012). It has a complex lifecycle involving an intermediate copepod host and a definitive fish host (Linder et al. Reference Linder, Cole, Hoffnagle, Persons, Choudhury, Haro and Sterner2012). While fish are normally infected by consuming infected copepods, there is some evidence that adult worms can additionally be transmitted directly to piscivorous fish that prey on infected fish (Hansen et al. Reference Hansen, Choudhury and Cole2007). Consequences for fish hosts include damage to the intestinal tract, loss of condition, impacts on foraging behaviours and mortality (Britton et al. Reference Britton, Pegg and Williams2011), with high rates of mortality recorded in hatchery-reared common carp C. carpio (Scholz et al. Reference Scholz, Kutcha, Williams, Woo and Buchmann2012). Non-lethal consequences of B. acheilognathi infection also include changes in trophic ecology. For example, in a population of juvenile C. carpio, application of stable isotope analysis to infected and uninfected individuals suggested infected fish were feeding on items lower in the food web, resulting in energetic consequences (Britton et al. Reference Britton, Pegg and Williams2011).
To date, studies on the trophic ecology of fish infected with B. acheilognathi have focused on single samples taken during a single growth season (e.g. Britton et al. Reference Britton, Pegg and Williams2011). This provides limited knowledge on how their trophic niches vary seasonally and in relation to parasite prevalence and abundance, and how this affects metrics such as growth and condition over longer time periods. This is important, as for many host populations, parasite incidence varies seasonally due to factors, including the interactions of shifts in the abundance of intermediate hosts, the feeding and/ or reproductive activities of final hosts, the reproductive activity of parasites and the immune response to infection (Altizer et al. Reference Altizer, Dobson, Hosseini, Hudson, Pascual and Rohani2006). For example, seasonal changes in levels of B. achileognathi infections, stimulated by changes in water temperature, have been recorded in Gambusia affinis and Pimephales promelas (Granath and Esch, Reference Granath and Esch1983; Riggs et al. Reference Riggs, Lemly and Esch1987). Similar seasonal changes have been observed in other parasite/host systems, for example Öztürk and Altunel (Reference Öztürk and Altunel2006) observed seasonal and annual changes in Dactylogyrus infections across four host species. In chub Squalius cephalus, higher condition factors and seasonal variations in gonado-somatic indices were associated with decreased immune function and corresponding increases in parasite loads, suggesting differences in the seasonal energy allocation between immune function and somatic and/or reproductive investment (Lamkova et al. Reference Lamkova, Simkova, Palikova, Jurajda and Lojek2007).
Given the recorded trophic consequences of B. acheilognathi infection for juvenile C. carpio (Britton et al. Reference Britton, Pegg and Williams2011), the aim of this study was to assess how their non-lethal consequences of infection varied over a 12-month period through tracking a single cohort. The objectives were to: (i) quantify temporal changes in parasite prevalence, abundance, histopathology and the energetic consequences of infection of B. acheilognathi in juvenile C. carpio; and (ii) assess the temporal changes in the trophic ecology and diet of juvenile C. carpio infected and uninfected with B. acheilognathi through stable isotope analysis.
METHODS
Sample collection and initial data collection
The study population was located in the Greater London area of the UK and where B. acheilognathi had been recorded previously. The site was a small pond of 50 m length, 20 m width and maximum depth 1·5 m. The sampling programme covered two summer periods and an over-wintering period, with the initial sample collected in early October 2012 (end of the summer period and end of the 2012 growth season), April 2013 (end of the over-wintering period) and October 2013 (end of the summer period and end of the 2013 growth season). Due to fishery management operations, the mature component of the C. carpio population was removed from the lake after spawning in 2012, thus all remaining carp were young-of-the-year. Consequently, all fish captured in October 2012 were age 0+ and by October 2013 were 1+ years, i.e. the captured fish throughout the study were of the same cohort, with this verified by age analysis of their scales.
The fish were sampled using traps that had a circle alloy frame of length 107 cm, width and height 27·5 cm, mesh diameter 2 mm and with funnel shaped holes of 6·5 cm diameter at either end to allow fish entry and hence their capture. They were each baited with five fishmeal pellets of 21 mm diameter were placed in the trap as an attractant (Dynamite Baits 2015). Alternative sampling methods were trialled initially (seine nets and electric fishing), but were unsuccessful due to the presence of underwater structures (nets) and heavy growth of Phragmites australis in the littoral zone (electric fishing). On each sampling occasion, 10 traps were set in the littoral zone at approximately 18·00 h and lifted at 09·00 h the next morning.
After the traps were lifted, all the juvenile C. carpio were removed and transferred to water-filled containers and a random sub-sample of 25 individuals was taken and transported to the laboratory for processing. As the fish were sampled from a private fishery, the numbers were limited in order to minimize the impact on the future angling stock, as agreed with the fishery managers. In April 2013 and October 2013, samples of the putative food resources of the fish were also taken, covering macro-invertebrates (through kick sampling and sweep netting with a handnet of 0·25 mm mesh), zooplankton (through filtering 10 litres of water through a net and filter of 250 µm) and phytoplankton (filtering 10 litres of water through a net and filter of 53 µm). For macro-invertebrates, triplicate samples were taken, where a sample represented between 5 and 20 individuals of that species. Putative food resource samples were not able to be collected in October 2012 due to logistical constraints.
In the laboratory, all fish were euthanized (anaesthetic overdose; MS-222), with weight (W; to 0·01 g), and fork length (L; nearest mm) recorded. A detailed post-mortem was then conducted on each individual for detecting the presence of infections of native and non-native parasites using a standard protocol adapted from Hoole et al. (Reference Hoole, Bucke, Burgess and Wellby2001). Skin scrapes and internal organs were examined with aid of low- and high-power microscopy to enable parasite identification. The entire digestive tract was removed and examined under low power for detecting the presence of intestinal parasites, including B. acheilognathi. When B. acheilognathi was recorded, their abundance was recorded (by number and mass to nearest 0·001 g). Hereafter, where an individual C. carpio is referred to as either infected or non-infected, it refers to the presence/absence of B. acheilognathi in that individual during this process. Intestinal tissue from infected and uninfected individuals was retained and prepared for histopathology.
On completion of the post-mortem, a sample of dorsal muscle was taken from a proportion of the fish samples (sample sizes 6–15 per sub-set of fish per population). These, and the macro-invertebrate, zooplankton and phytoplankton samples, were then dried at 60 °C to constant weight before being analysed for their stable isotopes of 13C and 15N at the Cornell Stable Isotope Laboratory (New York, USA). The initial stable isotope data outputs were in the format of delta (δ) isotope ratios expressed per mille (‰).
Histopathology
Histopathology of the intestinal tract was completed to assess the pathological changes associated with B. acheilognathi infection. Sections of intestine were sampled from infected as well as uninfected fish. These sections were fixed in Bouin's fixative for 24 h before transferring to 70% Industrial Methylated Spirit. The tissues were trimmed, dehydrated in alcohol series, cleared and then embedded in paraffin wax. Transverse and longitudinal sections of 3 µm were dried at 50 °C, stained using Mayer's haematoxylin and eosin, and examined microscopically for pathological changes and described accordingly.
Data analyses
Infection levels of B. acheilognathi in C. carpio were described as their prevalence (number of infected individuals/total number of individuals × 100) and abundance (number of B. acheilognathi per host). The mass of parasite was also expressed as a proportion of host weight to represent the parasite burden. The stable isotope data of C. carpio were used to assess their trophic niche size and predict their diet composition from the putative food resource data. Trophic niche size was calculated using the metric standard ellipse area (SEAc) in the SIAR package (Parnell et al. Reference Parnell, Inger, Bearhop and Jackson2010) in R (R Core Development Team, 2013). SEAc is a bivariate measure of the distribution of individuals in trophic space, where each ellipse encloses ~40% of the data and thus represents the core dietary niche of species and so indicates their typical resource use (Jackson et al. Reference Jackson, Inger, Parnell and Bearhop2011, Reference Jackson, Donohue, Jackson, Britton, Harper and Grey2012). The subscript ‘c’ in SEAc indicated that a small sample size correction was used due to limited sample sizes (<30). For each population of C. carpio on each survey date, SEAc was calculated for two sub-sets of individuals: those infected with B. acheilognathi and those uninfected, and the extent of the overlap of their niches determined (%).
To then predict the diet composition of each sub-set of fish, their stable isotope data, plus those of their putative food resources, were applied to Bayesian mixing models that estimated the relative contribution of each putative food resource to the diet of each individual C. carpio (Moore and Semmens, Reference Moore and Semmens2008). The models were run using the MixSIAR GUI package in the R computing program (R Core Development Team, 2013; Stock and Semmens, Reference Stock and Semmens2013). Given that excessive putative food resources can cause mixing models to underperform, the data for resources with similar isotope values were combined a priori, whilst respecting the taxon and functional affiliation of the individual species (Phillips et al. Reference Phillips, Newsome and Gregg2005). The groups used in the models were arthropods, zooplankton (i.e. samples captured in the net of mesh size 250 µm) and phytoplankton (i.e. samples captured in the net of mesh size 53 µm). Isotopic fractionation factors between resources and consumers in the models were 3·4‰ (±0·98‰) for δ 15N and 0·39‰ (±1·3‰) for δ 13C (Post, Reference Post2002). Outputs were the predicted proportion of each resource to host diet (0–1).
Statistical analyses
For each fish species and population infected with B. acheilognathi, differences between the infected and uninfected hosts were tested for length, and their stable isotopes of δ 13C and δ 15N using analysis of variance (ANOVA). Condition was calculated as Fulton's Condition Factor (K, 100 × W/L 3) where L was measured in cm, with differences between infected and uninfected fishes also tested using ANOVA. Differences between the predicted proportions of each putative food source to the diet of infected and uninfected fish were also tested using ANOVA. Other than the stable isotope mixing models, all analyses were completed in SPSS v. 22·0. In all analyses, the assumptions of normality of residuals and homoscedasticity were checked prior to use. Where error is expressed around the mean, it represents standard error.
RESULTS
Parasite prevalence and abundance
Across the three sampling periods, parasite prevalence remained relatively constant (61, 58 and 60% in October 2012, April 2013 and October 2013, respectively; Table 1). Parasite abundance was greatest in October 2012 (mean 10·7 ± 2·3) and lowest in April 2013 (mean 5·4 ± 1·5) (Table 1). Parasite abundance was significantly different between October 2012 and April 2013 (ANOVA: F 1,45 = 9·38, P < 0·01) but not between April 2013 and October 2013 (ANOVA: F 1,45 = 1·22, P > 0·05), and October 2012 and October 2013 (ANOVA: F 1,45 = 4·05, P > 0·05). Mean parasite burden was greatest in October 2012 (3·9 ± 0·8%) and lowest in October 2013 (1·7 ± 0·5%). There was a significant difference between the parasite burdens in October 2012 and October 2013 (ANOVA: F 1,45 = 5·85, P < 0·05), but not between October 2012 and April 2013 (ANOVA: F 1,45 = 1·92, P > 0·05) and April 2013 and October 2013 (ANOVA: F 1,45 = 0·22, P > 0·05) (Table 1). Of other parasites recorded these were all native species that would be considered as the expected parasite fauna of these fishes in a UK community and were recorded at levels that were considered as not high enough to cause clinical pathology (Hoole et al. Reference Hoole, Bucke, Burgess and Wellby2001).
Prevalence and abundance of Bothriocephalus acheilognathi by sampling date

Histopathology
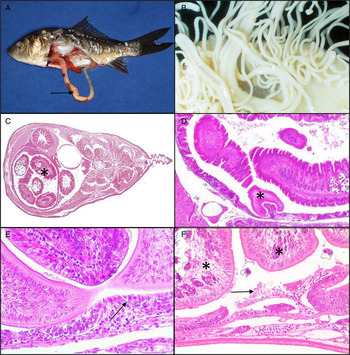
Histopathological examinations revealed consistent pathological changes associated with B. acheilognathi infection. The presence of B. acheilognathi within the gut of infected carp was usually evident prior to dissection of the intestine, with the mass of pale tapeworms visible through the distended gut wall (Fig. 1A). Dissection of the intestinal tract revealed attachment sites of B. acheilognathi within the anterior region of the tract with mass of proglottids filling a large proportion of the gut lumen (Fig. 1B and C). Heavy infections caused near complete occlusion of the intestinal tract. Histopathological observations confirmed thinning and compression of the gut wall with displacement of internal organs, including the swim bladder (Fig. 1C). During attachment, the scoleces of B. acheliognathi engulfed the intestinal folds, leading to marked compression of the epithelium (Fig. 1D). At the point of attachment, the intestine was severely compressed, with loss of normal gut architecture, loss of epithelium and near exposure of the basement membrane (Fig. 1E and F). Infection was frequently accompanied by an increase in lymphocytes throughout the epithelium and lamina propria (Fig. 1E) compared with uninfected fish. In very heavy infections, pressure exerted by the mass of parasites within the intestine caused thinning of the musculature and forced the gut wall against the inside of the body cavity (Fig. 1F).
(A) Bothriocephalus acheilognathi infection in juvenile common carp, with resulting pale distended intestine. (B) Attachment of multiple B. acheilognathi within the intestine, many with mature proglottids. (C) Transverse section through juvenile carp showing B. acheilognathi occupying the anterior intestine (*), with compression of the gut wall and displacement of internal organs, including the swim bladder. (D) B. acheilognathi attachment site showing the scolex (*) pinching the gut wall and flattening of normal intestinal folds throughout infected regions of the gut. (E) Pronounced compression of epithelium at the apex of scolex attachment, with loss of epithelium, thinning of musculature and near exposure of the basement membrane (arrow). Lymphocytes may be seen within the lamina propria (F) Flattening of intestinal folds with epithelial erosion (arrow) as a consequence of pressure exerted by the body of tapeworms (*) within the intestine.

Effect of infection on fish length and condition
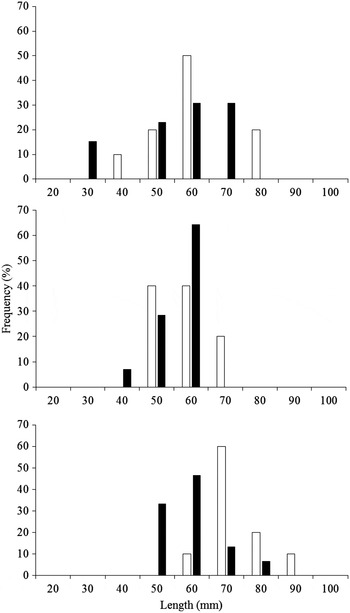
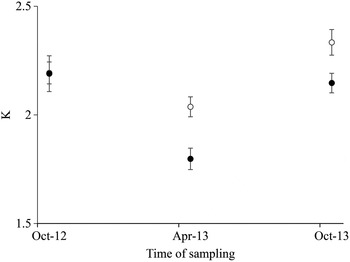
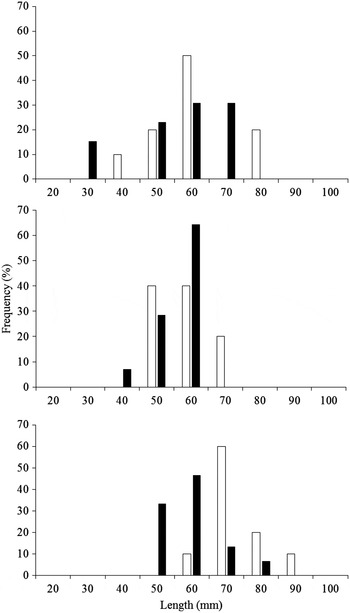
There was no significant difference in lengths of the uninfected and infected fish sampled in October 2012 and April 2013 (ANOVA: October 12: F 1,21 = 1·04, P > 0·05; April 13: F 1,22 = 2·31, P > 0·05; Fig. 2). In October 2013, however, the uninfected fish were significantly larger than infected fish (ANOVA: October 13: F 1,23 = 14·38, P < 0·01; Fig. 2). Whilst there were no significant differences in the condition (K) of infected and uninfected C. carpio in October 2012 (ANOVA: F 1,21 = 0·00, P > 0·05), there was in April 2013 (ANOVA: F 1,22 = 11·68, P < 0·01) and this significant difference remained in October 2013 (ANOVA: F 1,23 = 6·57, P < 0·05) (Fig. 3).
Length frequency histograms of infected (black) and uninfected (white) C. carpio. (A) October 2012, n = 23; (B) April 2013, n = 24; and (C) October 2013, n = 25.
Fulton's condition factor (K) of infected (black circles) and uninfected (white circles) C. carpio over the study period. Error bars represent standard error.

Stable isotope metrics
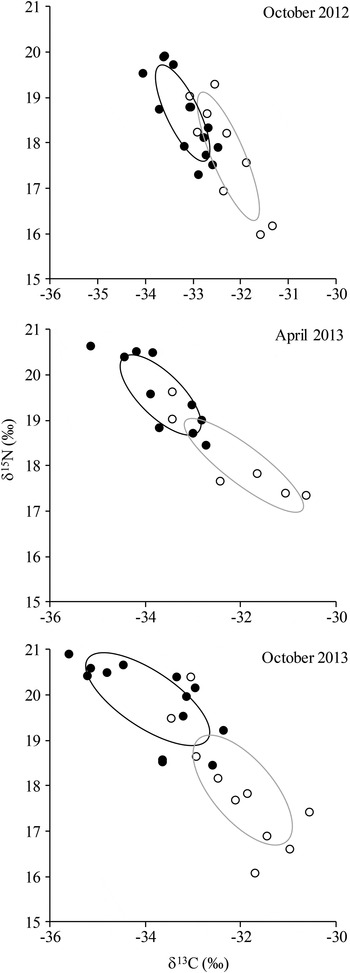
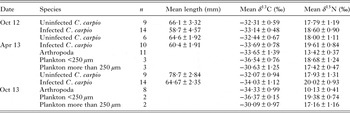
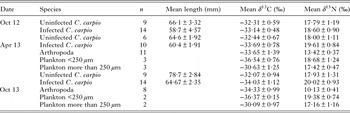
The mean values of δ 13C and δ 15N of the infected and uninfected fish were significantly different in April 2013 (ANOVA δ 13C: F 1,22 = 10·62, P < 0·01, δ 15N: F 1,22 = 10·94, P < 0·01) and October 2013 (ANOVA δ 13C: F 1,23 = 20·88, P < 0·01, δ 15N: F 1,23 = 21·77, P < 0·01) (Table 2). By contrast, in October 2012, only δ 13C was significantly different between the groups (ANOVA δ 13C: F 1,21 = 13·83, P < 0·01, δ 15N: F 1,21 = 3·39, P > 0·05) (Fig. 4). In all cases where differences between the isotopes of the groups were significant, the infected fish had enriched δ 15N and depleted δ 13C.
Trophic niche width (as SEAc) of infected and uninfected C. carpio sampled in (A) October 2012, (B) April 2013 and (C) October 2013. The black circles mark the infected individuals and the black line the SEAc of infected individuals. The white circles mark the uninfected individuals and the grey line represents the SEAc of uninfected individuals.

Sample size, mean lengths of sub-sampled fish and mean stable isotope data
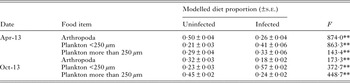
The outputs of the mixing models predicting the diet composition of the uninfected and infected fish revealed some significant differences between the two groups (Table 3). In both April and October 2013, infected fish were predicted to have a significantly higher proportion of plankton <250 µm in their diet compared with uninfected fish (mean 41 ± 6% in April and 57 ± 2% in October; ANOVA April: F 1,22 = 863·33, P < 0·01, October: F 1,23 = 372·70, P < 0·01). Arthropoda were predicted to comprise a significantly higher proportion of the diets of uninfected fish on both sampling dates (mean 50 ± 4% in April and 32 ± 3% in October; ANOVA April: F 1,22 = 874·04, P < 0·01, October: F 1,23 = 173·33, P < 0·01). Plankton > 250 µm made up a smaller proportion of the diet of uninfected fish than infected fish in April (29 ± 4% cf. 33 ± 6%; ANOVA F 1,22 = 143·43, P < 0·01) and a larger proportion in October (45 ± 2% cf. 24 ± 2%; ANOVA F 1,23 = 448·76, P < 0·01) (Table 3).
Summary of the Bayesian mixing models outputs predicting the proportions of each major food item to the diet of infected and uninfected fish on each sample occasion, and the F value from ANOVA, where **P < 0·01
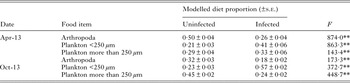
Values of the predicted proportions represent their mean and standard error. Sample sizes as Table 2.
DISCUSSION
Sampling of the juvenile fish over the 12 month period revealed that infection by B. acheilognathi resulted in the development of long-term pathological and ecological consequences. Although the hosts sampled at the end of their first summer revealed little difference in lengths and condition compared with their uninfected conspecifics, the outputs of stable isotope analysis revealed they already had a significantly different diet composition. The condition of infected fish was significantly reduced after their first winter and by the end of their second summer, they were significantly smaller than uninfected fish and remained in significantly reduced condition. The diet of these two sub-sets of fish also remained significantly different over this time.
Other studies on B. acheilognathi have also suggested that infection causes a range of foraging consequences for hosts, including impairment of their ability to capture prey (Scott and Grizzle, Reference Scott and Grizzle1979; Britton et al. Reference Britton, Pegg and Williams2011, Reference Britton, Pegg, Baker and Williams2012; Scholz et al. Reference Scholz, Kutcha, Williams, Woo and Buchmann2012). The shift towards foraging on less motile, more easily available food sources by hosts has also been observed in other parasitized populations. For example, the freshwater amphipod Gammarus roeseli infected with the acanthocephalan Polymorphus minutus (as an intermediate host) consumed equivalent numbers of dead isopods as uninfected conspecifics, but fewer live isopods (Medoc et al. Reference Medoc, Rigaud, Motreuil, Perrot-Minnot and Bollache2011). In stickleback Gasterosteus aculeatus, parasitism by the cestode Schistocephalus solidus tends to lead to selection of smaller prey items (Barber et al. Reference Barber, Huntingford and Crompton1995). Shifts in host feeding behaviours arise through a variety of mechanisms; for example, parasites utilize energy reserves of their hosts, infection may increase metabolic costs or be associated with increases in energetically demanding immune functions (Barber et al. Reference Barber, Hoare and Krause2000). Hosts infected with strongly debilitating parasites may also exhibit reduced activity levels that impact foraging behaviours (Britton et al. Reference Britton, Pegg and Williams2011; Britton, Reference Britton2013). Thus, infection consequences frequently manifest as changes in energy budgets expenditure and, subsequently, appetite, foraging and diet composition (Barber et al. Reference Barber, Hoare and Krause2000). Moreover, in fish populations, the frequency distribution of phenotypic trait values often follows a normal distribution, reflecting genotypic differences and environmental noise, but parasitic infection can shift the mean value of traits, increasing their variance at the population level (Poulin and Thomas, Reference Poulin and Thomas1999). This was apparent in the C. carpio of our study where the increase in the trophic niche size of the host population was related to it comprising two, almost discrete niches that corresponded with uninfected and infected fish.
Over the study period, temporal changes were also detected in parasite burden. These tended to reduce over time, despite being sufficient to incur pathological and ecological consequences. Although this reduction might relate to the mortality of hosts with high parasite abundances, seasonal shifts in aspects of fish parasite infections are often apparent in temperate regions due to its influence on the behaviours, habitat utilization and immune responses of potential hosts (Bromage et al. Reference Bromage, Porter and Randall2001; Bowden et al. Reference Bowden, Thompson, Morgan, Gratacap and Nikoskelainen2007). Given these can vary between host species then parasite prevalence and abundance can show considerable variability across species within communities. For example, in reservoirs in North Carolina, USA, B. acheilognathi abundance was highest in fathead minnow P. promelas and red shiner Notropis lutrensis in autumn, whereas it was highest in winter in mosquito fish G. affinis (Riggs et al. Reference Riggs, Lemly and Esch1987). For parasites whose transmission to final hosts is through trophic links, the phenology of intermediate hosts is also important, with seasonal changes in copepod communities identified as a driver of the different infection levels of B. acheilognathi observed in fish host communities (Riggs et al. Reference Riggs, Lemly and Esch1987). Temporal and spatial changes in the definitive host infection level that result from varying transmission success due to shifts in the dynamics of intermediate host populations have also been recorded across a range of fishes and their parasites (Amundsen et al. Reference Amundsen, Knudsen, Kuris and Kristoffersen2003; Jiménez-Garcia and Vidal-Martínez, Reference Jiménez-Garcia and Vidal-Martínez2005).
The divergence in the lengths of the infected and uninfected fish that developed over time has the potential to restrict host fitness, as in most fish species, maturation is associated with size and thus faster growing individuals will mature earlier in life (Scott, Reference Scott1962; Bagenal, Reference Bagenal1969; Ali and Wootton, Reference Ali and Wootton1999). Furthermore, larger fish are more fecund, and thus contribute more to the population (Hislop, Reference Hislop1988; Beldade et al. Reference Beldade, Holbrook, Schmitt, Planes, Malone and Bernardi2012). Whilst a reduction in growth associated with parasitism has been recorded in a variety of species, such as the rainbow smelt Osmerus mordax infected by protocephalid parasites (Sirois and Dodson, Reference Sirois and Dodson2000), and farmed and wild salmonids infected with sea lice (e.g. Lepeophtheirus salmonis) (Costello, Reference Costello2006), it is not the universal response to parasitism (Loot et al. Reference Loot, Brosse, Lek and Guegan2001). Indeed, rapid growth aligned with parasitic castration in hosts is the response recorded in other cestode parasites, such as Ligula intestinalis (Thompson and Kavaliers, Reference Thompson and Kavaliers1994; Loot et al. Reference Loot, Brosse, Lek and Guegan2001) and S. solidus (Arnott et al. Reference Arnott, Barber and Huntingford2000; Barber et al. Reference Barber, Hoare and Krause2000).
In summary, significant differences in the condition and body lengths of infected and uninfected populations developed over the course of the study, with histopathology revealing substantial local damage in the intestine of hosts. Analyses then revealed the diet composition of the infected fish was predicted to comprise of a significantly higher proportion of smaller items (<53 µm) than uninfected fish. Thus, it was demonstrated that in this cohort of juvenile C. carpio, sub-lethal impacts of parasitism included substantial histopathological consequences that resulted in significant growth and trophic impacts whose development could have been overlooked had the temporal context of the study been lacking. It is thus especially important to investigate the temporal influence of parasitism in any evaluation of potential parasite impacts on trophic niche and condition of the host.
ACKNOWLEDGEMENTS
We thank the fishery owner and angling club who gave permission for fish to be sampled on their water. We thank Environment Agency employees for their assistance in obtaining consents for sampling and advising on suitable sites.
FINANCIAL SUPPORT
J.P. was funded by a Fisheries Society of the British Isles Ph.D. studentship and Bournemouth University. D.A. and J.R.B. were supported by Bournemouth University. C.W. was funded by the Environment Agency. This study was supported through in-kind support from the Environment Agency.
Views expressed in the paper are those of the authors and not their parent organizations.