1 Introduction
As noted in Appel (Reference Appel2004) and Helfrich & Melville (Reference Helfrich and Melville2006), internal waves are known to be a common feature in coastal oceanic flows. Resulting from instabilities along pynoclines and thermoclines, internal waves with amplitudes from 5–100 m have been observed (Osborne & Burch Reference Osborne and Burch1980; Appel Reference Appel2004; Helfrich & Melville Reference Helfrich and Melville2006). While several generation mechanisms have been proposed and studied, it appears that in most cases internal waves are generated in coastal regions due to the presence of tide induced shearing forces in stratified fluids moving over varying bathymetry (Farmer & Armi Reference Farmer and Armi1999; Helfrich & Melville Reference Helfrich and Melville2006). What is interesting though is that, while depth varying shear currents should be anticipated in such environments, most modelling attempts have traditionally ignored the impact of vorticity on internal wave dynamics. This work will address this shortcoming in part by studying the impact of depth varying shear currents on the existence and flow properties of internal travelling wave solutions (TWSs) in density stratified environments.
While the impact of vorticity on internal waves is not well understood, a great deal of work on the influence of shear in free-surface flows has appeared. The simplest case of free surfaces moving over depth varying currents is when the vorticity is assumed to be a constant throughout the fluid. The literature on this subject is too vast to address here, although we point out the seminal studies of Simmen & Saffman (Reference Simmen and Saffman1985), da Silva & Peregrine (Reference da Silva and Peregrine1988), Vanden-Broeck (Reference Vanden-Broeck1994) and the extensive bibliography in Constantin (Reference Constantin2011). We also note that a key part of the approach we take in this paper follows the work in Ashton & Fokas (Reference Ashton and Fokas2011), which in part makes use of the unified transform method (UTM) pioneered in Fokas (Reference Fokas2008).
Perhaps surprisingly, there are still outstanding and significant issues even for constant vorticity flows. In particular, the impact of vorticity on the stability of travelling wave solutions is not fully understood. As shown in Oliveras, Sprenger & Vasan (Reference Oliveras, Sprenger and Vasan2016), vorticity modifies the amplitudes of Benjamin–Feir (BF) instabilities depending on the sign of the vorticity. Similar results have analytically been found in approximate models (Choi Reference Choi2009; Thomas, Kharif & Manna Reference Thomas, Kharif and Manna2012; Hur & Johnson Reference Hur and Johnson2015). In addition, constant vorticity introduces ‘high-frequency’ instabilities similar to those observed in irrotational waves (see McLean Reference McLean1982b ; Francius & Kharif Reference Francius and Kharif2006; Deconinck & Oliveras Reference Deconinck and Oliveras2011). These instabilities may be more dominant than the BF instability depending on the amplitude of the TWS and the strength of the linear shear as shown in Oliveras et al. (Reference Oliveras, Sprenger and Vasan2016). Furthermore, for a TWS with a region of lower pressure trapped under the wave (da Silva & Peregrine Reference da Silva and Peregrine1988; Vasan & Oliveras Reference Vasan and Oliveras2014), new instabilities, perhaps related to a Rayleigh–Taylor instability, are visible in the spectrum. As shown in Vasan & Oliveras (Reference Vasan and Oliveras2014), the existence of these low pressure regions is directly related to the existence of stagnation points within the fluid. While usually avoided in much of the existing literature due to the analytic difficulties they introduce, it is becoming clearer that stagnation points can have significant impacts on wave shape and stability. Thus, in part due to stagnation point induced low pressure regions, and in part due to high-frequency instabilities, no TWSs have been found which are stable to all perturbations despite the ability of a constant shear current to suppress the onset of BF instabilities.
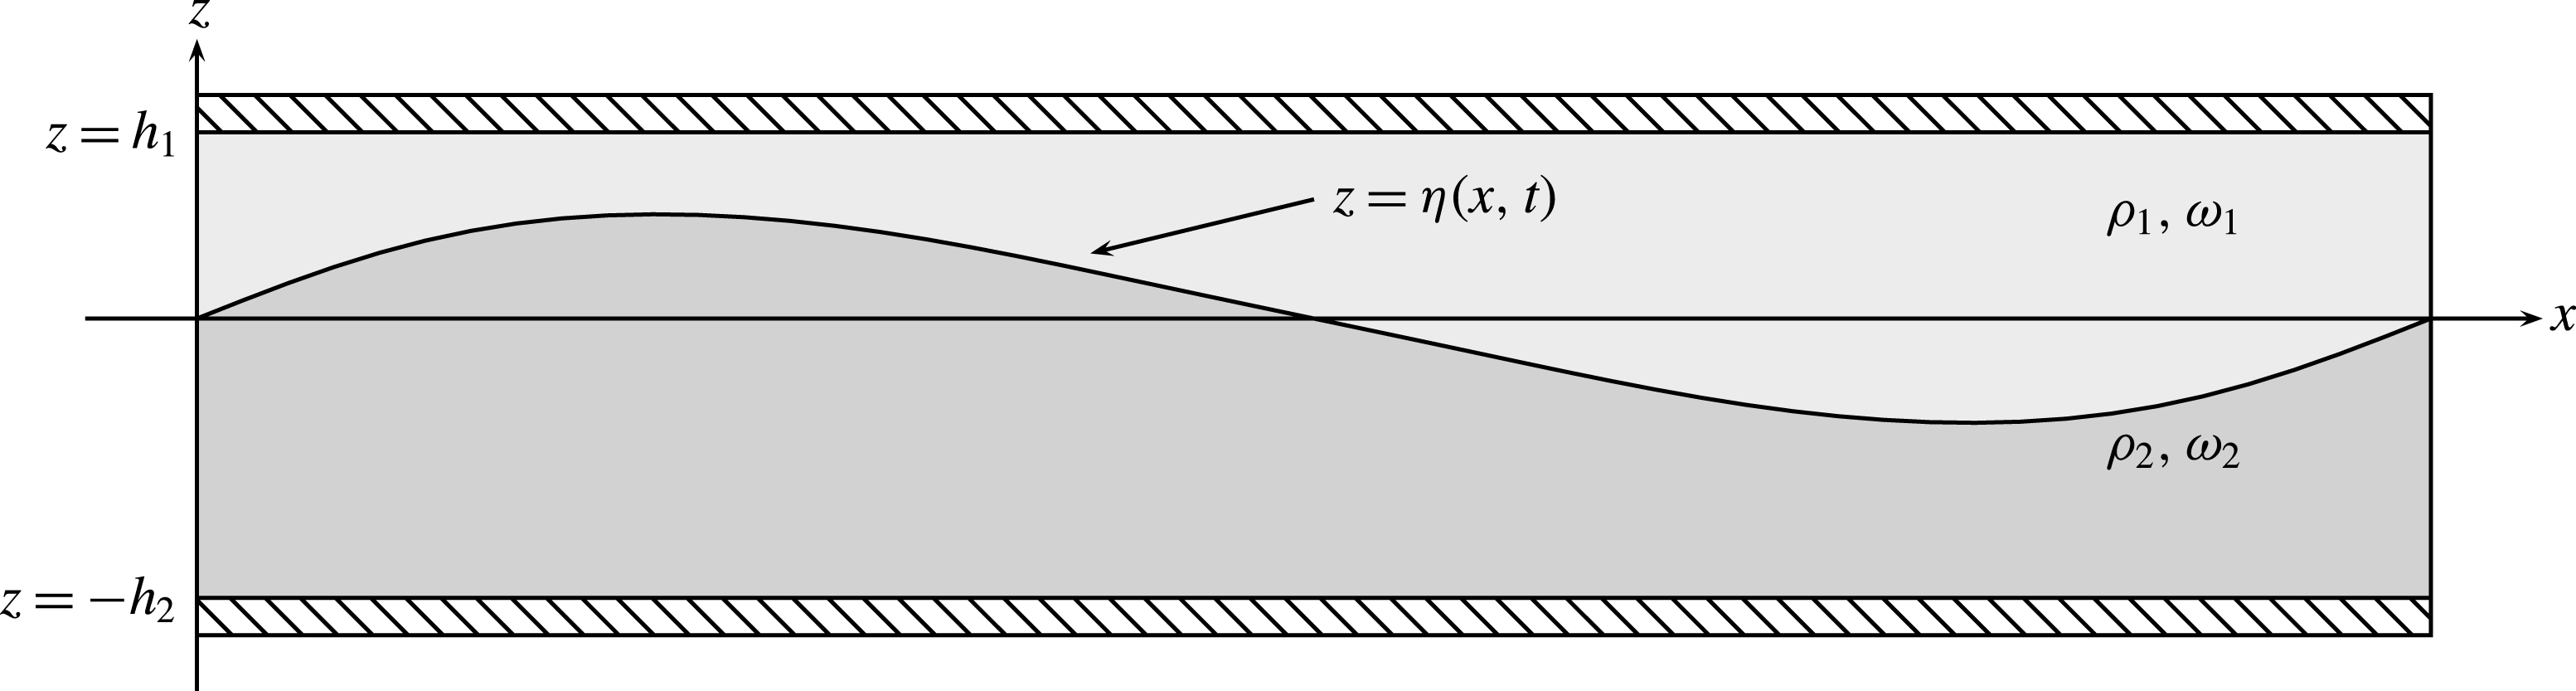
Given these results for constant vorticity, it is interesting then to ask how depth variation in the vorticity affects the existence of these instabilities, and whether more complicated shear profiles will support the existence of stable internal or even free-surface travelling waves. The case of non-constant vorticity flows has received far less attention. For the case of non-steady waves, this was first examined in Dalrymple (Reference Dalrymple and Edge1974) for a stratified fluid with two differing densities
 $\unicode[STIX]{x1D70C}_{1}$
and
 $\unicode[STIX]{x1D70C}_{2}$
and two differing constant vortices
 $\unicode[STIX]{x1D714}_{1}$
and
 $\unicode[STIX]{x1D714}_{2}$
. We refer to such fluids as bistratified; see figure 1 for reference. More recently, such systems have been looked at experimentally and numerically (Swan, Cummins & James Reference Swan, Cummins and James2001; Ko & Strauss Reference Ko and Strauss2008). Assuming a rigid lid and zero vorticity, i.e.
 $\unicode[STIX]{x1D714}_{2}=0$
, in the lower fluid region, nonlinear, large amplitude travelling interfacial waves for bistratified fluids were studied (see Pullin & Grimshaw Reference Pullin and Grimshaw1983, Reference Pullin and Grimshaw1988). A complete characterization of the linear stability of the small amplitude limit of these waves was presented in Pullin & Grimshaw (Reference Pullin and Grimshaw1986). Generalizing this work, the evolution of a free surface and a free internal layer for a bistratified fluid in a shallow-water approximation was studied in Curtis, Oliveras & Morrison (Reference Curtis, Oliveras and Morrison2016). Significant nonlinear phenomena like internal dispersive shock waves as a result of bistratification was reported for the first time.
Fluid domain for the rigid lid problem.

Focusing then on the case of single-valued internal layers, by assuming a rigid lid at the fluid–air interface and an impermeable sea bed, using the UTM techniques (Haut & Ablowitz Reference Haut and Ablowitz2009; Ashton & Fokas Reference Ashton and Fokas2011) and incorporating techniques developed for travelling wave solutions (Oliveras & Vasan Reference Oliveras and Vasan2013), we derive a closed system describing the evolution of the free internal surface in a bistratified fluid. Using this formulation, we can analytically determine at which wave speeds bifurcations from flat states will occur. By developing a Stokes expansion at this bifurcation point, we can analytically determine the behaviour of the bifurcation curve in terms of wave height and speed in a small-amplitude limit, thereby allowing for a better understanding of when stagnation points in the fluid velocity appear and when turning points in bifurcation curves appear.
We then use numerical continuation to generate bifurcation curves which provide the speed–amplitude relationship for the travelling nonlinear interfacial waves. Of particular interest is the role different choices of vorticities play in determining the number of stagnation points within the fluid regions, and how these stagnation points influence the shape and properties of the interfacial TWSs. As we show, the position and number of stagnation points determines whether waves are elevated, depressed, symmetric in nature or especially peaked. To complement these results, we also present plots of the streamlines to help illustrate the different impacts on the dynamics that the stagnation points have throughout the bulk of the fluid as well as on the interface.
Finally, we study the stability of various TWSs. One of the most striking features associated with bistratification is the complicated relationship between the appearance of modulational instabilities (MIs) and the choices of the shear strength and depth ratio of the layers. As we show, by making the ratio of the depths of the two layers large enough, MIs appear to be completely suppressed. However, we also show results in which MIs are introduced and suppressed by shear, thereby illustrating the complicated balances mediated by nonlinearity between these parameter choices. These results generalize and expand on those for constant vorticity in single-layer fluids, in which vorticity is shown to strongly influence whether MIs exist (Pullin & Grimshaw Reference Pullin and Grimshaw1986; Thomas et al. Reference Thomas, Kharif and Manna2012; Oliveras et al. Reference Oliveras, Sprenger and Vasan2016).
However, at least for the solutions examined in this paper, all travelling solutions are unstable with respect to higher-frequency perturbations corresponding to resonant interactions (or
 $n$
-wave mixing). Given the more complicated nature of the physical problem studied in this paper, it is a non-trivial question to determine if all travelling wave solutions are unstable, especially given the stabilizing mechanisms we illustrate via our numerical result. Likewise, the complex nature of instabilities for multi-valued interfaces remain unknown and will be explored in future work.
The structure of the paper is as follows. The derivation of our model is given in § 2. The computation of the TWSs and analytic derivations of the nonlinear impact on wave speed and the presence of stagnation points are given in § 3. Section 4 explains the means by which we numerically determine the stability of the TWSs computed in this paper, and § 5 contains the results of these stability computations. Concluding remarks appear in § 6, and the appendices collect the technical details used throughout the paper.
2 Boundary conditions and AFM formulation
We assume the flow is incompressible in each region in a frame of reference moving to the right with speed
 $c$
. The resulting equations must satisfy Euler’s equations in the bulk:
 $$\begin{eqnarray}\displaystyle & \displaystyle \unicode[STIX]{x1D735}\boldsymbol{\cdot }\boldsymbol{u}_{j}=0, & \displaystyle\end{eqnarray}$$
 $$\begin{eqnarray}\displaystyle & \displaystyle \unicode[STIX]{x2202}_{t}\boldsymbol{u}_{j}+(\boldsymbol{u}_{j}\boldsymbol{\cdot }\unicode[STIX]{x1D735})\boldsymbol{u}_{j}=-\frac{1}{\unicode[STIX]{x1D70C}_{j}}\unicode[STIX]{x1D735}p_{j}-g\hat{\boldsymbol{z}}, & \displaystyle\end{eqnarray}$$
where
 $\boldsymbol{u}_{j}=(u_{j}-c,w_{j})^{\text{T}}$
and
 $j=1,2$
correspond to the fluid velocities in the top and bottom layer of the fluid respectively,
 $p_{j}=p_{j}(x,z)$
is the pressure at any point within each fluid,
 $\unicode[STIX]{x1D70C}_{j}$
is the density of each fluid and
 $g$
is the constant acceleration due to gravity.
At the interface between each fluid, we require continuity in pressure, as well as continuity in the normal velocities of each fluid at the interface. This provides the boundary conditions
 $$\begin{eqnarray}p_{1}=p_{2}\quad \text{and}\quad \boldsymbol{u}_{1}\boldsymbol{\cdot }\boldsymbol{N}=\boldsymbol{u}_{2}\boldsymbol{\cdot }\boldsymbol{N}\quad \text{at }z=\unicode[STIX]{x1D702}(x,t),\end{eqnarray}$$
where
 $\boldsymbol{N}$
represents a unit normal vector to the interface defined by
 $z=\unicode[STIX]{x1D702}(x,t)$
. Furthermore, the interface is evolved by the fluid velocities normal to the interface. That is,
 $$\begin{eqnarray}\unicode[STIX]{x1D702}_{t}=\boldsymbol{u}_{j}\boldsymbol{\cdot }\boldsymbol{N},\end{eqnarray}$$
for
 $j=1$
or
 $j=2$
as they are equivalent. Finally, the rigid lid and solid boundary conditions require
 $$\begin{eqnarray}v_{1}=0\quad \text{at }z=h_{1},\quad v_{2}=0\quad \text{at }z=-h_{2}.\end{eqnarray}$$
2.1 A non-local formulation
Equations (2.1)–(2.5) represent the equations we wish to solve provided that there is a constant linear shear within each fluid domain. That is, that
 $$\begin{eqnarray}\unicode[STIX]{x2202}_{x}w_{j}-\unicode[STIX]{x2202}_{z}u_{j}=\unicode[STIX]{x1D714}_{j}\end{eqnarray}$$
within each fluid where we have chosen a particular sign convention for the vorticity consistent with conventions used elsewhere in the literature (see da Silva & Peregrine Reference da Silva and Peregrine1988; Ko & Strauss Reference Ko and Strauss2008). A disadvantage of the above formulation is that it requires one to solve for the velocities and pressure within the bulk of each fluid as well as the interface separating the two fluids. In our work, we choose to cast the equations of motion using a non-local reformulation that allows us to work completely within the context of variable defined at the interface. Here we follow the work of Haut & Ablowitz (Reference Haut and Ablowitz2009), Ashton & Fokas (Reference Ashton and Fokas2011) in order to recast the problem into variables defined at the interface. However, to take advantage of this formulation, we first pose (2.1)–(2.5) in terms of new bulk variables.
Let
 $\unicode[STIX]{x1D713}_{j}$
for
 $j=1,2$
represent the streamfunctions in the top and bottom layer of the fluid respectively. Furthermore, we introduce the functions
 $\unicode[STIX]{x1D719}_{j}$
for
 $j=1,2$
to represent the contributions to the velocity from potential flow. Thus, we can write the fluid velocities as
 $$\begin{eqnarray}\left(\begin{array}{@{}c@{}}\displaystyle u_{j}-c\\ \displaystyle w_{j}\end{array}\right)=\left(\begin{array}{@{}c@{}}\displaystyle \unicode[STIX]{x2202}_{x}\unicode[STIX]{x1D719}_{j}-\unicode[STIX]{x1D714}_{j}z\\ \displaystyle \unicode[STIX]{x2202}_{z}\unicode[STIX]{x1D719}_{j}\end{array}\right)=\left(\begin{array}{@{}c@{}}\displaystyle \unicode[STIX]{x2202}_{z}\unicode[STIX]{x1D713}_{j}\\ \displaystyle -\unicode[STIX]{x2202}_{x}\unicode[STIX]{x1D713}_{j}\end{array}\right).\end{eqnarray}$$
Using (2.1)–(2.5), the streamfunctions and potential functions satisfy
 $$\begin{eqnarray}\displaystyle & \displaystyle \unicode[STIX]{x0394}\unicode[STIX]{x1D719}_{j}=0,\quad (x,z)\in D_{j}, & \displaystyle\end{eqnarray}$$
 $$\begin{eqnarray}\displaystyle & \displaystyle \unicode[STIX]{x0394}\unicode[STIX]{x1D713}_{j}=-\unicode[STIX]{x1D714}_{j}\quad (x,z)\in D_{j}, & \displaystyle\end{eqnarray}$$
 $$\begin{eqnarray}\displaystyle & \displaystyle \unicode[STIX]{x2202}_{t}\unicode[STIX]{x1D719}_{j}+\unicode[STIX]{x1D714}_{j}\unicode[STIX]{x1D713}_{j}+\frac{1}{2}|\unicode[STIX]{x1D735}\unicode[STIX]{x1D719}_{j}-\unicode[STIX]{x1D714}_{j}z\,\hat{\boldsymbol{x}}|^{2}+\frac{p_{j}}{\unicode[STIX]{x1D70C}_{j}}+gz=0,\quad (x,z)\in D_{j} & \displaystyle\end{eqnarray}$$
within the bulk of each fluid.
Remark 1. In integrating (2.2) within the fluid domain to find (2.10), we arrive at an equation of the form
 $$\begin{eqnarray}\unicode[STIX]{x2202}_{t}\unicode[STIX]{x1D719}_{j}+\unicode[STIX]{x1D714}_{j}\unicode[STIX]{x1D713}_{j}+\frac{1}{2}|\unicode[STIX]{x1D735}\unicode[STIX]{x1D719}-\unicode[STIX]{x1D714}_{j}z\hat{\boldsymbol{x}}|^{2}+\frac{p_{j}}{\unicode[STIX]{x1D70C}_{j}}+gz=B_{j}(t),\end{eqnarray}$$
where we call the time varying function
 $B_{j}(t)$
the Bernoulli function. However, by introducing the change of variables
 $$\begin{eqnarray}\unicode[STIX]{x1D719}_{j}=\tilde{\unicode[STIX]{x1D719}}_{j}+\int _{0}^{t}B_{j}(s)\,\text{d}s,\end{eqnarray}$$
we can eliminate the Bernoulli function, and thus we set it to zero throughout the remainder of this text.
2.2 Non-local formulation in interface quantities
Following the work of Ablowitz, Fokas & Musslimani (Reference Ablowitz, Fokas and Musslimani2006), Haut & Ablowitz (Reference Haut and Ablowitz2009), Ashton & Fokas (Reference Ashton and Fokas2011), we introduce the harmonic functions
 $\unicode[STIX]{x1D711}_{j}$
such that
 $$\begin{eqnarray}\unicode[STIX]{x1D711}_{j}=\text{e}^{-\text{i}kx}\cosh (k(z+(-1)^{j}h_{j})).\end{eqnarray}$$
Noting that
 $$\begin{eqnarray}(\unicode[STIX]{x2202}_{z}\unicode[STIX]{x1D711}_{j})(\unicode[STIX]{x0394}\unicode[STIX]{x1D713}_{j}+\unicode[STIX]{x1D714}_{j})+\unicode[STIX]{x2202}_{z}\unicode[STIX]{x1D713}_{j}(\unicode[STIX]{x0394}\unicode[STIX]{x1D711}_{j})=0,\end{eqnarray}$$
where
 $\unicode[STIX]{x1D713}_{j}$
solves (2.9), we integrate the above quantity over the respective fluid domain. By using Green’s second identity and integration by parts, we can readily show that for
 $j=1,2$
.
 $$\begin{eqnarray}\int _{0}^{2\unicode[STIX]{x03C0}L}\text{e}^{-\text{i}kx}((\text{i}k(\unicode[STIX]{x2202}_{t}\unicode[STIX]{x1D702})-\unicode[STIX]{x1D714}_{j}){\mathcal{C}}_{j}-k(\unicode[STIX]{x2202}_{x}q_{j}-\unicode[STIX]{x1D714}_{j}\unicode[STIX]{x1D702}){\mathcal{S}}_{j})\,\text{d}x=0,\quad \forall \;k\in \unicode[STIX]{x1D6EC},\end{eqnarray}$$
where
 $\unicode[STIX]{x1D6EC}=\{k=(2n\unicode[STIX]{x03C0})/L|n\in \mathbb{Z}/\{0\}\}$
,
 $q_{j}$
is given by
 $$\begin{eqnarray}q_{j}(x,t)=\unicode[STIX]{x1D719}_{j}(x,\unicode[STIX]{x1D702}(x,t),t),\end{eqnarray}$$
and the quantities
 ${\mathcal{C}}_{j}$
,
 ${\mathcal{S}}_{j}$
are defined by
 $$\begin{eqnarray}{\mathcal{C}}_{j}=\cosh (k(\unicode[STIX]{x1D702}+(-1)^{j}h_{j})),\quad {\mathcal{S}}_{j}=\sinh (k(\unicode[STIX]{x1D702}+(-1)^{j}h_{j})).\end{eqnarray}$$
Using the boundary condition
 $$\begin{eqnarray}p_{1}(x,\unicode[STIX]{x1D702},t)=p_{2}(x,\unicode[STIX]{x1D702},t),\end{eqnarray}$$
along with our new variables
 $q_{j}$
we also find
 $j=1,2$
, we have
 $$\begin{eqnarray}\displaystyle & & \displaystyle \unicode[STIX]{x2202}_{t}q_{1}-\unicode[STIX]{x1D714}_{1}\unicode[STIX]{x2202}_{x}^{-1}\unicode[STIX]{x2202}_{t}\unicode[STIX]{x1D702}+\frac{1}{2}(\unicode[STIX]{x2202}_{x}q_{1}-\unicode[STIX]{x1D714}_{1}\unicode[STIX]{x1D702})^{2}-\frac{1}{2}\frac{(\unicode[STIX]{x2202}_{t}\unicode[STIX]{x1D702}+\unicode[STIX]{x2202}_{x}\unicode[STIX]{x1D702}(\unicode[STIX]{x2202}_{x}q_{1}-\unicode[STIX]{x1D714}_{1}\unicode[STIX]{x1D702}))^{2}}{1+(\unicode[STIX]{x2202}_{x}\unicode[STIX]{x1D702})^{2}}+g\unicode[STIX]{x1D702}\nonumber\\ \displaystyle & & \displaystyle \quad =\unicode[STIX]{x1D70C}\left(\unicode[STIX]{x2202}_{t}q_{2}-\unicode[STIX]{x1D714}_{2}\unicode[STIX]{x2202}_{x}^{-1}\unicode[STIX]{x2202}_{t}\unicode[STIX]{x1D702}+\frac{1}{2}(\unicode[STIX]{x2202}_{x}q_{2}-\unicode[STIX]{x1D714}_{2}\unicode[STIX]{x1D702})^{2}-\frac{1}{2}\frac{(\unicode[STIX]{x2202}_{t}\unicode[STIX]{x1D702}+\unicode[STIX]{x2202}_{x}\unicode[STIX]{x1D702}(\unicode[STIX]{x2202}_{x}q_{2}-\unicode[STIX]{x1D714}_{2}\unicode[STIX]{x1D702}))^{2}}{1+(\unicode[STIX]{x2202}_{x}\unicode[STIX]{x1D702})^{2}}+g\unicode[STIX]{x1D702}\right).\nonumber\\ \displaystyle & & \displaystyle\end{eqnarray}$$
Thus, (2.15) for
 $j=1,2$
along with (2.19) represent a closed system of three equations for the three unknown quantities
 $(q_{1},q_{2},\unicode[STIX]{x1D702})$
.
2.3 Non-dimensionalization
Introducing the non-dimensional parameters given by
 $$\begin{eqnarray}\tilde{x}=\frac{x}{L},\quad \tilde{z}=\frac{z}{h_{1}},\quad \tilde{t}=\frac{c_{0}}{L}t,\quad q_{j}=\unicode[STIX]{x1D716}c_{0}L\tilde{q}_{j},\quad \unicode[STIX]{x1D702}=a\tilde{\unicode[STIX]{x1D702}},\quad \tilde{k}=Lk,\end{eqnarray}$$
and
 $$\begin{eqnarray}\tilde{\unicode[STIX]{x1D714}}_{j}=\unicode[STIX]{x1D714}_{j}\frac{h_{1}}{c_{0}},\quad \tilde{c}=\frac{c}{c_{h}},\quad \unicode[STIX]{x1D707}=\frac{h_{1}}{L},\quad \unicode[STIX]{x1D716}=\frac{a}{h_{1}},\quad \unicode[STIX]{x1D6FF}=\frac{h_{2}}{h_{1}},\end{eqnarray}$$
where
 $c_{h}=\sqrt{gh_{1}}$
, we have the following system of three equations
 $$\begin{eqnarray}\displaystyle & & \displaystyle \unicode[STIX]{x2202}_{t}(q_{1}-\unicode[STIX]{x1D714}_{1}\unicode[STIX]{x2202}_{x}^{-1}\unicode[STIX]{x1D702})+\frac{\unicode[STIX]{x1D716}}{2}(\unicode[STIX]{x2202}_{x}q_{1}-\unicode[STIX]{x1D714}_{1}\unicode[STIX]{x1D702})^{2}+\unicode[STIX]{x1D702}-\frac{\unicode[STIX]{x1D716}\unicode[STIX]{x1D707}^{2}}{2}\frac{(\unicode[STIX]{x2202}_{t}\unicode[STIX]{x1D702}+(\unicode[STIX]{x1D716}\unicode[STIX]{x2202}_{x}\unicode[STIX]{x1D702})(\unicode[STIX]{x2202}_{x}q_{1}-\unicode[STIX]{x1D714}_{1}\unicode[STIX]{x1D702}))^{2}}{1+(\unicode[STIX]{x1D716}\unicode[STIX]{x1D707}\unicode[STIX]{x2202}_{x}\unicode[STIX]{x1D702})^{2}}\nonumber\\ \displaystyle & & \displaystyle \quad =\unicode[STIX]{x1D70C}\left(\unicode[STIX]{x2202}_{t}(q_{2}-\unicode[STIX]{x1D714}_{2}\unicode[STIX]{x2202}_{x}^{-1}\unicode[STIX]{x1D702})+\frac{\unicode[STIX]{x1D716}}{2}(\unicode[STIX]{x2202}_{x}q_{2}-\unicode[STIX]{x1D714}_{2}\unicode[STIX]{x1D702})^{2}+\unicode[STIX]{x1D702}-\frac{\unicode[STIX]{x1D716}\unicode[STIX]{x1D707}^{2}}{2}\frac{(\unicode[STIX]{x2202}_{t}\unicode[STIX]{x1D702}+(\unicode[STIX]{x1D716}\unicode[STIX]{x2202}_{x}\unicode[STIX]{x1D702})(\unicode[STIX]{x2202}_{x}q_{2}-\unicode[STIX]{x1D714}_{2}\unicode[STIX]{x1D702}))^{2}}{1+(\unicode[STIX]{x1D716}\unicode[STIX]{x1D707}\unicode[STIX]{x2202}_{x}\unicode[STIX]{x1D702})^{2}}\right),\nonumber\\ \displaystyle & & \displaystyle\end{eqnarray}$$
 $$\begin{eqnarray}\int _{0}^{2\unicode[STIX]{x03C0}}\text{e}^{-\text{i}kx}((\text{i}k\unicode[STIX]{x1D716}\unicode[STIX]{x1D707}^{2}\unicode[STIX]{x2202}_{t}\unicode[STIX]{x1D702}-\unicode[STIX]{x1D714}_{1}){\mathcal{C}}_{1}-\unicode[STIX]{x1D716}\unicode[STIX]{x1D707}k(\unicode[STIX]{x2202}_{x}q_{1}-\unicode[STIX]{x1D714}_{1}\unicode[STIX]{x1D702}){\mathcal{S}}_{1})\,\text{d}x=0,\quad \forall \;k\in \mathbb{Z}/\{0\},\end{eqnarray}$$
and
 $$\begin{eqnarray}\int _{0}^{2\unicode[STIX]{x03C0}}\text{e}^{-\text{i}kx}((\text{i}k\unicode[STIX]{x1D716}\unicode[STIX]{x1D707}^{2}\unicode[STIX]{x2202}_{t}\unicode[STIX]{x1D702}-\unicode[STIX]{x1D714}_{2}){\mathcal{C}}_{2}-\unicode[STIX]{x1D716}\unicode[STIX]{x1D707}k(\unicode[STIX]{x2202}_{x}q_{2}-\unicode[STIX]{x1D714}_{2}\unicode[STIX]{x1D702}){\mathcal{S}}_{2})\,\text{d}x=0,\quad \forall \;k\in \mathbb{Z}/\{0\}.\end{eqnarray}$$
3 Travelling wave equations
Working with the non-dimensional equations in a travelling coordinate frame, letting
 $\unicode[STIX]{x2202}_{t}\unicode[STIX]{x1D702}\rightarrow -c\unicode[STIX]{x2202}_{x}\unicode[STIX]{x1D702}$
as well as
 $\unicode[STIX]{x2202}_{t}q_{j}\rightarrow -\unicode[STIX]{x2202}_{x}q_{j}$
for
 $j=1,2$
, the equations for stationary solutions in a travelling frame become
 $$\begin{eqnarray}\displaystyle & \displaystyle \left(\frac{1}{2}\frac{(\unicode[STIX]{x1D716}(\unicode[STIX]{x2202}_{x}q_{1}-\unicode[STIX]{x1D714}_{1}\unicode[STIX]{x1D702})-c)^{2}}{1+(\unicode[STIX]{x1D716}\unicode[STIX]{x1D707}\unicode[STIX]{x2202}_{x}\unicode[STIX]{x1D702})^{2}}+\unicode[STIX]{x1D716}\unicode[STIX]{x1D702}-\frac{1}{2}c^{2}\right)=\unicode[STIX]{x1D70C}\left(\frac{1}{2}\frac{(\unicode[STIX]{x1D716}(\unicode[STIX]{x2202}_{x}q_{2}-\unicode[STIX]{x1D714}_{2}\unicode[STIX]{x1D702})-c)^{2}}{1+(\unicode[STIX]{x1D716}\unicode[STIX]{x1D707}\unicode[STIX]{x2202}_{x}\unicode[STIX]{x1D702})^{2}}+\unicode[STIX]{x1D716}\unicode[STIX]{x1D702}-\frac{1}{2}c^{2}\right), & \displaystyle \nonumber\\ \displaystyle & & \displaystyle\end{eqnarray}$$
 $$\begin{eqnarray}\displaystyle & \displaystyle \int _{0}^{2\unicode[STIX]{x03C0}}\text{e}^{-\text{i}kx}({\mathcal{C}}_{1}\unicode[STIX]{x1D714}_{1}+\unicode[STIX]{x1D707}k{\mathcal{S}}_{1}(\unicode[STIX]{x1D716}(\unicode[STIX]{x2202}_{x}q_{1}-\unicode[STIX]{x1D714}_{1}\unicode[STIX]{x1D702})-c))\,\text{d}x=0, & \displaystyle\end{eqnarray}$$
 $$\begin{eqnarray}\displaystyle & \displaystyle \int _{0}^{2\unicode[STIX]{x03C0}}\text{e}^{-\text{i}kx}({\mathcal{C}}_{2}\unicode[STIX]{x1D714}_{2}+\unicode[STIX]{x1D707}k{\mathcal{S}}_{2}(\unicode[STIX]{x1D716}(\unicode[STIX]{x2202}_{x}q_{2}-\unicode[STIX]{x1D714}_{2}\unicode[STIX]{x1D702})-c))\,\text{d}x=0, & \displaystyle\end{eqnarray}$$
where
 ${\mathcal{C}}_{j}=\cosh (\unicode[STIX]{x1D707}k(\unicode[STIX]{x1D716}\unicode[STIX]{x1D702}+d_{j}))$
and
 ${\mathcal{S}}_{j}=\sinh (\unicode[STIX]{x1D707}k(\unicode[STIX]{x1D716}\unicode[STIX]{x1D702}+d_{j}))$
with
 $d_{1}=-1$
and
 $d_{2}=\unicode[STIX]{x1D6FF}$
. In the above formulation, we are required to solve three equations for three unknown functions
 $\unicode[STIX]{x1D702}$
,
 $q_{1}$
and
 $q_{2}$
. However, as in Ashton & Fokas (Reference Ashton and Fokas2011), Deconinck & Oliveras (Reference Deconinck and Oliveras2011), we can reduce the dimensionality of the problem by formally solving the Bernoulli equation for either the quantity
 $\unicode[STIX]{x1D716}\unicode[STIX]{x2202}_{x}q_{1}-\unicode[STIX]{x1D716}\unicode[STIX]{x1D714}_{1}\unicode[STIX]{x1D702}-c$
or
 $\unicode[STIX]{x1D716}\unicode[STIX]{x2202}_{x}q_{2}-\unicode[STIX]{x1D716}\unicode[STIX]{x1D714}_{2}\unicode[STIX]{x1D702}-c$
. Without loss of generality, we solve for the tangential velocity approaching the interface from above
 $\unicode[STIX]{x2202}_{x}q_{1}$
in terms of
 $\unicode[STIX]{x2202}_{x}q_{2}$
to find
 $$\begin{eqnarray}\unicode[STIX]{x1D716}(\unicode[STIX]{x2202}_{x}q_{1}-\unicode[STIX]{x1D714}_{1}\unicode[STIX]{x1D702})-c=\unicode[STIX]{x1D70E}\sqrt{\unicode[STIX]{x1D70C}(\unicode[STIX]{x1D716}\unicode[STIX]{x2202}_{x}q_{2}-\unicode[STIX]{x1D716}\unicode[STIX]{x1D714}_{2}\unicode[STIX]{x1D702}-c)^{2}+(c^{2}-2\unicode[STIX]{x1D716}\unicode[STIX]{x1D702})(1+(\unicode[STIX]{x1D716}\unicode[STIX]{x1D707}\unicode[STIX]{x2202}_{x}\unicode[STIX]{x1D702})^{2})(1-\unicode[STIX]{x1D70C})},\end{eqnarray}$$
where
 $\unicode[STIX]{x1D70E}=\pm 1$
.
Remark 2. The meaning of the plus/minus sign is typically of critical importance in problems involving linear shear (see Vasan & Oliveras Reference Vasan and Oliveras2014). However, when simply solving for the interface variables
 $\unicode[STIX]{x1D702}$
and
 $q_{2}$
, an alternative choice in
 $\unicode[STIX]{x1D70E}$
is equivalent to changing the sign of vorticity in the upper layer given by
 $\unicode[STIX]{x1D714}_{1}$
. Furthermore, to ensure that
 $(\unicode[STIX]{x1D702},q_{1},q_{2})=(0,0,0)$
remains a solution to the problem, that is, that we consider travelling wave solutions that bifurcate from flat water with no jump in the tangential velocity, we choose
 $\unicode[STIX]{x1D70E}=-\text{sgn}(c_{0})$
as indicated by (3.4) where
 $c_{0}$
is the speed corresponding to bifurcation from the trivial solution.
The resulting equations to solve for
 $\unicode[STIX]{x1D702}(x)$
and
 $q_{2}(x)$
are given by
 $$\begin{eqnarray}\displaystyle & & \displaystyle \int _{0}^{2\unicode[STIX]{x03C0}}\text{e}^{-\text{i}kx}\left({\mathcal{C}}_{1}\unicode[STIX]{x1D714}_{1}+\unicode[STIX]{x1D707}k{\mathcal{S}}_{1}\right.\nonumber\\ \displaystyle & & \displaystyle \quad \left.\left(\unicode[STIX]{x1D70E}\sqrt{\unicode[STIX]{x1D70C}(\unicode[STIX]{x1D716}\unicode[STIX]{x2202}_{x}q_{2}-\unicode[STIX]{x1D716}\unicode[STIX]{x1D714}_{2}\unicode[STIX]{x1D702}-c)^{2}+(c^{2}-2\unicode[STIX]{x1D716}\unicode[STIX]{x1D702})(1+(\unicode[STIX]{x1D716}\unicode[STIX]{x1D707}\unicode[STIX]{x2202}_{x}\unicode[STIX]{x1D702})^{2})(1-\unicode[STIX]{x1D70C})}\right)\right)\,\text{d}x=0,\qquad\end{eqnarray}$$
 $$\begin{eqnarray}\int _{0}^{2\unicode[STIX]{x03C0}}\text{e}^{-\text{i}kx}({\mathcal{C}}_{2}\unicode[STIX]{x1D714}_{2}+\unicode[STIX]{x1D707}k{\mathcal{S}}_{2}(\unicode[STIX]{x1D716}(\unicode[STIX]{x2202}_{x}q_{2}-\unicode[STIX]{x1D714}_{2}\unicode[STIX]{x1D702})-c))\,\text{d}x=0,\end{eqnarray}$$
where
 ${\mathcal{C}}_{j}$
and
 ${\mathcal{S}}_{j}$
are the same as given before this system of two equations can be solved for the unknowns
 $\unicode[STIX]{x1D702}$
and
 $\unicode[STIX]{x2202}_{x}q_{2}$
for an admissible value of the wave speed
 $c$
. Once solutions for
 $\unicode[STIX]{x1D702}$
and
 $\unicode[STIX]{x2202}_{x}q_{2}$
are determined,
 $\unicode[STIX]{x2202}_{x}q_{1}$
is obtained directly by substitution in (3.4).
3.1 Bifurcation from trivial flow
Since we ultimately use a numerical continuation scheme in this work, we determine for which wave speeds
 $c$
a non-trivial solution will bifurcate from the zero solution. This is achieved by expanding the free surface
 $\unicode[STIX]{x1D702}$
,
 $\unicode[STIX]{x2202}_{x}q_{2}$
and
 $c$
in powers of
 $\unicode[STIX]{x1D716}$
of the form
 $$\begin{eqnarray}\unicode[STIX]{x1D702}(x)=\mathop{\sum }_{n=0}^{\infty }\unicode[STIX]{x1D716}^{n}\unicode[STIX]{x1D702}_{n}(x),\quad \unicode[STIX]{x2202}_{x}q_{2}=\mathop{\sum }_{n=0}^{\infty }\unicode[STIX]{x1D716}^{n}\unicode[STIX]{x2202}_{x}v_{n},\quad c=\mathop{\sum }_{n=0}^{\infty }\unicode[STIX]{x1D716}^{n}c_{n}.\end{eqnarray}$$
We assume that solutions will bifurcation from a wave with positive velocity so that
 $c_{0}>0$
and thus, choosing
 $\unicode[STIX]{x1D70E}=-1$
enforces bifurcating from a branch where there is no jump in the tangential velocity. Similarly, we consider a frame of reference such that
 $q_{2}(x)$
has zero-average value. Expanding (3.5) and (3.6) in
 $\unicode[STIX]{x1D716}$
, we find the following linear system for
 $\unicode[STIX]{x1D702}_{0}$
and
 $v_{0}$
given by
 $$\begin{eqnarray}\displaystyle & & \displaystyle \left(\begin{array}{@{}cc@{}}\displaystyle \unicode[STIX]{x1D707}kc_{0}^{2}-\tanh (\unicode[STIX]{x1D707}k)(\tilde{\unicode[STIX]{x1D714}}c_{0}-(\unicode[STIX]{x1D70C}-1)) & c_{0}\unicode[STIX]{x1D70C}\tanh (\unicode[STIX]{x1D707}k)\\ \displaystyle -\unicode[STIX]{x1D707}kc_{0} & \tanh (\unicode[STIX]{x1D6FF}\unicode[STIX]{x1D707}k)\end{array}\right)\left(\begin{array}{@{}c@{}}\displaystyle {\mathcal{F}}_{k}\,\{\unicode[STIX]{x1D702}_{0}\}\\ \displaystyle {\mathcal{F}}_{k}\,\{v_{0}\}\end{array}\right)\nonumber\\ \displaystyle & & \displaystyle \quad =c_{1}\left(\begin{array}{@{}c@{}}\displaystyle {\mathcal{F}}_{k}\,\{c_{0}\tanh (\unicode[STIX]{x1D707}k)\}\\ \displaystyle -{\mathcal{F}}_{k}\,\{\tanh (\unicode[STIX]{x1D6FF}\unicode[STIX]{x1D707}k)\}\end{array}\right),\end{eqnarray}$$
where
 ${\mathcal{F}}_{k}\,\{f(x)\}$
represents the
 $k$
th Fourier coefficient of
 $f(x)$
defined by
 $$\begin{eqnarray}{\mathcal{F}}_{k}\,\{f(x)\}=\frac{1}{2\unicode[STIX]{x03C0}}\int _{0}^{2\unicode[STIX]{x03C0}}\text{e}^{-\text{i}kx}f(x)\,\text{d}x,\end{eqnarray}$$
and we have introduced the quantity
 $\tilde{\unicode[STIX]{x1D714}}=\unicode[STIX]{x1D714}_{1}-\unicode[STIX]{x1D70C}\unicode[STIX]{x1D714}_{2}.$
Since the right-hand side of (3.8) evaluates to zero, we can then say that the only way for there to be a non-zero solution for
 $\unicode[STIX]{x1D702}_{0}$
and
 $v_{0}$
is for the linear operator on the left-hand side of (3.8) singular for at least one
 $k$
value (henceforth referred to as
 $k_{0}$
). This leads to the equation
 $c_{0}$
given by
 $$\begin{eqnarray}c_{0}^{2}-\tilde{\unicode[STIX]{x1D714}}{\mathcal{T}}_{k_{0}}c_{0}-{\mathcal{T}}_{k_{0}}(\unicode[STIX]{x1D70C}-1)=0,\end{eqnarray}$$
where
 $$\begin{eqnarray}{\mathcal{T}}_{k}=\frac{\tanh (\unicode[STIX]{x1D707}k)\tanh (\unicode[STIX]{x1D6FF}\unicode[STIX]{x1D707}k)}{\unicode[STIX]{x1D707}(\unicode[STIX]{x1D70C}\tanh (\unicode[STIX]{x1D707}k)+\tanh (\unicode[STIX]{x1D6FF}\unicode[STIX]{x1D707}k))}.\end{eqnarray}$$
Using this notation, we find
 $$\begin{eqnarray}c_{0}=\frac{\unicode[STIX]{x1D6FA}(k_{0})}{k_{0}},\quad \unicode[STIX]{x1D6FA}(k_{0})=\frac{1}{2}\left(-{\mathcal{T}}_{k_{0}}\tilde{\unicode[STIX]{x1D714}}+\text{sgn}(k_{0})\sqrt{{\mathcal{T}}_{k_{0}}^{2}\tilde{\unicode[STIX]{x1D714}}^{2}+4(\unicode[STIX]{x1D70C}-1)k_{0}{\mathcal{T}}_{k_{0}}}\right),\end{eqnarray}$$
where the negative solution is extraneous due to our earlier assumptions of bifurcating from a positive speed
 $c_{0}$
.
The corresponding non-trivial solutions are given by
 $$\begin{eqnarray}\unicode[STIX]{x1D702}_{0}(x)=\cos (k_{0}x),\quad v_{0}(x)=\frac{\unicode[STIX]{x1D707}k_{0}c_{0}}{\tanh (\unicode[STIX]{x1D707}\unicode[STIX]{x1D6FF}k_{0})}\cos (k_{0}x).\end{eqnarray}$$
Thus, for a given wave-number
 $k_{0}$
, the leading-order approximations to the solution set
 $(\unicode[STIX]{x1D702}(x),\unicode[STIX]{x2202}_{x}q_{2},c)$
are given by the expressions in (3.12a,b
) and (3.13a,b
). With the aid of a computer algebra system, we determine higher-order corrections to the speed
 $c$
whereby
 $$\begin{eqnarray}c\approx c_{0}+\unicode[STIX]{x1D716}^{2}c_{2}+O(\unicode[STIX]{x1D716}^{4}).\end{eqnarray}$$
By finding
 $c_{2}$
, we can generate analytic results which provide insight into the impact of vorticity on the speed at which the interface propagates. Specifically, we see that
 $c_{2}$
can change sign relative to
 $c_{0}$
for different vorticities. Furthermore, we will later see a strong connection between the sign of
 $c_{2}$
and the overall shape of the interface.
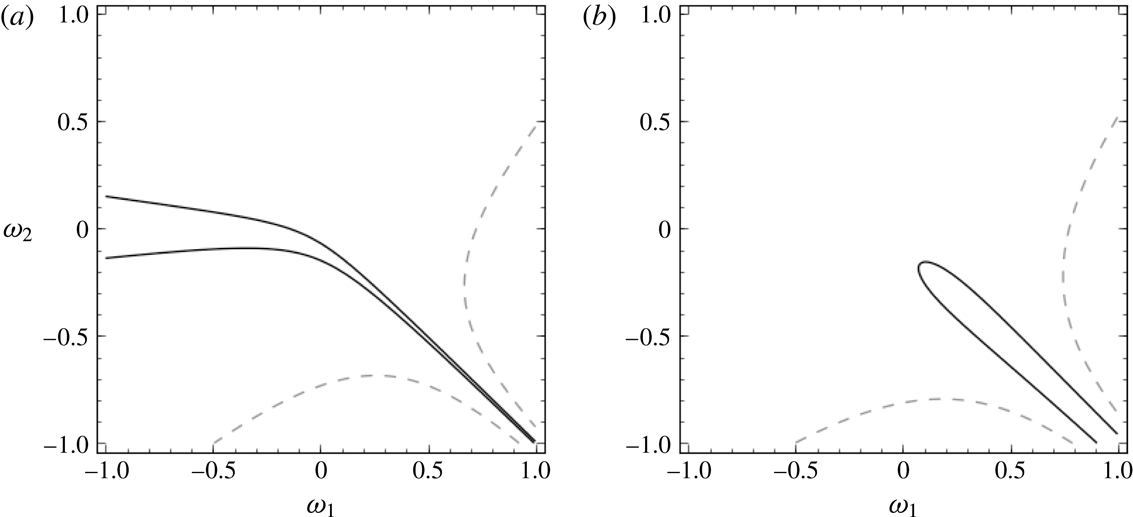
Figure 2 shows the regions where
 $c_{2}$
changes signs. As seen in the figure, the response of
 $c_{2}$
to the choice of vorticities can be quite sensitive. For example, choosing a weak stratification value of
 $\unicode[STIX]{x1D70C}=1.028$
, reflective of oceanic density stratification,
 $\unicode[STIX]{x1D707}=\sqrt{0.1}$
,
 $\unicode[STIX]{x1D6FF}=4$
and choosing the
 $c_{0,+}$
branch, we plot
 $c_{2}$
in figure 2 for
 $k_{0}=1$
and
 $k_{0}=10$
. While both plots exhibit a wide range of scales with respect to the magnitude of
 $c_{2}$
, this range is far wider for
 $k_{0}=1$
than
 $k_{0}=10$
. Likewise, the region over which
 $c_{2}$
is negative is far larger in the case for
 $k_{0}=1$
. Note, those regions for which
 $c_{2}<0$
are regions in which the wave speed decreases with increasing wave height, which is in contrast to the usual result whereby nonlinear wave speed increases with increasing wave height. Furthermore, we will later see a strong connection between the sign of
 $c_{2}$
and the overall shape of the interface.
Plots of
 $c_{2}$
for
 $\unicode[STIX]{x1D70C}=1.028$
,
 $\unicode[STIX]{x1D707}=\sqrt{0.1}$
,
 $\unicode[STIX]{x1D6FF}=4$
and
 $k_{0}=1$
(a) and
 $k_{0}=10$
(b). In (a,b) the solid (–) line denotes the
 $c_{2}=0$
contour, with the interior of these curves marking the regions for which
 $c_{2}<0$
. In (a) the dashed curve (– –) denotes the
 $c_{2}=10^{6}$
contour, while in (b) it denotes the
 $c_{2}=10^{4}$
contour.

3.2 Stagnation points
Given their connections to high pressure regions, the presence of stagnation points interior to each of the fluid domains impacts both the shape and stability of travelling wave solutions. We proceed to find conditions for the presence of stagnation points interior to each of the fluid domains. In order for there to be a stagnation point inside the fluid domain, there must exist a point inside the domain such that
 $u-c=0$
. For simplicity, let
 $z_{j}^{(s)}$
represent the location of a stagnation point inside the upper (
 $j=1$
) or lower (
 $j=2$
) fluid domain so that
 $0\leqslant z_{1}^{(s)}\leqslant 1$
and
 $-\unicode[STIX]{x1D6FF}\leqslant z_{2}^{(s)}\leqslant 0$
. At leading order, it is straightforward to show that the relative horizontal profile
 $u-c$
is given by
 $$\begin{eqnarray}u-c=-\unicode[STIX]{x1D714}_{j}z-c_{0}+O(\unicode[STIX]{x1D716})\end{eqnarray}$$
inside of each fluid domain implying that stagnation will occur if there is a
 $z$
inside each fluid domain such that
 $-\unicode[STIX]{x1D714}_{j}z=c_{0}$
.
For example, in the upper fluid domain, the condition for the existence of a stagnation point is given by
 $$\begin{eqnarray}-\unicode[STIX]{x1D714}_{1}z_{1}^{(s)}=c_{0}^{\pm }\quad \rightarrow \quad z_{1}^{(s)}=\frac{c_{0}^{\pm }}{-\unicode[STIX]{x1D714}_{1}}.\end{eqnarray}$$
From this perspective, it is clear that there will only be a stagnation point inside the upper fluid domain provided that
 $\text{sgn}(\unicode[STIX]{x1D714}_{1})=-\text{sgn}(c_{0}^{\pm })$
. Likewise, there will only be a stagnation point inside the lower fluid domain provided that
 $\text{sgn}(\unicode[STIX]{x1D714}_{2})=\text{sgn}(c_{0}^{\pm })$
. By enforcing the condition that the stagnation point is inside the appropriate fluid domain, we find the following conditions for the existence of a stagnation point when
 $c_{0}=c_{0}^{+}$
:
 $$\begin{eqnarray}\left.\begin{array}{@{}c@{}}\displaystyle \text{Upper fluid domain: }\unicode[STIX]{x1D714}_{1}>\frac{\unicode[STIX]{x1D70C}\unicode[STIX]{x1D714}_{2}{\mathcal{T}}_{k_{0}}-\sqrt{\unicode[STIX]{x1D70C}^{2}\unicode[STIX]{x1D714}_{2}^{2}{\mathcal{T}}_{k_{0}}^{2}+4{\mathcal{T}}_{k_{0}}({\mathcal{T}}_{k_{0}}+k_{0})(\unicode[STIX]{x1D70C}-1)}}{2({\mathcal{T}}_{k_{0}}+k_{0})},\\ \displaystyle \text{Lower fluid domain: }\unicode[STIX]{x1D714}_{2}<\frac{\unicode[STIX]{x1D714}_{1}\unicode[STIX]{x1D6FF}{\mathcal{T}}_{k_{0}}+\sqrt{\unicode[STIX]{x1D714}_{1}^{2}\unicode[STIX]{x1D6FF}^{2}{\mathcal{T}}_{k_{0}}^{2}+4\unicode[STIX]{x1D6FF}{\mathcal{T}}_{k_{0}}(\unicode[STIX]{x1D70C}{\mathcal{T}}_{k_{0}}+\unicode[STIX]{x1D6FF}k_{0})(\unicode[STIX]{x1D70C}-1)}}{2\unicode[STIX]{x1D6FF}(\unicode[STIX]{x1D70C}{\mathcal{T}}_{k_{0}}+\unicode[STIX]{x1D6FF}k_{0})}.\end{array}\right\}\end{eqnarray}$$
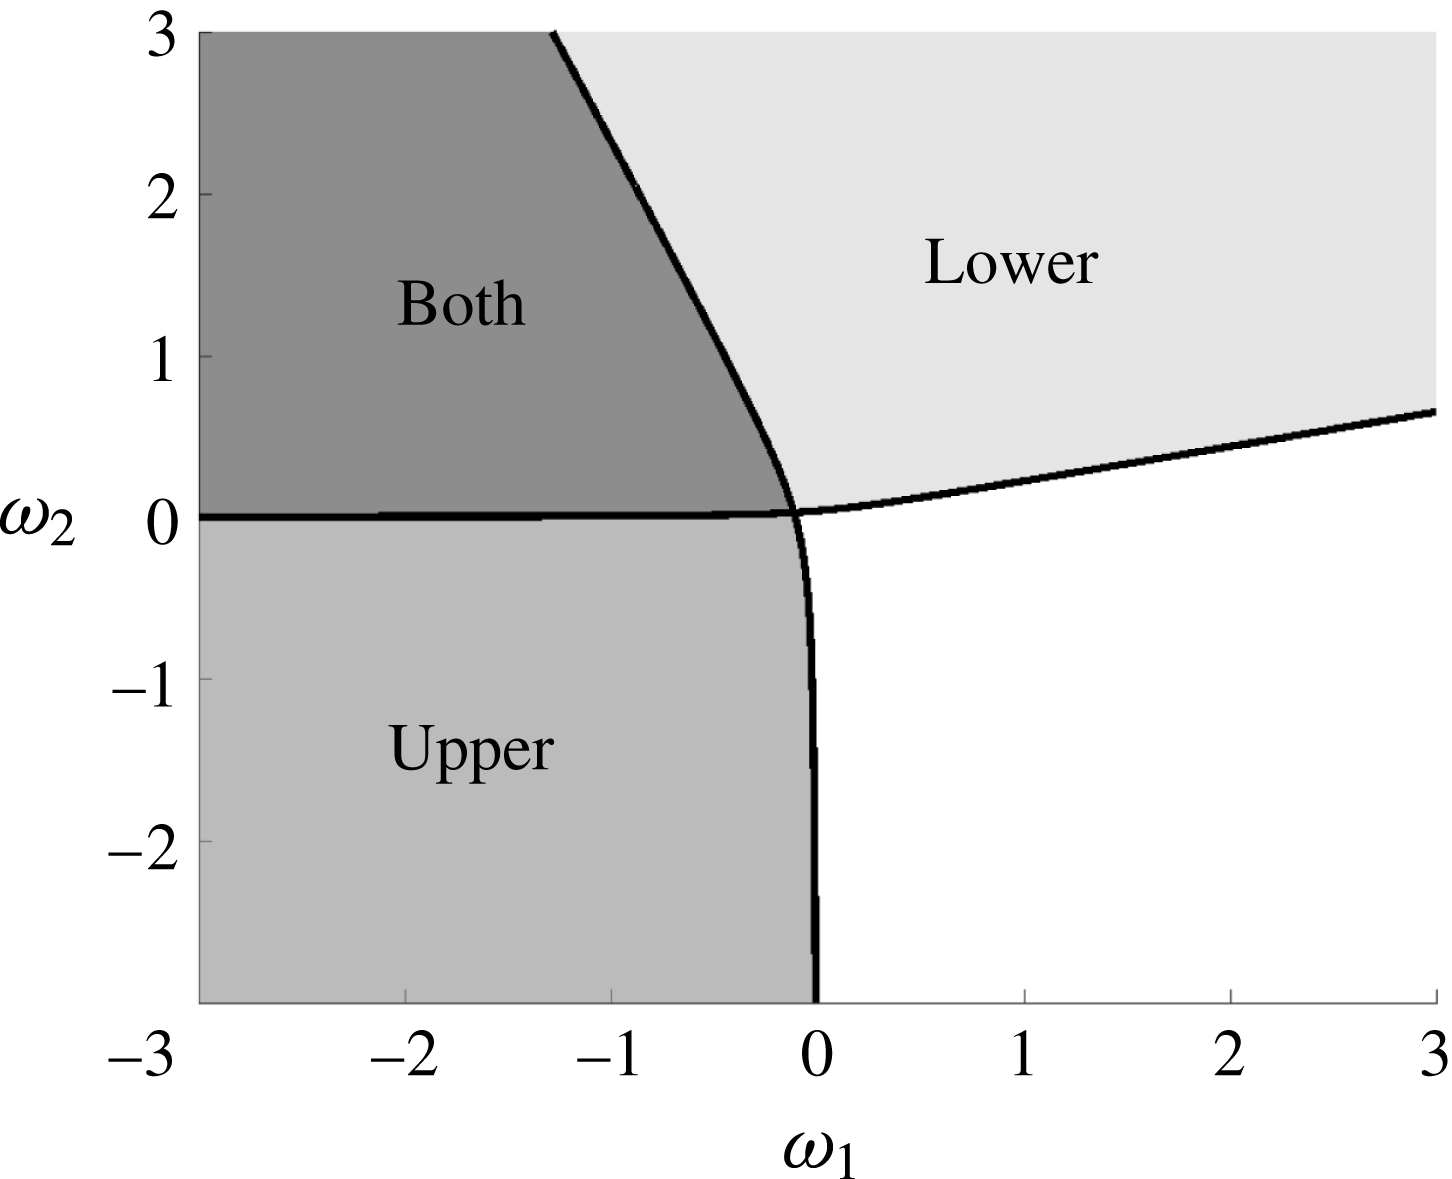
Figure 3 shows the regions in the
 $(\unicode[STIX]{x1D714}_{1},\unicode[STIX]{x1D714}_{2})$
plane where stagnations points are found in the upper, lower or both fluid domains. Depending on the configuration of
 $\unicode[STIX]{x1D714}_{1}$
and
 $\unicode[STIX]{x1D714}_{2}$
the presence of the stagnation points for the trivial solution from which we continue greatly impact the shape of the solutions along the corresponding bifurcation branch. These various configurations will be contrasted in the next section with travelling wave solutions.
3.3 Constructing solutions: numerical implementation
Using the above formulation, we numerically determine travelling wave solutions by solving for the set
 $(\unicode[STIX]{x1D702},\unicode[STIX]{x2202}_{x}q_{2},c)$
for solutions with a fixed spatial period
 $L$
and for fixed wave height
 $\Vert \unicode[STIX]{x1D702}\Vert _{\infty }$
. In the following section, we outline the specific details of the numerical implementation of our pseudo-arclength continuation method. (Code is available on GitHub.)
Vorticity strengths that yield a stagnation point in the upper fluid, lower fluid or in both for
 $\unicode[STIX]{x1D707}=\sqrt{0.1}$
,
 $\unicode[STIX]{x1D70C}=1.028$
and
 $\unicode[STIX]{x1D6FF}=4$
.

To numerically solve (3.5) and (3.6), we use a pseudospectral method to solve for the Fourier coefficients of our unknown functions
 $\unicode[STIX]{x1D702}$
and
 $\unicode[STIX]{x2202}_{x}q_{2}$
– differentiation is conducted in Fourier space, while nonlinear operations are computed in physical space. Since we are considering
 $2\unicode[STIX]{x03C0}$
periodic solutions, we numerically represent
 $\unicode[STIX]{x1D702}$
and
 $\unicode[STIX]{x2202}_{x}q_{2}$
by their Fourier series representation with
 $N$
Fourier modes of the form
 $$\begin{eqnarray}\unicode[STIX]{x1D702}(x)=\sum _{n=-N}^{N}\hat{\unicode[STIX]{x1D702}}_{n}\text{e}^{\text{i}k_{n}x},\quad \unicode[STIX]{x2202}_{x}q_{2}(x)=\sum _{n=-N}^{N}\hat{Q}_{n}\text{e}^{\text{i}k_{n}x},\end{eqnarray}$$
where the
 $^{\prime }$
denotes the summation with
 $n\neq 0$
as we have eliminated both the average value of
 $\unicode[STIX]{x1D702}$
as well as the average value of
 $\unicode[STIX]{x2202}_{x}q_{2}$
. Enforcing
 $\unicode[STIX]{x2202}_{x}q_{2}$
has zero average, we consider zero-mean flow in both the upper and lower fluid. Thus, both
 $\unicode[STIX]{x1D702}$
and
 $\unicode[STIX]{x2202}_{x}q_{2}$
are represented by
 $2N$
unknown Fourier coefficients.
Evaluating equations (3.5) and (3.6) for
 $k=k_{-N},\ldots ,k_{-2},k_{-1},k_{1},k_{2},\ldots ,k_{N}$
generates
 $2\times (2N)$
equations for the
 $2\times (2N)$
unknowns
 $\hat{\unicode[STIX]{x1D702}}_{n}$
and
 $\hat{Q}_{n}$
for
 $n=-N,\ldots ,-1,1,\ldots ,N$
. In order to solve for travelling waves solutions with various amplitudes, we enforce a fixed amplitude for the interface
 $\unicode[STIX]{x1D702}$
by allowing the wave speed
 $c$
to vary as a function of the amplitude, thereby introducing both a new equation and new unknown into our system.
Equations (3.5)–(3.6) are solved for
 $(\hat{\unicode[STIX]{x1D702}},\hat{Q},c)$
iteratively via Newton’s method (although other iterative techniques can also be used). Using a pseudo-arclength continuation, we determine travelling wave solutions for increasingly larger amplitudes.
Remark 3. Due to the exponential nature of the hyperbolic sine and cosine functions, we rewrite the quantities
 ${\mathcal{C}}_{j}$
and
 ${\mathcal{S}}_{j}$
for
 $j=1,2$
as follows
 $$\begin{eqnarray}\displaystyle & \displaystyle {\mathcal{C}}_{1}=\cosh (\unicode[STIX]{x1D707}k(\unicode[STIX]{x1D716}\unicode[STIX]{x1D702}-1))=\cosh (\unicode[STIX]{x1D707}k)(\cosh (\unicode[STIX]{x1D707}k\unicode[STIX]{x1D716}\unicode[STIX]{x1D702})-\tanh (\unicode[STIX]{x1D707}k)\sinh (\unicode[STIX]{x1D707}k\unicode[STIX]{x1D716}\unicode[STIX]{x1D702})), & \displaystyle\end{eqnarray}$$
 $$\begin{eqnarray}\displaystyle & \displaystyle {\mathcal{S}}_{1}=\sinh (\unicode[STIX]{x1D707}k(\unicode[STIX]{x1D716}\unicode[STIX]{x1D702}-1))=\cosh (\unicode[STIX]{x1D707}k)(\sinh (\unicode[STIX]{x1D707}k\unicode[STIX]{x1D716}\unicode[STIX]{x1D702})-\tanh (\unicode[STIX]{x1D707}k)\cosh (\unicode[STIX]{x1D707}k\unicode[STIX]{x1D716}\unicode[STIX]{x1D702})). & \displaystyle\end{eqnarray}$$
3.3.1 Visualizing streamlines and pressure contours
For periodic travelling wave solutions, the solutions for the streamlines take the form
 $$\begin{eqnarray}\unicode[STIX]{x1D713}_{j}=a_{0}+a_{1}(z+(-1)^{j}\unicode[STIX]{x1D6FF}_{j})-\frac{\unicode[STIX]{x1D714}_{j}}{2}(z+(-1)^{j}\unicode[STIX]{x1D6FF}_{j})^{2}+\mathop{\sum }_{k=-\infty }^{\infty }\text{e}^{\text{i}kx}\hat{\unicode[STIX]{x1D713}}_{k}^{(j)}\sinh (k(z+(-1)^{j}\unicode[STIX]{x1D6FF}_{j})).\end{eqnarray}$$
Choosing the non-dimensional function
 $$\begin{eqnarray}\unicode[STIX]{x1D711}_{j}=\text{e}^{-\text{i}kx}\cosh (\unicode[STIX]{x1D707}k(z+(-1)^{j}\unicode[STIX]{x1D6FF}_{j})),\end{eqnarray}$$
where
 $\unicode[STIX]{x1D6FF}_{1}=1$
, and
 $\unicode[STIX]{x1D6FF}_{2}=\unicode[STIX]{x1D6FF}$
, then the analogue of (2.15) for stationary solutions in a travelling frame is, for
 $k\neq 0$
, given by
 $$\begin{eqnarray}\displaystyle & & \displaystyle \int _{0}^{2\unicode[STIX]{x03C0}}\text{e}^{-\text{i}kx}\left(\cosh (\unicode[STIX]{x1D707}k(\unicode[STIX]{x1D716}\unicode[STIX]{x1D702}+(-1)^{j}\unicode[STIX]{x1D6FF}_{j}))(\unicode[STIX]{x2202}_{x}q_{j}-\unicode[STIX]{x1D714}_{j}\unicode[STIX]{x1D702}-c)+\frac{\unicode[STIX]{x1D714}}{k}\sinh (\unicode[STIX]{x1D707}k(z+(-1)^{j}\unicode[STIX]{x1D6FF}_{j}))\right)\,\text{d}x\nonumber\\ \displaystyle & & \displaystyle \quad =\int _{0}^{2\unicode[STIX]{x03C0}}\text{e}^{-\text{i}kx}\unicode[STIX]{x2202}_{z}\unicode[STIX]{x1D713}_{j}(x,(-1)^{j}\unicode[STIX]{x1D6FF}_{j})\,\text{d}x\end{eqnarray}$$
whereas for
 $k=0$
, we find
 $$\begin{eqnarray}\int _{0}^{2\unicode[STIX]{x03C0}}\unicode[STIX]{x2202}_{z}\unicode[STIX]{x1D713}_{j}(x,(-1)^{j}\unicode[STIX]{x1D6FF}_{j})\,\text{d}x=\int _{0}^{2\unicode[STIX]{x03C0}}\text{e}^{-\text{i}kx}(\unicode[STIX]{x2202}_{x}q_{j}-c)\,\text{d}x.\end{eqnarray}$$
Once we have determined a TWS corresponding to the set
 $(\unicode[STIX]{x1D702},q_{1},q_{2},c)$
, we can then use the above equations to determine the streamfunction within the bulk of each fluid by solving for the coefficient
 $a_{1}$
as well as
 $\hat{\unicode[STIX]{x1D713}}_{k}^{(j)}$
. We also note that the streamfunction
 $\unicode[STIX]{x1D713}$
can only be determined up to an arbitrary constant within the fluid domain. Here we choose to normalize so that the streamfunctions are zero on the interface. This flexibility allows us to determine the value of
 $a_{0}$
.
3.4 The irrotational case
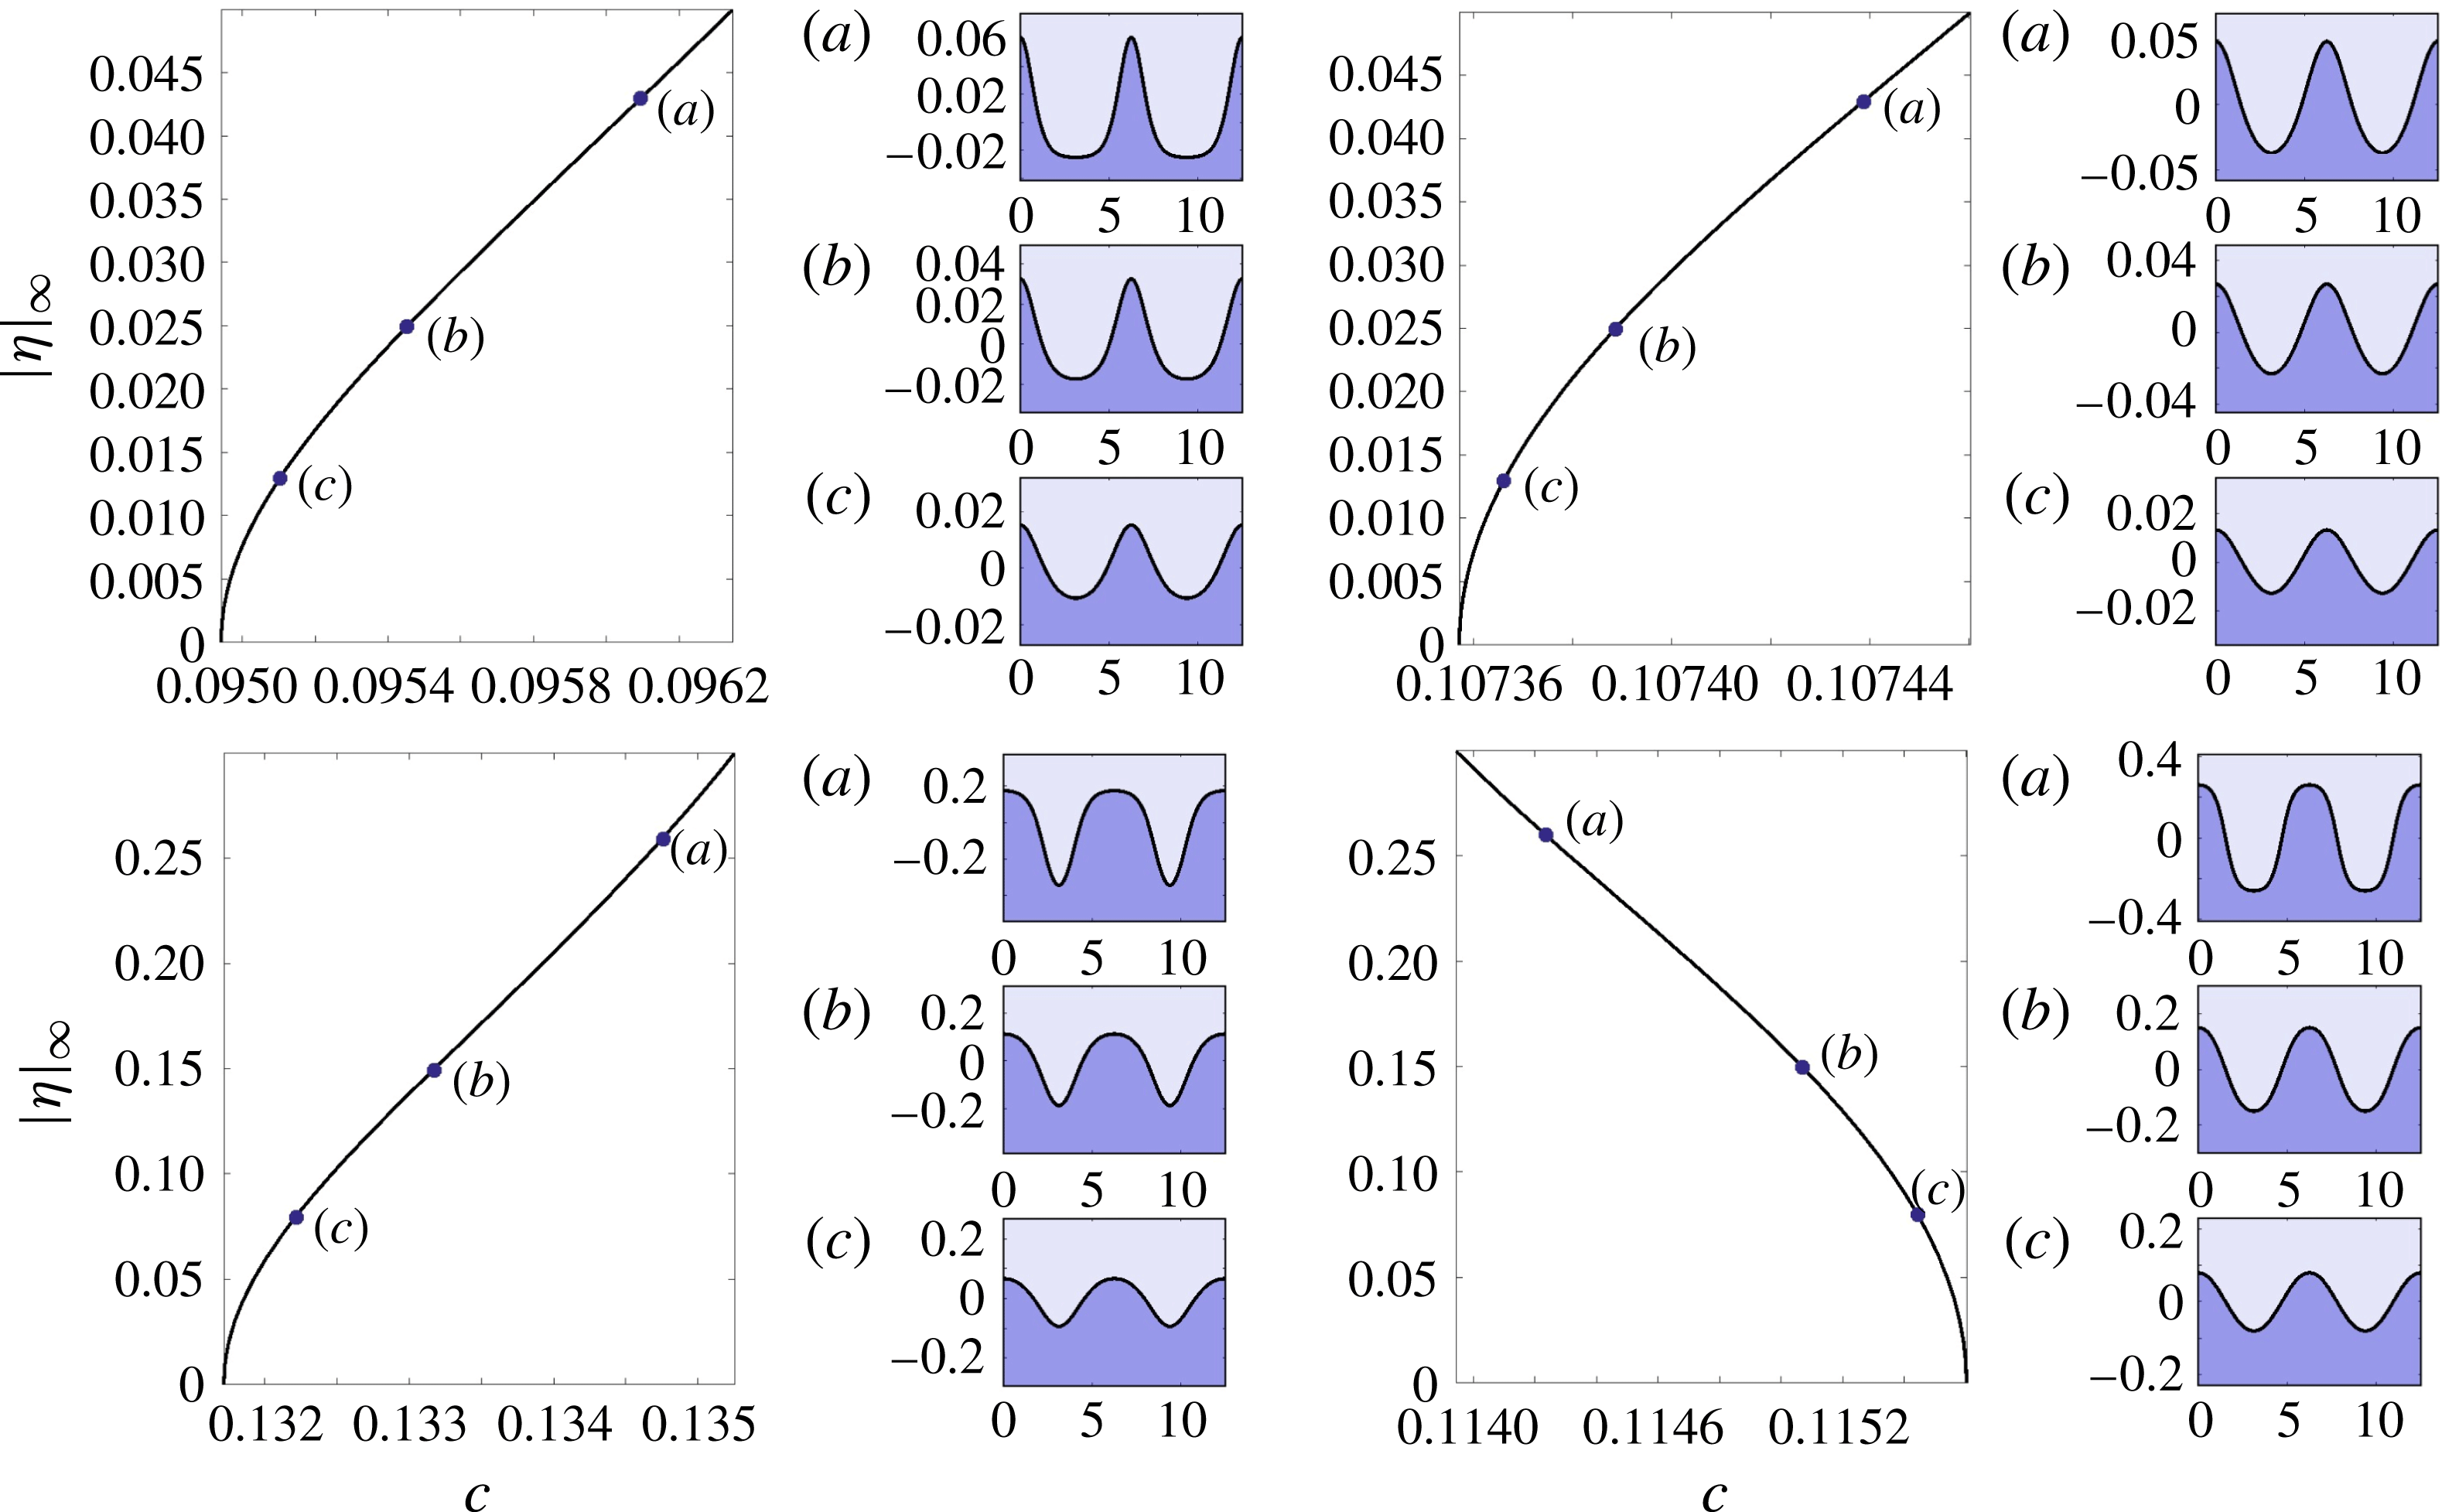
Before we investigate the effects of shear in each layer, we begin by investigating solutions with no shear (vorticity) in each layer. In figure 4, we examine the weak stratifications for
 $\unicode[STIX]{x1D70C}=1.028$
,
 $\unicode[STIX]{x1D707}=\sqrt{0.1}$
and various values of the depth ratio
 $\unicode[STIX]{x1D6FF}$
. For
 $\unicode[STIX]{x1D6FF}=0.5$
, as we increase the amplitude, both the speed of the travelling wave and the interface become more peaked. However, as
 $\unicode[STIX]{x1D6FF}$
increases from
 $\unicode[STIX]{x1D6FF}=0.5$
to
 $\unicode[STIX]{x1D6FF}=2$
, both the amplitude–speed dependence and qualitative shape of the solution undergo transformation.
Specifically, for
 $\unicode[STIX]{x1D6FF}=0.5$
, waves with larger amplitude travel at higher speeds. However, as
 $\unicode[STIX]{x1D6FF}$
increases, this relationship changes so that waves of larger amplitude travel at slower speeds than those with lower amplitudes. As
 $\unicode[STIX]{x1D6FF}$
continues to increase, the amplitude–speed relationship continues to change until the waves with larger amplitudes again travel at larger speeds. Simultaneously, the qualitative shape of solutions morph from ‘peaked waves of elevation’, through rounded peaks and troughs, and finally to ‘peaked waves of depression’. This transition can be accurately predicted by examining how the sign of
 $c_{2}$
varies with respect to
 $\unicode[STIX]{x1D707}$
and
 $\unicode[STIX]{x1D6FF}$
for a specific value of
 $\unicode[STIX]{x1D70C}$
as seen in figure 5.
Bifurcation curves and solutions for
 $\unicode[STIX]{x1D714}_{1}=\unicode[STIX]{x1D714}_{2}=0$
,
 $\unicode[STIX]{x1D707}=\sqrt{0.1}$
and
 $\unicode[STIX]{x1D70C}=1.028$
and
 $\unicode[STIX]{x1D6FF}=0.5$
,
 $\unicode[STIX]{x1D6FF}=0.75$
,
 $\unicode[STIX]{x1D6FF}=1$
and
 $\unicode[STIX]{x1D6FF}=2$
starting clockwise from the top.

For the irrotational case (
 $\unicode[STIX]{x1D714}_{1}=\unicode[STIX]{x1D714}_{2}=0$
), regions where
 $c_{2}$
is negative as a function of
 $\unicode[STIX]{x1D707}$
and
 $\unicode[STIX]{x1D6FF}$
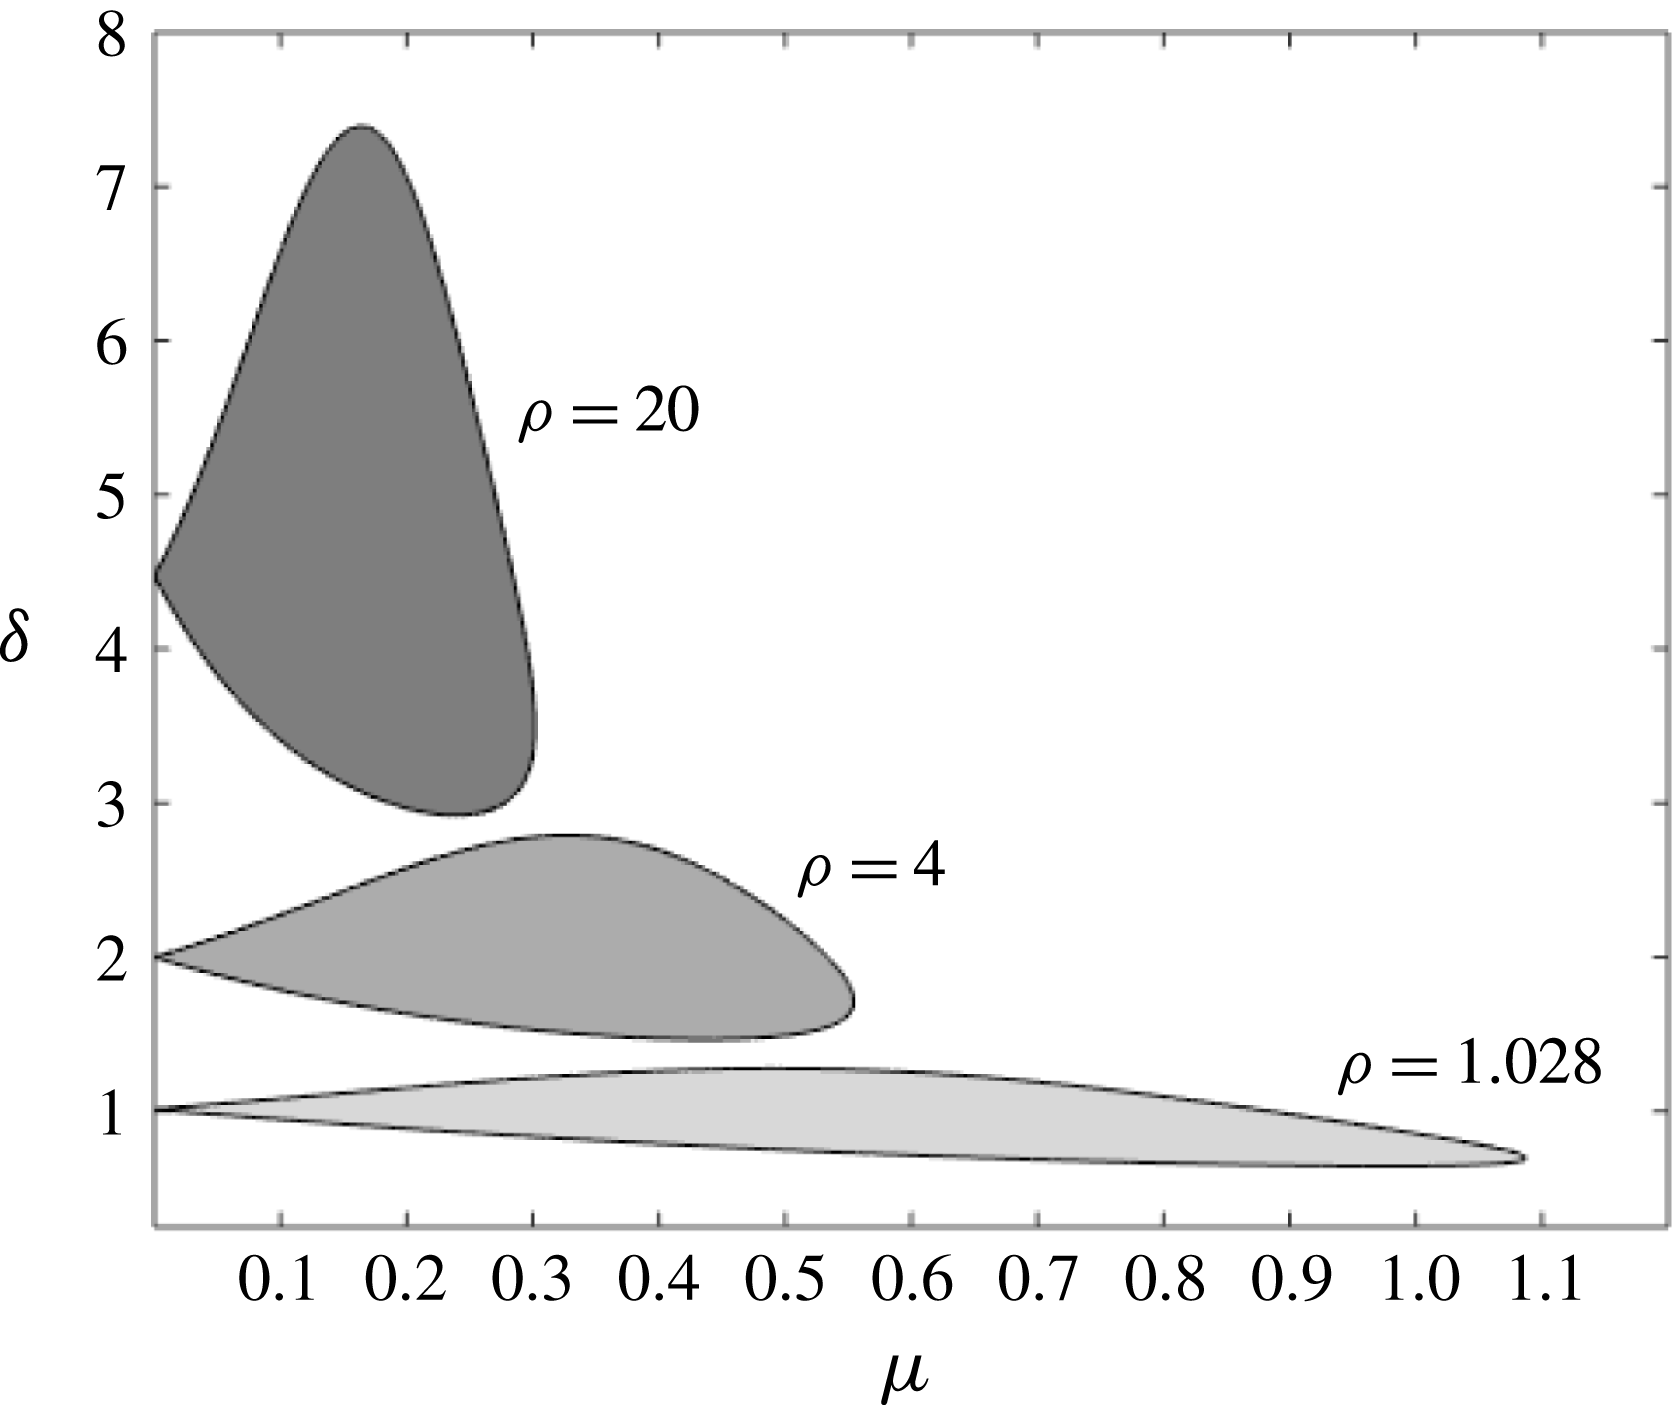
for discrete
 $\unicode[STIX]{x1D70C}$
values ranging from
 $\unicode[STIX]{x1D70C}=1.028$
to
 $\unicode[STIX]{x1D70C}=20$
. The boundaries indicate parameter configurations for which
 $c_{2}=0$
, and the interior corresponds to
 $c_{2}<0$
.

3.5 Including shear effects
We now consider the influence of linear shear within each fluid layer. In particular, we focus on the difference between the shape of solutions and the overall bifurcation structure of travelling wave solutions. Specifically, we examine solutions for
 $\unicode[STIX]{x1D6FF}=4$
,
 $\unicode[STIX]{x1D70C}=1.028$
and
 $\unicode[STIX]{x1D707}=\sqrt{0.1}$
that bifurcate from trivial flows that various configurations of stagnation points within each layer of the fluid.
Noting that we numerically solve for both the free surface
 $\unicode[STIX]{x1D702}$
and the tangential velocity
 $q_{2}(x)$
, we can conjecture a limiting wave height by imposing that
 $q_{1}(x)$
.
3.5.1 No stagnation points in either fluid
To look at an example in which we bifurcate from a flat surface with a stagnation point in the lower fluid, we choose
 $\unicode[STIX]{x1D714}_{1}=1$
and
 $\unicode[STIX]{x1D714}_{2}=-1$
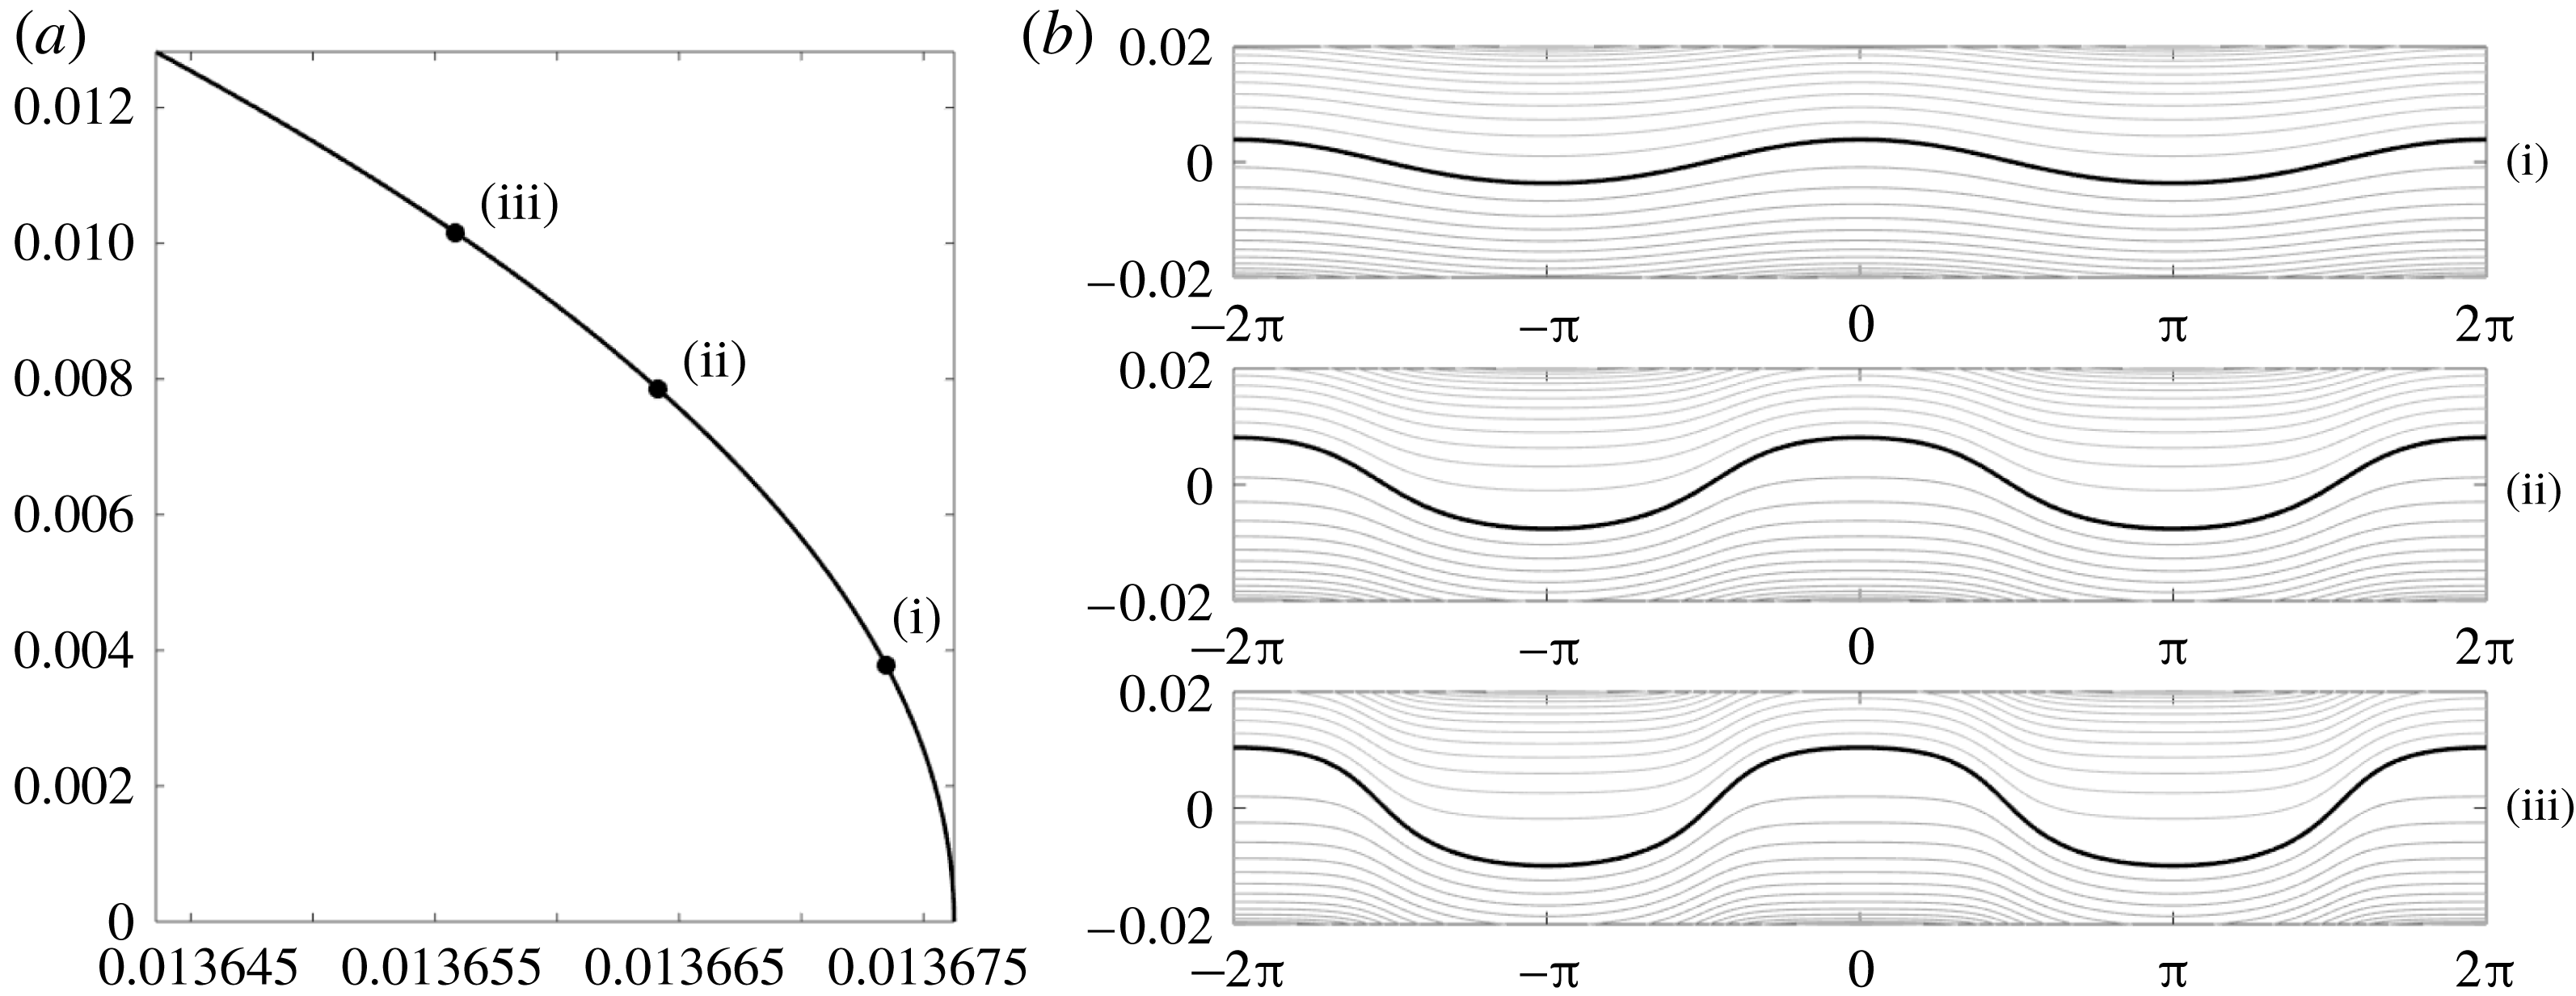
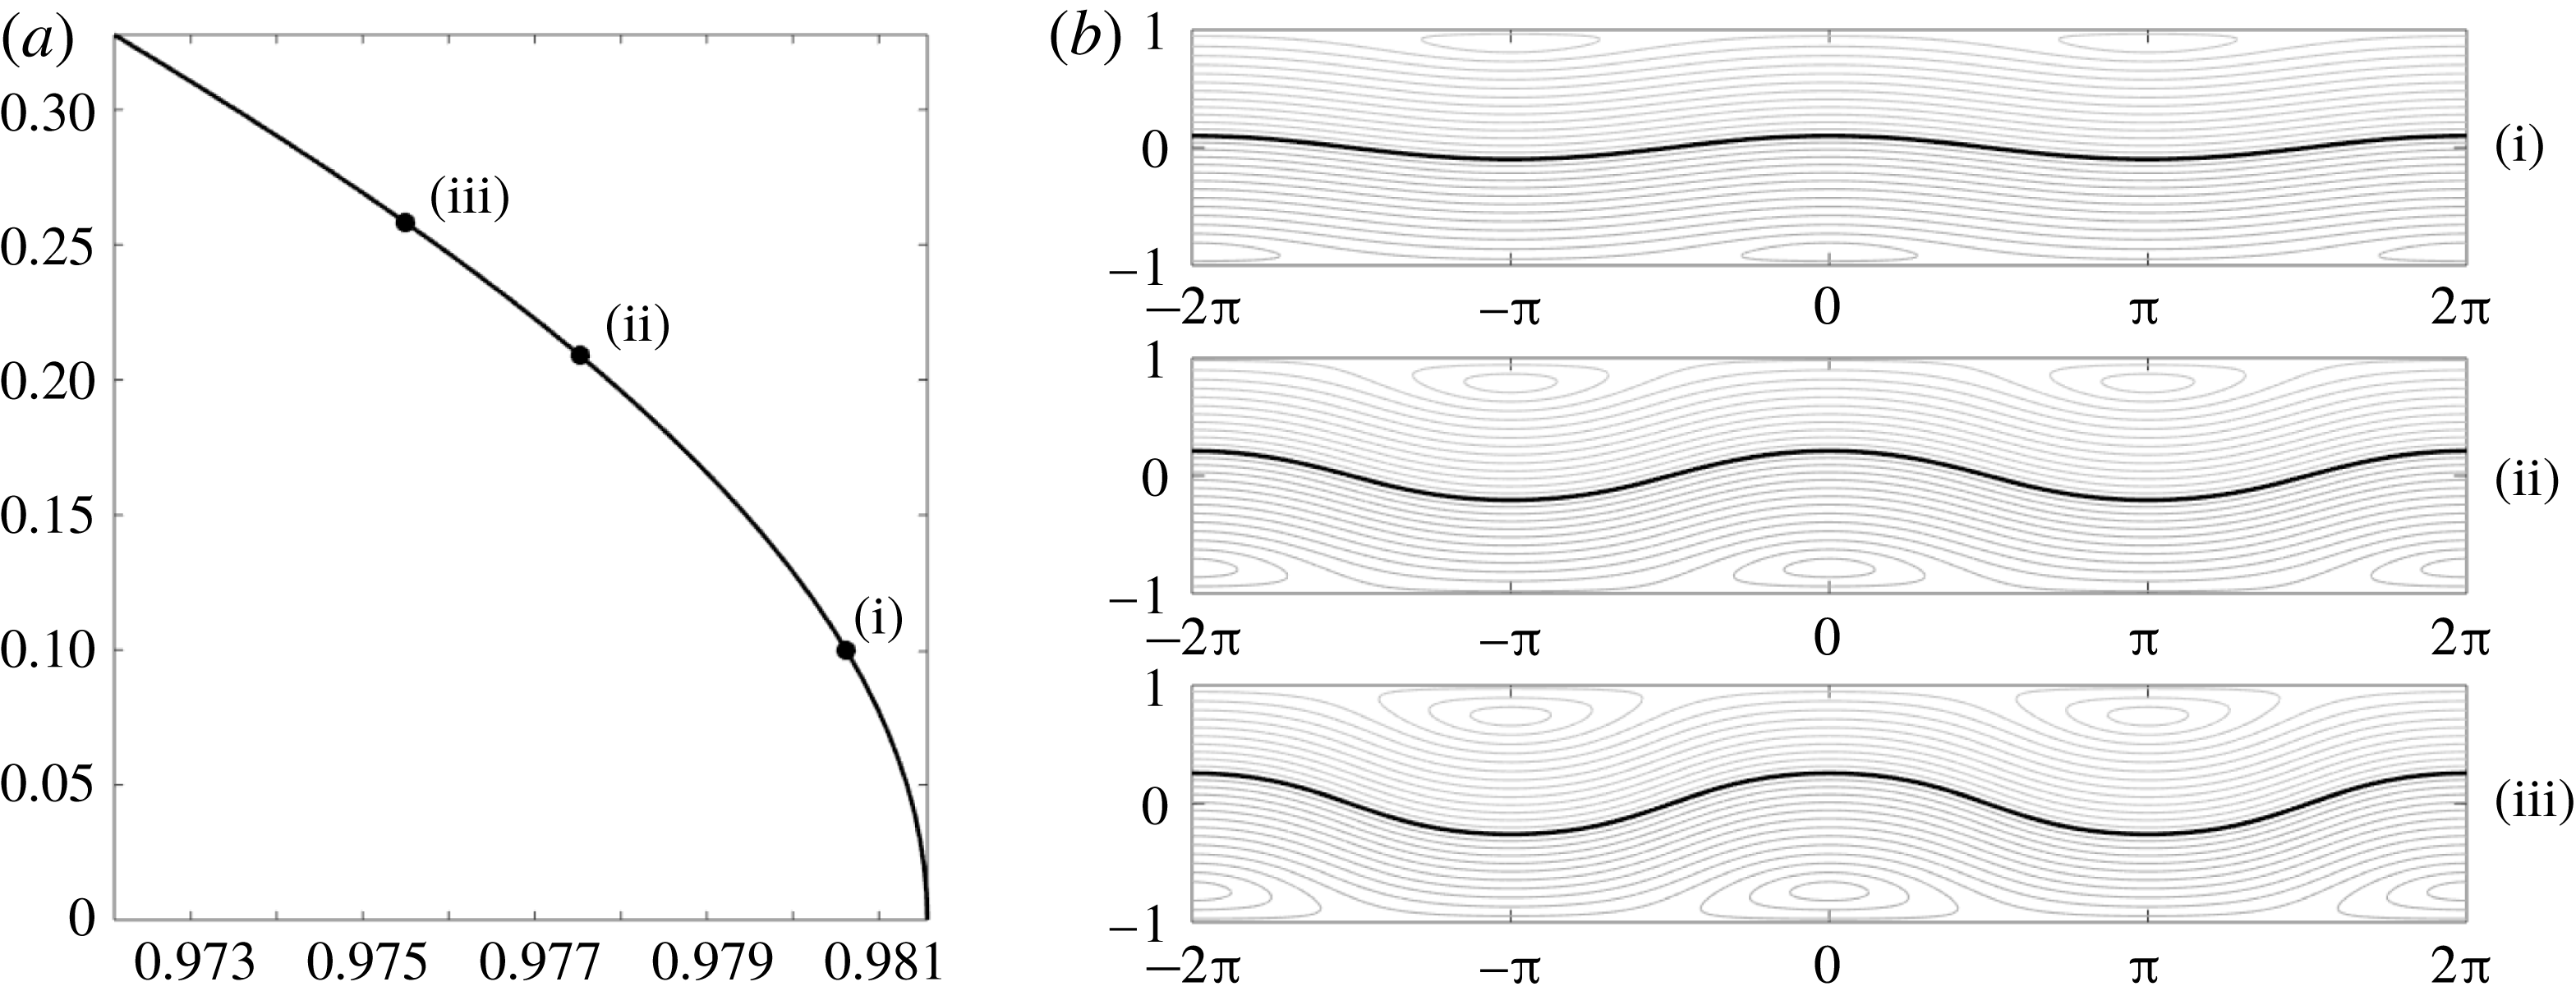
. As seen in figure 6(a,b), the absence of stagnation points does not appear to bias the interface towards elevation or depression, thus allowing for the development of far more symmetric nonlinear wave profiles than are seen in subsequent sections. We also note that, by referring to figure 2, the choice of vorticities corresponds to a negative value of
 $c_{2}$
. This is corroborated by the speed–amplitude curve in figure 6(a), which shows the speed of the wave decreasing with the increase in the amplitude.
Case for
 $\unicode[STIX]{x1D707}=\sqrt{0.1}$
,
 $\unicode[STIX]{x1D70C}=1.028$
,
 $\unicode[STIX]{x1D6FF}=4$
,
 $\unicode[STIX]{x1D714}_{1}=1$
and
 $\unicode[STIX]{x1D714}_{2}=-1$
, with amplitude–speed relationship in (a) and streamlines corresponding to increasing wave amplitudes (b).

3.5.2 Stagnation point in the upper fluid
To look at an example in which we bifurcate from a flat surface with a stagnation point in the lower fluid, we choose
 $\unicode[STIX]{x1D714}_{1}=\unicode[STIX]{x1D714}_{2}=-1$
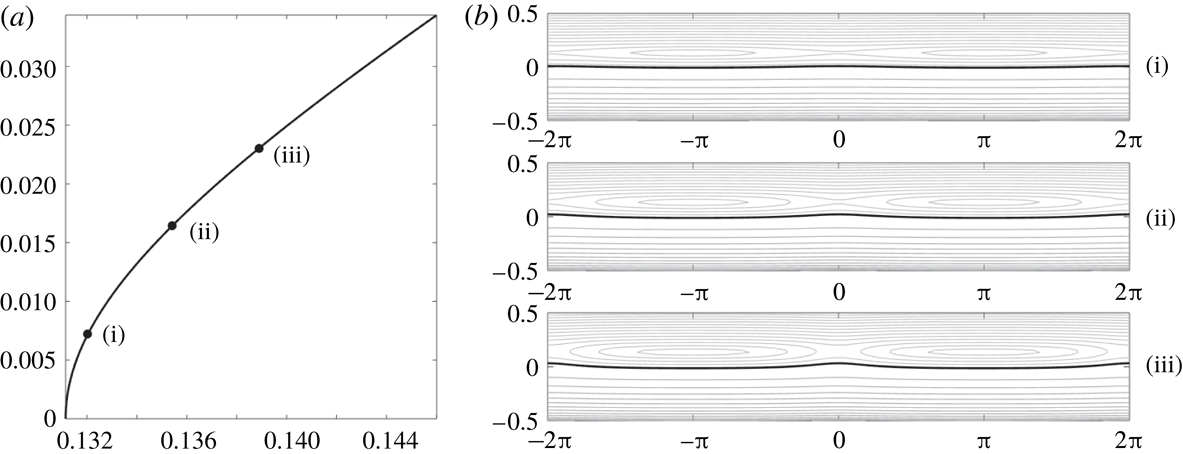
. As can be seen by examining the interface profiles in figure 7(a), the particular case we have chosen corresponds to interfaces of elevation. By examining the impact of the stagnation point on the streamline patterns seen in figure 7(b), we can see from where this tendency towards forming interfaces of elevation comes.
Case for
 $\unicode[STIX]{x1D707}=\sqrt{0.1}$
,
 $\unicode[STIX]{x1D70C}=1.028$
,
 $\unicode[STIX]{x1D6FF}=4$
,
 $\unicode[STIX]{x1D714}_{1}=-1$
and
 $\unicode[STIX]{x1D714}_{2}=-1$
, with amplitude–speed relationship in (a) and streamlines corresponding to increasing wave amplitudes (b). The stagnation point in the upper fluid region is seen at the saddle centred around
 $x=0$
as well as at the centres located at
 $x=\pm \unicode[STIX]{x03C0}$
.

3.5.3 Stagnation point in the bottom fluid
To look at an example in which we bifurcate from a flat surface with a stagnation point in the lower fluid, we choose
 $\unicode[STIX]{x1D714}_{1}=\unicode[STIX]{x1D714}_{2}=1$
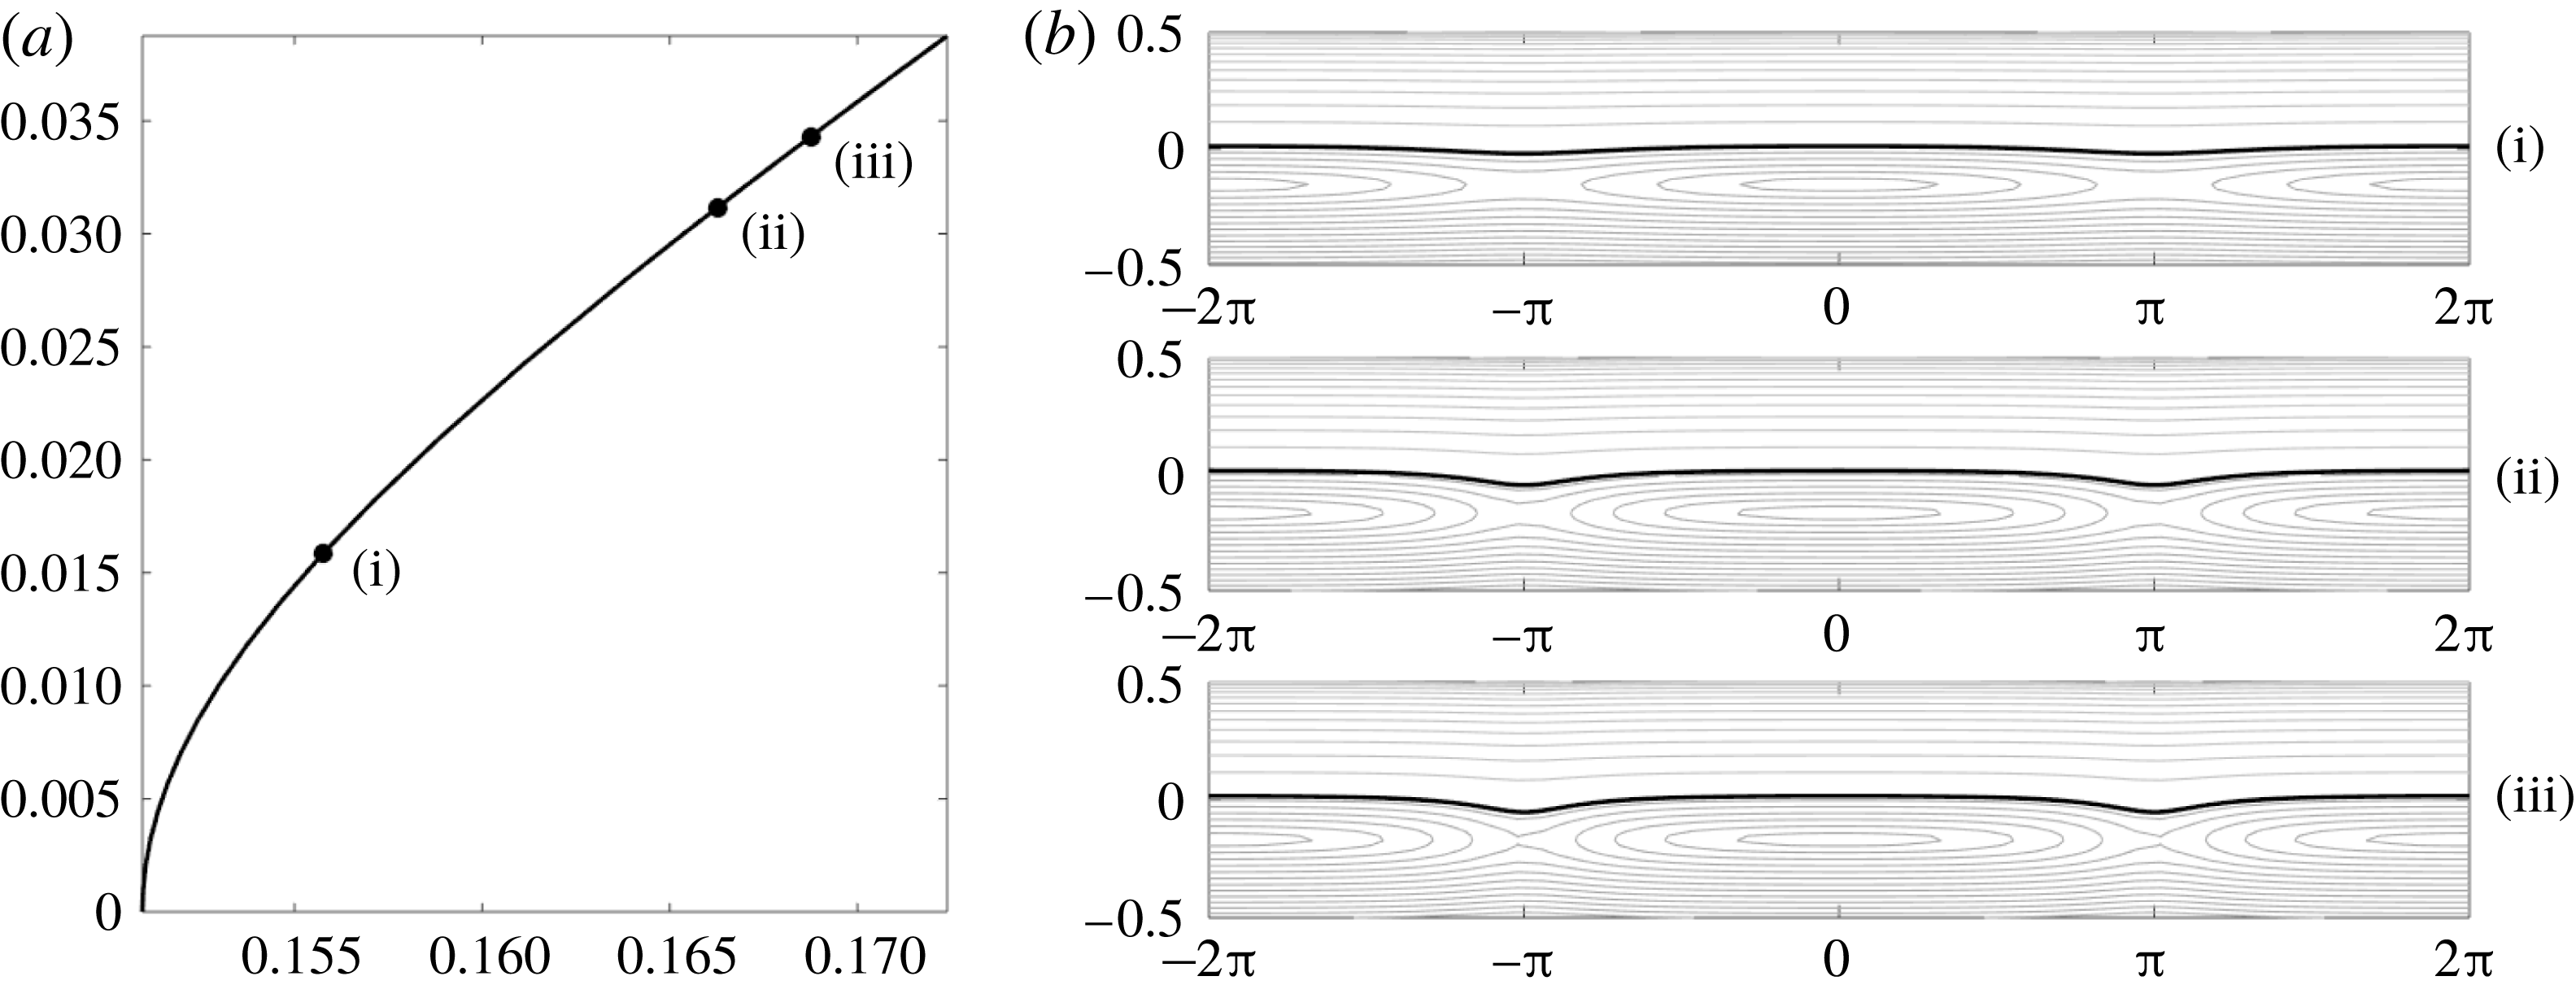
. As can be seen by examining the interface profiles in figure 8(a), the particular case we have chosen corresponds to interfaces of depression. By examining the impact of the stagnation point on the streamline patterns seen in figure 8(b), we can see from where this tendency towards forming interfaces of depression comes.
Case for
 $\unicode[STIX]{x1D707}=\sqrt{0.1}$
,
 $\unicode[STIX]{x1D70C}=1.028$
,
 $\unicode[STIX]{x1D6FF}=4$
,
 $\unicode[STIX]{x1D714}_{1}=1$
and
 $\unicode[STIX]{x1D714}_{2}=1$
, with amplitude–speed relationship in (a) and streamlines corresponding to increasing wave amplitudes (b). The stagnation point in the lower fluid region is seen at the saddles centred around
 $x=\pm \unicode[STIX]{x03C0}$
and the centre located at
 $x=0$
.

Case for
 $\unicode[STIX]{x1D6FF}=1$
,
 $\unicode[STIX]{x1D714}_{1}=-1$
,
 $\unicode[STIX]{x1D714}_{2}=1$
,
 $\unicode[STIX]{x1D70C}=1.028$
, with amplitude–speed relationship (a) and streamlines corresponding to increasing wave amplitudes (b). Stagnation points are showing in both the upper and lower fluids centred at
 $x=0$
in the lower fluid, and
 $x=\pm \unicode[STIX]{x03C0}$
in the upper fluid.

3.5.4 Stagnation point in both fluids
To see an example in which we bifurcate with stagnation points in both the lower and upper fluid regions, we choose
 $\unicode[STIX]{x1D714}_{1}=-1$
and
 $\unicode[STIX]{x1D714}_{2}=1$
. In this case, we see that the tendency is for waves of depression to form which increase in speed with amplitude; see figure 9(bi). The role of stagnation becomes increasingly more relevant on the nonlinear profile as its amplitude is increased, and thus has an ever increasing effect on the shape of the wave profile; compare figures 9(bii) and 9(biii). For lower amplitudes, the presence of stagnation points both above and below the interface allows for the kind of ambiguity between the interface being elevated or depressed for which the case of no stagnation points in the fluid allowed. However, the presence of stagnation points allows for the formation of broader rising portions of heavier fluid, which at larger amplitudes arguably makes the interface one of depression with sharper falling peaks that are shaped by having to move between the stagnation points in the fluid.
4 Stability formulation
We investigate the spectral stability of the travelling wave profiles computed in the previous section with respect to infinitesimal perturbations. First, it is important that we discuss what perturbations we wish to allow. It may appear natural to consider disturbances of the same period as the underlying stationary wave, as is often done in the literature. However, we wish to work with a more general class of disturbances; namely, we choose to include all bounded on the whole real line. It is important to realize that this class is the largest class of perturbations allowed by the physical problem at hand. Indeed, disturbances should be bounded and continuous functions, but there is no physical reason to restrict their spatial dependence to be periodic.
4.1 Stability formulation: problem reformulation
In order to investigate the stability of the travelling wave profiles with respect to such perturbations, it is necessary to reformulate the governing equations. Equation (2.22) is a local statement and does not require modification. However, (2.23) and (2.24) are non-local and in their current incarnation, apply specifically to waves of period
 $L$
. Thus, we cannot use the equation in its current form for any bounded function on the real line.
Following the method outlined in Deconinck & Oliveras (Reference Deconinck and Oliveras2011), we reformulate the non-local equations on the whole line via a spatial average value. For a continuous bounded function
 $f(x)$
, i.e.
 $f\in C_{b}^{0}(\mathbb{R})$
, let
 $\langle f\rangle$
represent the spatial average of the function defined by
 $$\begin{eqnarray}\langle f\rangle =\lim _{M\rightarrow \infty }\frac{1}{M}\int _{-M/2}^{M/2}f(x)\,\text{d}x.\end{eqnarray}$$
It should be noted that the kernel of this operation is quite large. For instance, all functions that approach zero as
 $|x|\rightarrow \infty$
have zero spatial average. Nevertheless, we may use the spatial average to replace (2.23) and (2.24) with the more general non-local equations given by
 $$\begin{eqnarray}\langle \text{e}^{-\text{i}kx}((\text{i}k\unicode[STIX]{x1D716}\unicode[STIX]{x1D707}^{2}\unicode[STIX]{x2202}_{t}\unicode[STIX]{x1D702}-\unicode[STIX]{x1D714}_{1}){\mathcal{C}}_{1}-\unicode[STIX]{x1D707}k(\unicode[STIX]{x1D716}(\unicode[STIX]{x2202}_{x}q_{1}-\unicode[STIX]{x1D714}_{1}\unicode[STIX]{x1D702})-c){\mathcal{S}}_{1})\rangle =0,\end{eqnarray}$$
and
 $$\begin{eqnarray}\langle \text{e}^{-\text{i}kx}((\text{i}k\unicode[STIX]{x1D716}\unicode[STIX]{x1D707}^{2}\unicode[STIX]{x2202}_{t}\unicode[STIX]{x1D702}-\unicode[STIX]{x1D714}_{2}){\mathcal{C}}_{2}-\unicode[STIX]{x1D707}k(\unicode[STIX]{x1D716}(\unicode[STIX]{x2202}_{x}q_{2}-\unicode[STIX]{x1D714}_{2}\unicode[STIX]{x1D702})-c){\mathcal{S}}_{2})\rangle =0,\end{eqnarray}$$
where
 ${\mathcal{S}}_{j}$
and
 ${\mathcal{C}}_{j}$
are defined as before. These equations are valid for all
 $k\in \mathbb{R}_{0}=\mathbb{R}-\{0\}$
, as no quantization condition is imposed by the periodicity of the solutions considered. Further, as solutions of increasingly larger period are considered, the set of
 $k$
values to be considered in (4.2) and (4.3) approaches a dense subset of the real line. The equation corresponding to
 $k=0$
is excluded, as before. Equations (4.2) and (4.3) allow us to perturb our travelling wave solution with any bounded perturbation regardless of periodicity.
4.2 Stability formulation: eigenvalue problem
Having generalized the dynamical equations to accommodate the perturbations we wish to consider, we briefly discuss the definition of spectral stability. A stationary solution of a nonlinear problem is spectrally stable if there are no exponentially growing modes of the corresponding linearized problem. To determine the spectral stability of the periodic travelling wave solutions, we start by considering a travelling wave solution set (
 $\unicode[STIX]{x1D702}_{0}(x-ct)$
,
 $\unicode[STIX]{x1D6FC}_{0}(x-ct)$
,
 $\unicode[STIX]{x1D6FD}_{0}(x-ct)$
). In the same travelling coordinate frame, we add a small perturbation of the form
 $$\begin{eqnarray}\displaystyle & \displaystyle \unicode[STIX]{x1D702}(x-ct,t)=\unicode[STIX]{x1D702}_{0}(x-ct)+\unicode[STIX]{x1D700}\unicode[STIX]{x1D702}_{1}(x-ct)\text{e}^{\unicode[STIX]{x1D706}t}+O(\unicode[STIX]{x1D700}^{2}), & \displaystyle\end{eqnarray}$$
 $$\begin{eqnarray}\displaystyle & \displaystyle q_{1}(x-ct,t)=\unicode[STIX]{x1D6FC}_{0}(x-ct)+\unicode[STIX]{x1D700}\unicode[STIX]{x1D6FC}_{1}(x-ct)\text{e}^{\unicode[STIX]{x1D706}t}+O(\unicode[STIX]{x1D700}^{2}), & \displaystyle\end{eqnarray}$$
 $$\begin{eqnarray}\displaystyle & \displaystyle q_{2}(x-ct,t)=\unicode[STIX]{x1D6FD}_{0}(x-ct)+\unicode[STIX]{x1D700}\unicode[STIX]{x1D6FD}_{1}(x-ct)\text{e}^{\unicode[STIX]{x1D706}t}+O(\unicode[STIX]{x1D700}^{2}), & \displaystyle\end{eqnarray}$$
where
 $\unicode[STIX]{x1D700}$
is a small parameter. The perturbations
 $\unicode[STIX]{x1D702}_{1}$
,
 $\unicode[STIX]{x1D6FC}_{1}$
and
 $\unicode[STIX]{x1D6FD}_{1}$
are moving at the same speed and in the same direction as the original travelling wave solution. Our goal is to determine the time dependence of the perturbation in order to determine how the deviation from the unperturbed solution evolves.
As we are linearizing about a travelling wave solution, we substitute the above expansions for
 $q_{1}$
,
 $q_{2}$
and
 $\unicode[STIX]{x1D702}$
into (2.22), (4.2) and (4.3) keeping only
 $O(\unicode[STIX]{x1D700})$
terms. This is rewritten compactly as
 $$\begin{eqnarray}\unicode[STIX]{x1D706}{\mathcal{L}}_{1}U(x)={\mathcal{L}}_{2}U(x),\end{eqnarray}$$
where
 ${\mathcal{L}}_{1}$
and
 ${\mathcal{L}}_{2}$
are
 $3\times 3$
matrices of linear operators and
 $U(x)$
is a vector-valued function with entries
 $U(x)=[\unicode[STIX]{x1D702}_{1}\;\unicode[STIX]{x1D6FC}_{1}\;\unicode[STIX]{x1D6FD}_{1}]^{\text{T}}$
. Details are provided in appendix A.
Since the time dependence of the perturbation depends exponentially on
 $\unicode[STIX]{x1D706}$
, we can determine information about the stability of the underlying travelling wave by determining all bounded solutions of this generalized eigenvalue problem. If any bounded solutions
 $U(x)$
exist for which the corresponding
 $\unicode[STIX]{x1D706}$
has a positive real part, the linear approximation of the solution will grow in time and thus the perturbed solution will exponentially diverge from the stationary solution in the linear approximation.
Since the coefficient functions of (4.7) are periodic in
 $x$
with period
 $2\unicode[STIX]{x03C0}$
, we decompose the perturbations further using Floquet’s theorem (see Deconinck & Kutz Reference Deconinck and Kutz2006; Curtis & Deconinck Reference Curtis and Deconinck2010). This allows us to further decompose
 $\unicode[STIX]{x1D702}_{1}$
,
 $\unicode[STIX]{x1D6FC}_{1}$
and
 $\unicode[STIX]{x1D6FD}_{1}$
in the form
 $$\begin{eqnarray}\unicode[STIX]{x1D702}_{1}(x)=\text{e}^{\text{i}px}\bar{\unicode[STIX]{x1D702}}_{1}(x),\quad \unicode[STIX]{x1D6FC}_{1}(x)=\text{e}^{\text{i}px}\bar{\unicode[STIX]{x1D6FC}}_{1}(x),\quad \unicode[STIX]{x1D6FD}_{1}(x)=\text{e}^{\text{i}px}\bar{\unicode[STIX]{x1D6FD}}_{1}(x),\end{eqnarray}$$
where
 $\bar{\unicode[STIX]{x1D702}}_{1}(x)$
,
 $\bar{\unicode[STIX]{x1D6FC}}_{1}$
and
 $\bar{\unicode[STIX]{x1D6FD}}_{1}$
are periodic with period
 $2\unicode[STIX]{x03C0}$
and
 $p$
(the Floquet exponent) can be restricted to the interval
 $[-1/2,1/2]$
.
Substituting the Floquet decomposition directly into (4.7) while simultaneously using the Fourier series representation for
 $\bar{\unicode[STIX]{x1D702}}_{0}$
,
 $\bar{\unicode[STIX]{x1D6FC}}_{0}$
and
 $\bar{\unicode[STIX]{x1D6FD}}_{0}$
, we obtain a new equation of the form
 $$\begin{eqnarray}\unicode[STIX]{x1D706}\tilde{{\mathcal{L}}}_{1}(p)\hat{U} =\tilde{{\mathcal{L}}}_{2}(p)\hat{U} ,\end{eqnarray}$$
where
 $\hat{U}$
represents the concatenation of three bi-infinite vectors of the Fourier coefficients for
 $\bar{\unicode[STIX]{x1D702}}_{1}$
,
 $\bar{\unicode[STIX]{x1D6FC}}_{1}$
and
 $\bar{\unicode[STIX]{x1D6FD}}_{1}$
. For
 $j=1,2$
,
 $\tilde{{\mathcal{L}}}_{j}(p)$
are linear operators that now depend on the Floquet exponent
 $p$
. Equation (4.9) gives a generalized bi-infinite eigenvalue problem for determining the spectrum of the linearized operator about the stationary travelling wave solutions.
Instead of directly solving the eigenvalue problem as stated above, a more stable approach is to reformulate the problem as a quadratic eigenvalue problem for the eigenvalue
 $\unicode[STIX]{x1D706}$
and the corresponding eigenfunction
 $\bar{\unicode[STIX]{x1D702}}_{1}$
of the form
 $$\begin{eqnarray}(\unicode[STIX]{x1D706}^{2}{\mathcal{A}}_{2}(p)+\unicode[STIX]{x1D706}{\mathcal{A}}_{1}(p)+{\mathcal{A}}_{0}(p))\bar{\unicode[STIX]{x1D702}}_{1}=0.\end{eqnarray}$$
Details regarding (4.10), the form of the
 ${\mathcal{A}}_{j}$
values for
 $j=0,1$
and
 $2$
are given in appendix B.
We solve this generalized eigenvalue problem numerically by truncating the Fourier series representation for
 $\bar{\unicode[STIX]{x1D702}}_{1}$
over
 $\mathbb{Z}-\{0\}$
to
 $\{\pm 1,\pm 2,\ldots ,\pm N\}$
where we have eliminated the zero mode as we only consider zero-average perturbations to the free surface. With this truncation, we obtain
 $2N$
quadratic equations for
 $\cdot 2N$
unknown Fourier coefficients of
 $\bar{\unicode[STIX]{x1D702}}_{1}$
. Finally, we note that due to the underlying symmetries in the problem, we may restrict the
 $p$
interval from
 $[-1/2,1/2]$
to
 $[0,1/2]$
and consider both
 $\unicode[STIX]{x1D706}$
and the conjugate of
 $\unicode[STIX]{x1D706}$
. Thus, for every
 $p\in [0,1/2]$
, we solve the generalized eigenvalue problem given by
 $$\begin{eqnarray}(\unicode[STIX]{x1D706}^{2}{\mathcal{A}}_{2}^{(N)}(p)+\unicode[STIX]{x1D706}{\mathcal{A}}_{1}^{(N)}(p)+{\mathcal{A}}_{0}^{(N)}(p))\hat{\bar{\unicode[STIX]{x1D702}}}_{1}^{(N)}=0,\end{eqnarray}$$
where the superscript
 $(N)$
denotes the projection onto the
 $N$
Fourier modes. This is done via the QZ algorithm (Moler & Stewart Reference Moler and Stewart1973). The dimension of the truncation on the Fourier modes is chosen so that both the eigenvalues and eigenvectors converge to 12 digits of accuracy.
5 Stability results
Using the formulation outlined in the previous section, we numerically compute spectra beginning with irrotational interfacial waves. It is well known that the trivial solution is subject to the Kelvin–Helmholtz instability provided that there is a jump in the horizontal velocity at the interface. However, the role that nonlinearities play in the formation of possible Kelvin–Helmholtz instabilities in our configuration is not as well known. In what follows then, we examine the role nonlinearity plays in the formation of instabilities by examining the spectra associated with the non-trivial TWSs presented in the previous section. We begin by considering the spectral stability corresponding to the irrotational problem and then subsequently explore the impact of linear shear.
Remark 4. Before we proceed to the general results, it is important to note that the density of the chosen Floquet parameters
 $p$
is critical for drawing the correct stability/instability conclusions. As outlined in the previous section, we should calculate the above quadratic eigenvalue problem for all
 $p$
values in the interval
 $[-1/2,1/2)$
. For example, if a uniform grid of
 $p$
values is chosen, any concerns about missing isolated stability phenomena can be resolved by choosing a finer resolution of
 $p$
values. However, the numerical resolution required becomes intractable as the underlying TWS become more nonlinear. Instead, we chose to work with a non-uniform set of
 $p$
values using the Hamiltonian structure of the problem (see McLean Reference McLean1982a
,Reference McLean
b
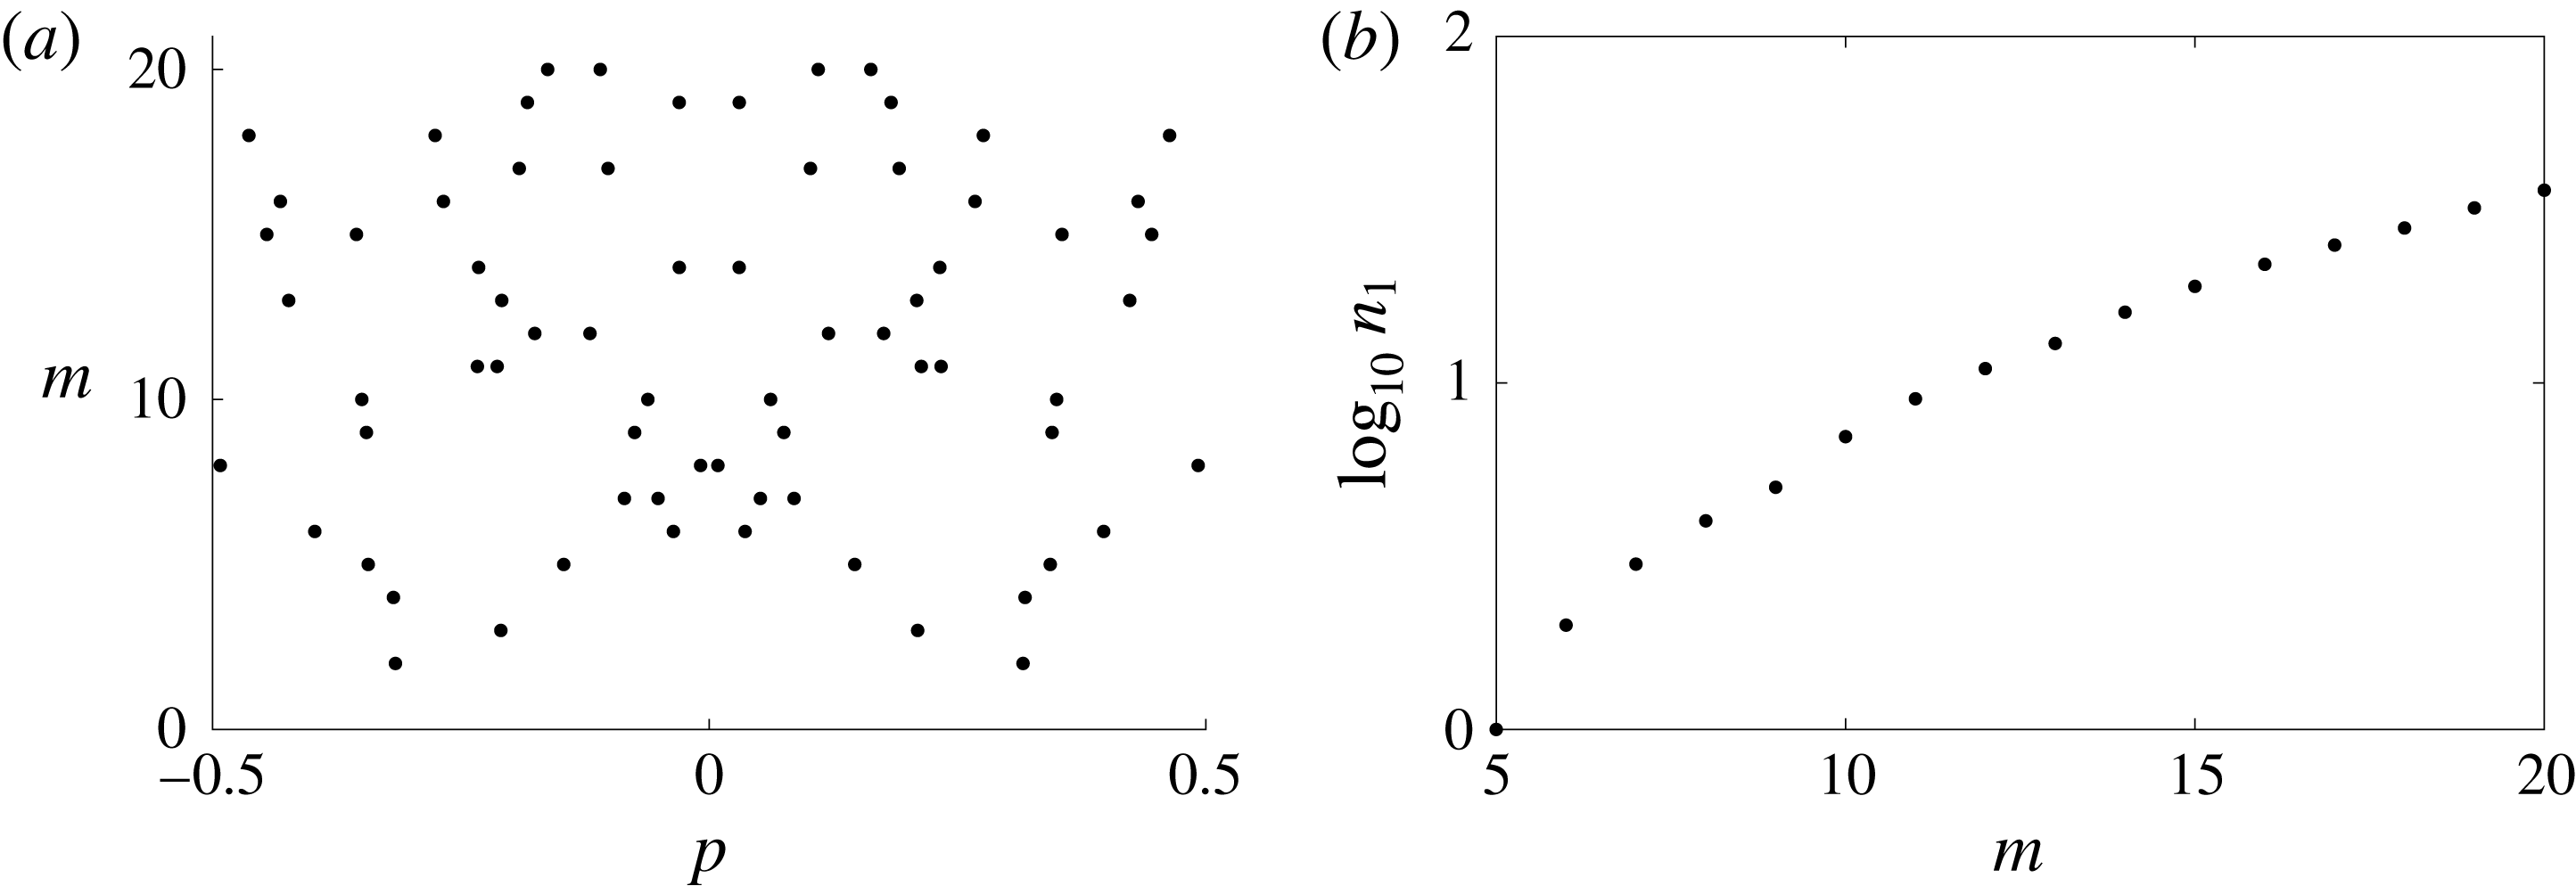
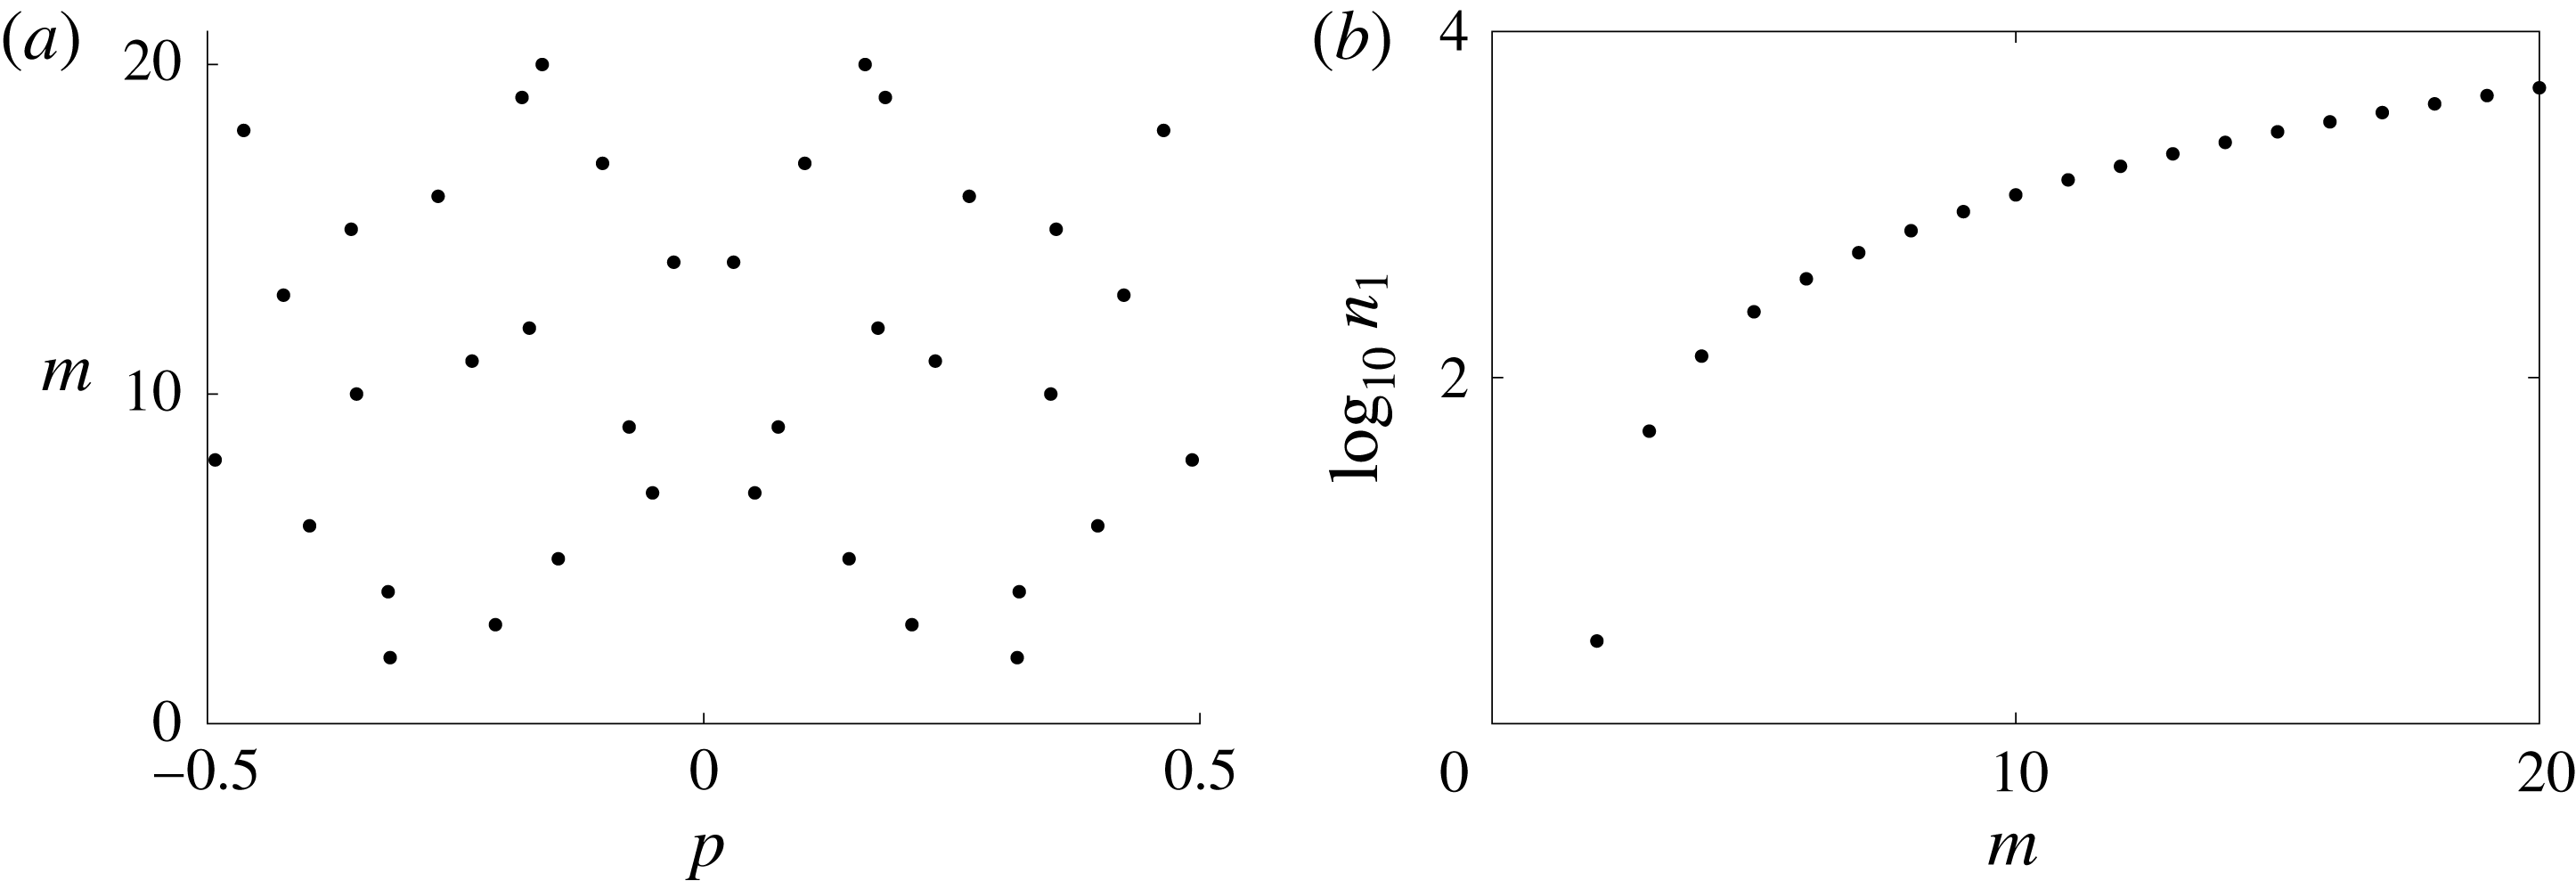
; Francius & Kharif Reference Francius and Kharif2006; Deconinck & Oliveras Reference Deconinck and Oliveras2011). These ideas rely on knowing the Krein signature of the eigenvalues for the trivial solution. See appendix C for the Hamiltonian formulation and computation of the Krein signatures.
For each branch of travelling wave solutions, we determine the Floquet parameters that give rise to the collisions of eigenvalues with opposite signatures. We concentrate a locally dense mesh of Floquet parameters about each of these parameter values in addition to a uniform spacing of
 $p$
values throughout the interval. As we consider the stability of non-trivial solutions, we refine and adapt our mesh of Floquet parameters to track instabilities.
It is straightforward to show that the trivial solution will be spectrally stable when there is no jump in the tangential velocity at the interface. However, the spectral stability is not guaranteed for non-trivial solutions that bifurcate from this solution. Throughout this section, we consider two separate classes of instabilities: modulational instabilities (MIs) corresponding to Floquet parameter
 $p\sim 0$
with
 $\unicode[STIX]{x1D706}$
in an
 $\unicode[STIX]{x1D716}$
neighbourhood of the origin, and high-frequency instabilities (HFIs) corresponding to the Floquet parameter
 $p\gg 0$
. It is worth noting that the HFIs are a result of collisions of eigenvalues not resulting for
 $p=0$
. While computations need only be done for Floquet parameters
 $p\in [0,1/2]$
due to underlying symmetries in the problem, we plot spectra over
 $p\in [-1,1]$
for illustrative purposes.
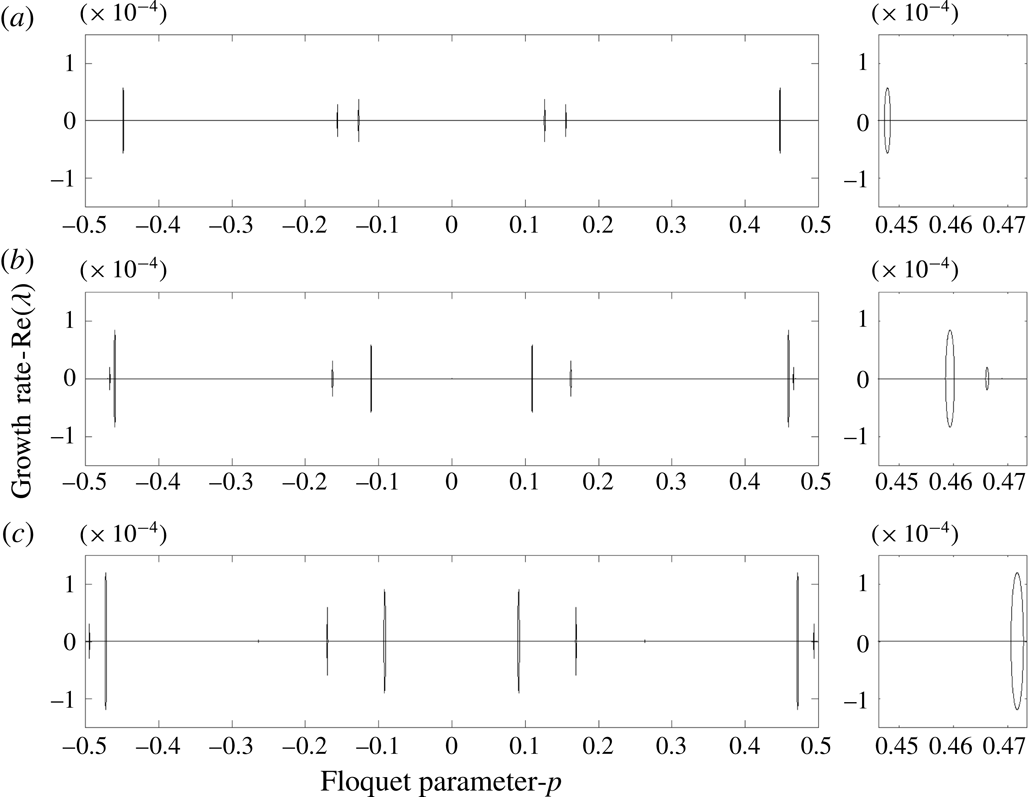
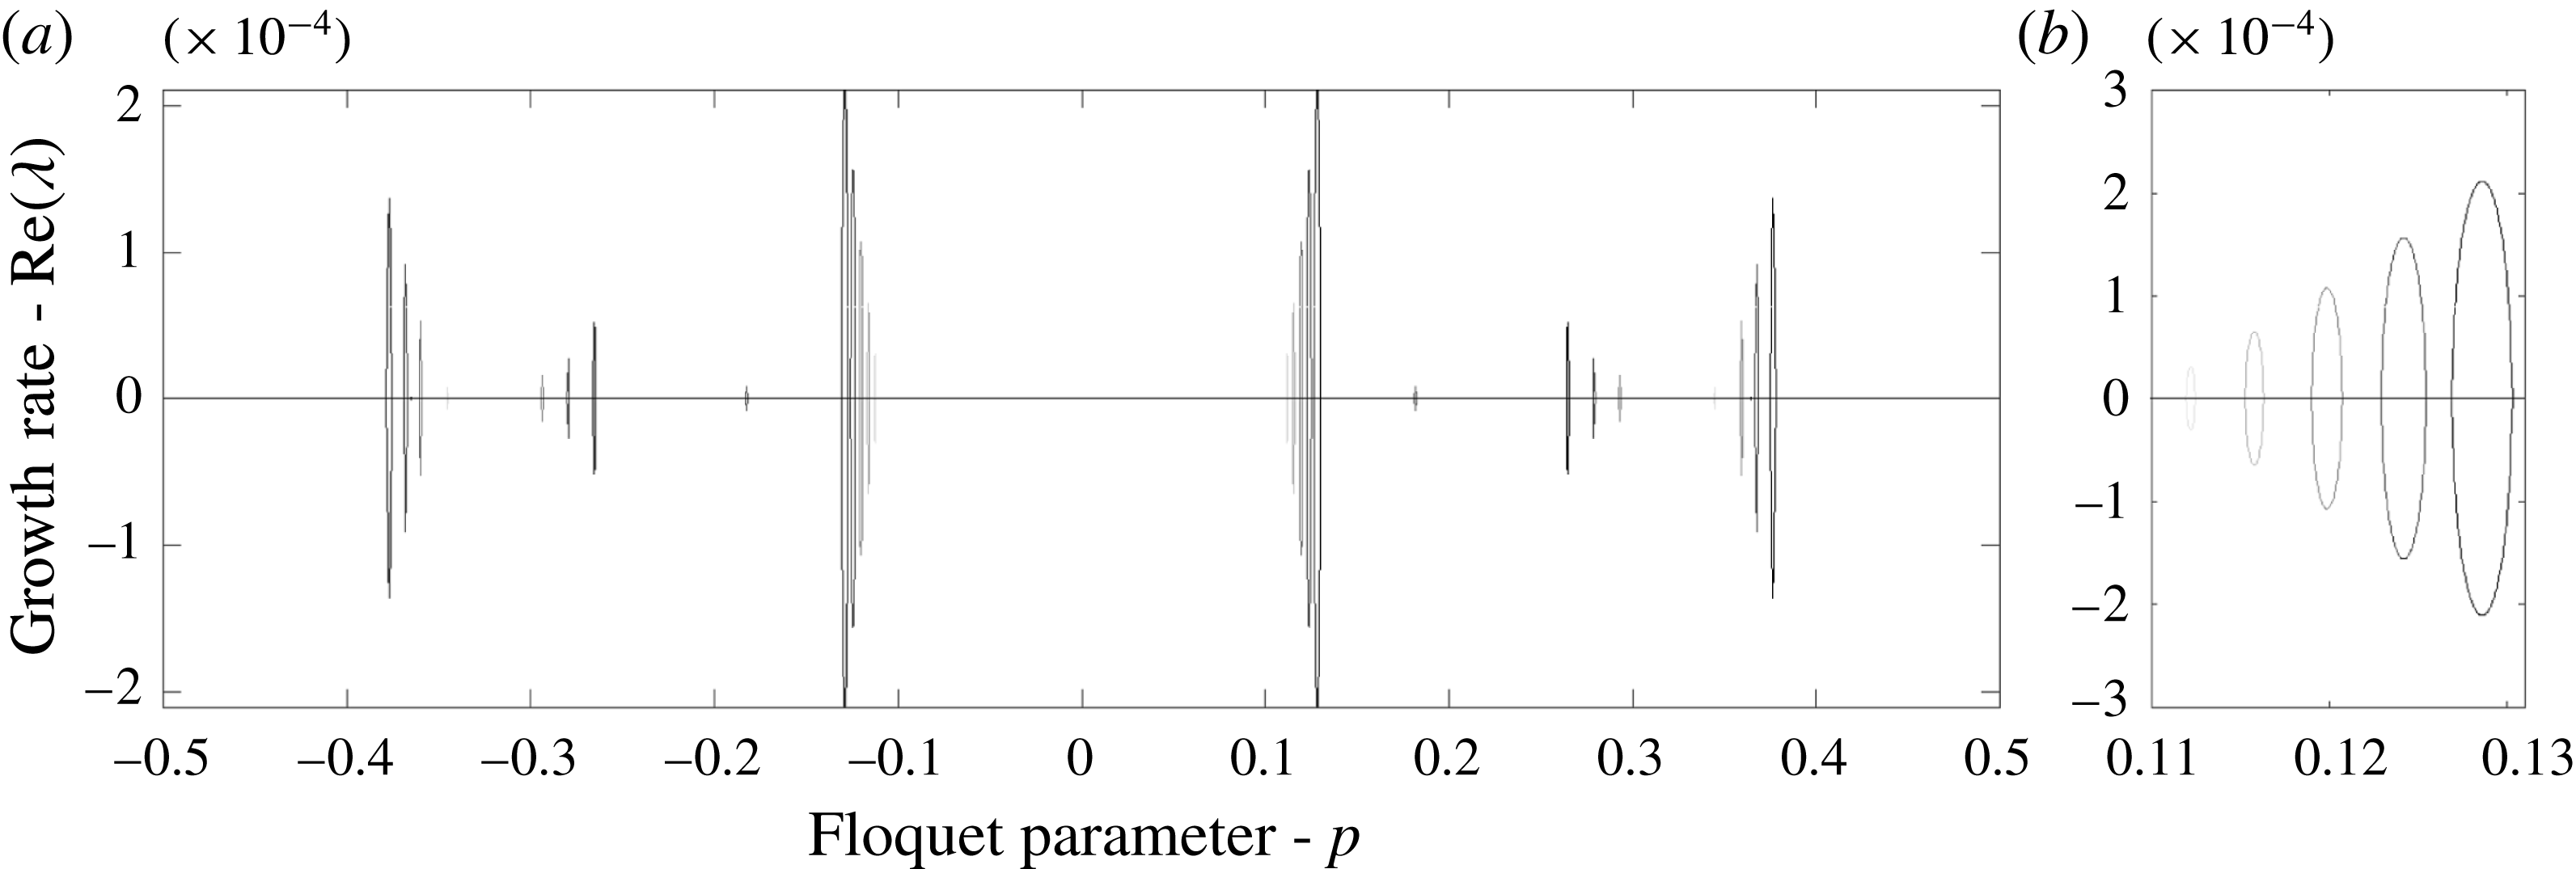
Real part of growth rates as a function of the Floquet parameter
 $p$
with
 $\unicode[STIX]{x1D714}_{1}=\unicode[STIX]{x1D714}_{2}=0$
,
 $\unicode[STIX]{x1D70C}=1.028$
,
 $\unicode[STIX]{x1D6FF}=4$
,
 $\unicode[STIX]{x1D707}=\sqrt{0.1}$
and
 $\unicode[STIX]{x1D716}$
increasing from
 $\unicode[STIX]{x1D716}\approx 0.16$
(a),
 $\unicode[STIX]{x1D716}\approx 0.18$
(b) and
 $\unicode[STIX]{x1D716}\approx 0.2$
. The right panel is a zoomed-in version of a region in the left panel and demonstrates that the spikes seen on the left do indeed represent continuous curves in the Floquet parameter. While narrow bands of HFIs are clearly visible, the absence of spectra near
 $p\sim 0$
shows MIs are not present.

For the configuration with
 $\unicode[STIX]{x1D707}=\sqrt{0.1}$
,
 $\unicode[STIX]{x1D716}=0.1$
and
 $\unicode[STIX]{x1D70C}=1.028$
, figure 10 shows the maximum growth rate as a function of the Floquet parameter
 $p$
for increasing values of the amplitude of the travelling wave solution
 $\unicode[STIX]{x1D702}$
. As in the single-layer free-boundary problem, all non-zero, small-amplitude travelling waves appear unstable to perturbations corresponding to HFIs localized around small bands of Floquet parameters
 $p$
. An interesting finding is that for the various depth ratios examined in the irrotational problem with fixed
 $\unicode[STIX]{x1D707}=\sqrt{0.1}$
, all solutions are not susceptible to MIs. However, if
 $\unicode[STIX]{x1D707}$
and
 $\unicode[STIX]{x1D6FF}$
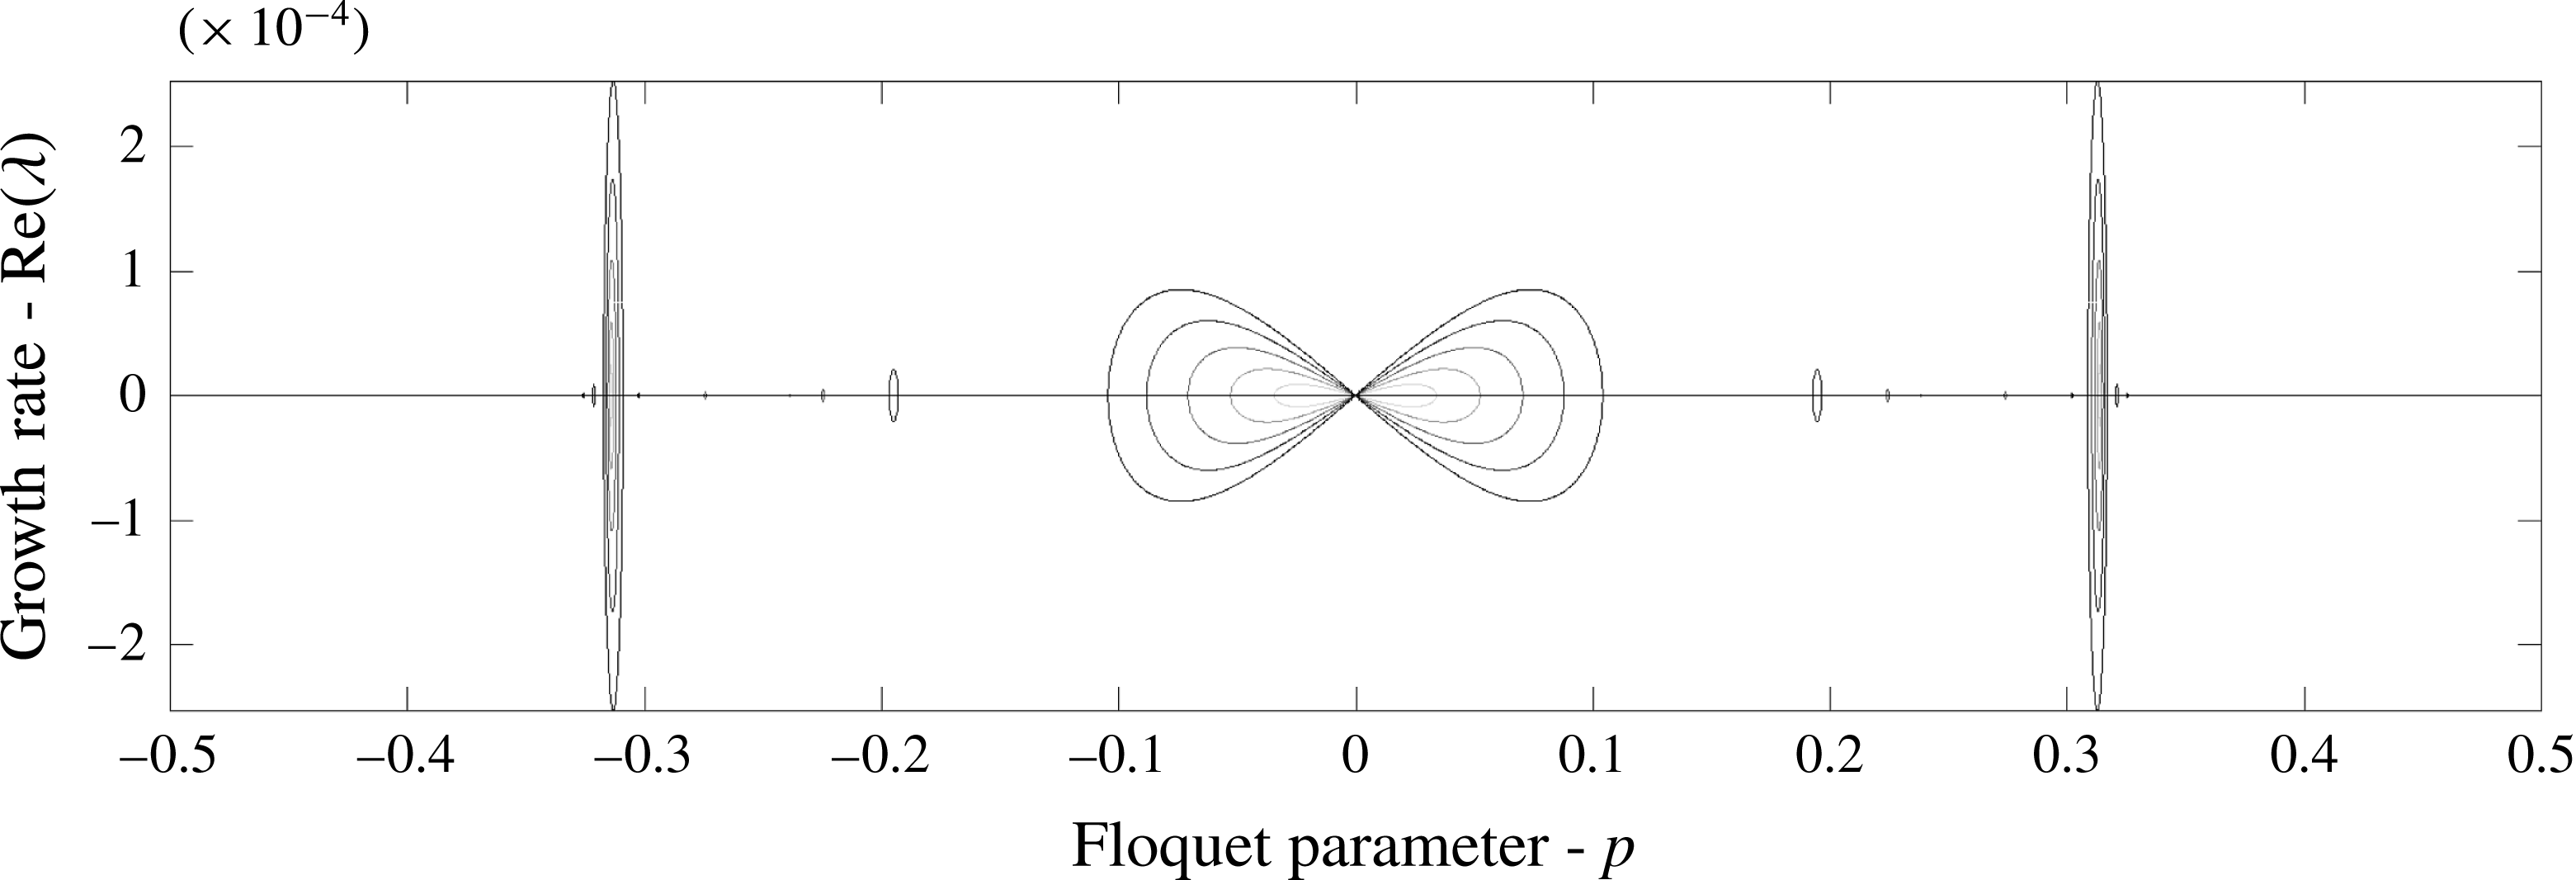
are varied appropriately, then even the irrotational problem may become susceptible to both HFI and MI. For example, as seen in figure 11, when
 $\unicode[STIX]{x1D707}=\unicode[STIX]{x1D6FF}=2$
,
 $\unicode[STIX]{x1D70C}=1.028$
, travelling wave solutions are susceptible to both HFIs and MIs where magnitude of both instabilities increase as a function of increasing
 $\unicode[STIX]{x1D716}$
.
Real part of growth rates as a function of the Floquet parameter
 $p$
with
 $\unicode[STIX]{x1D714}_{1}=\unicode[STIX]{x1D714}_{2}=0$
,
 $\unicode[STIX]{x1D70C}=1.028$
,
 $\unicode[STIX]{x1D6FF}=2$
,
 $\unicode[STIX]{x1D707}=2$
and
 $\unicode[STIX]{x1D716}$
increasing from
 $\unicode[STIX]{x1D716}\approx 0.001$
(light grey) to
 $\unicode[STIX]{x1D716}\approx 0.08$
(darker grey). Both MI and HFI are present in this scenario.

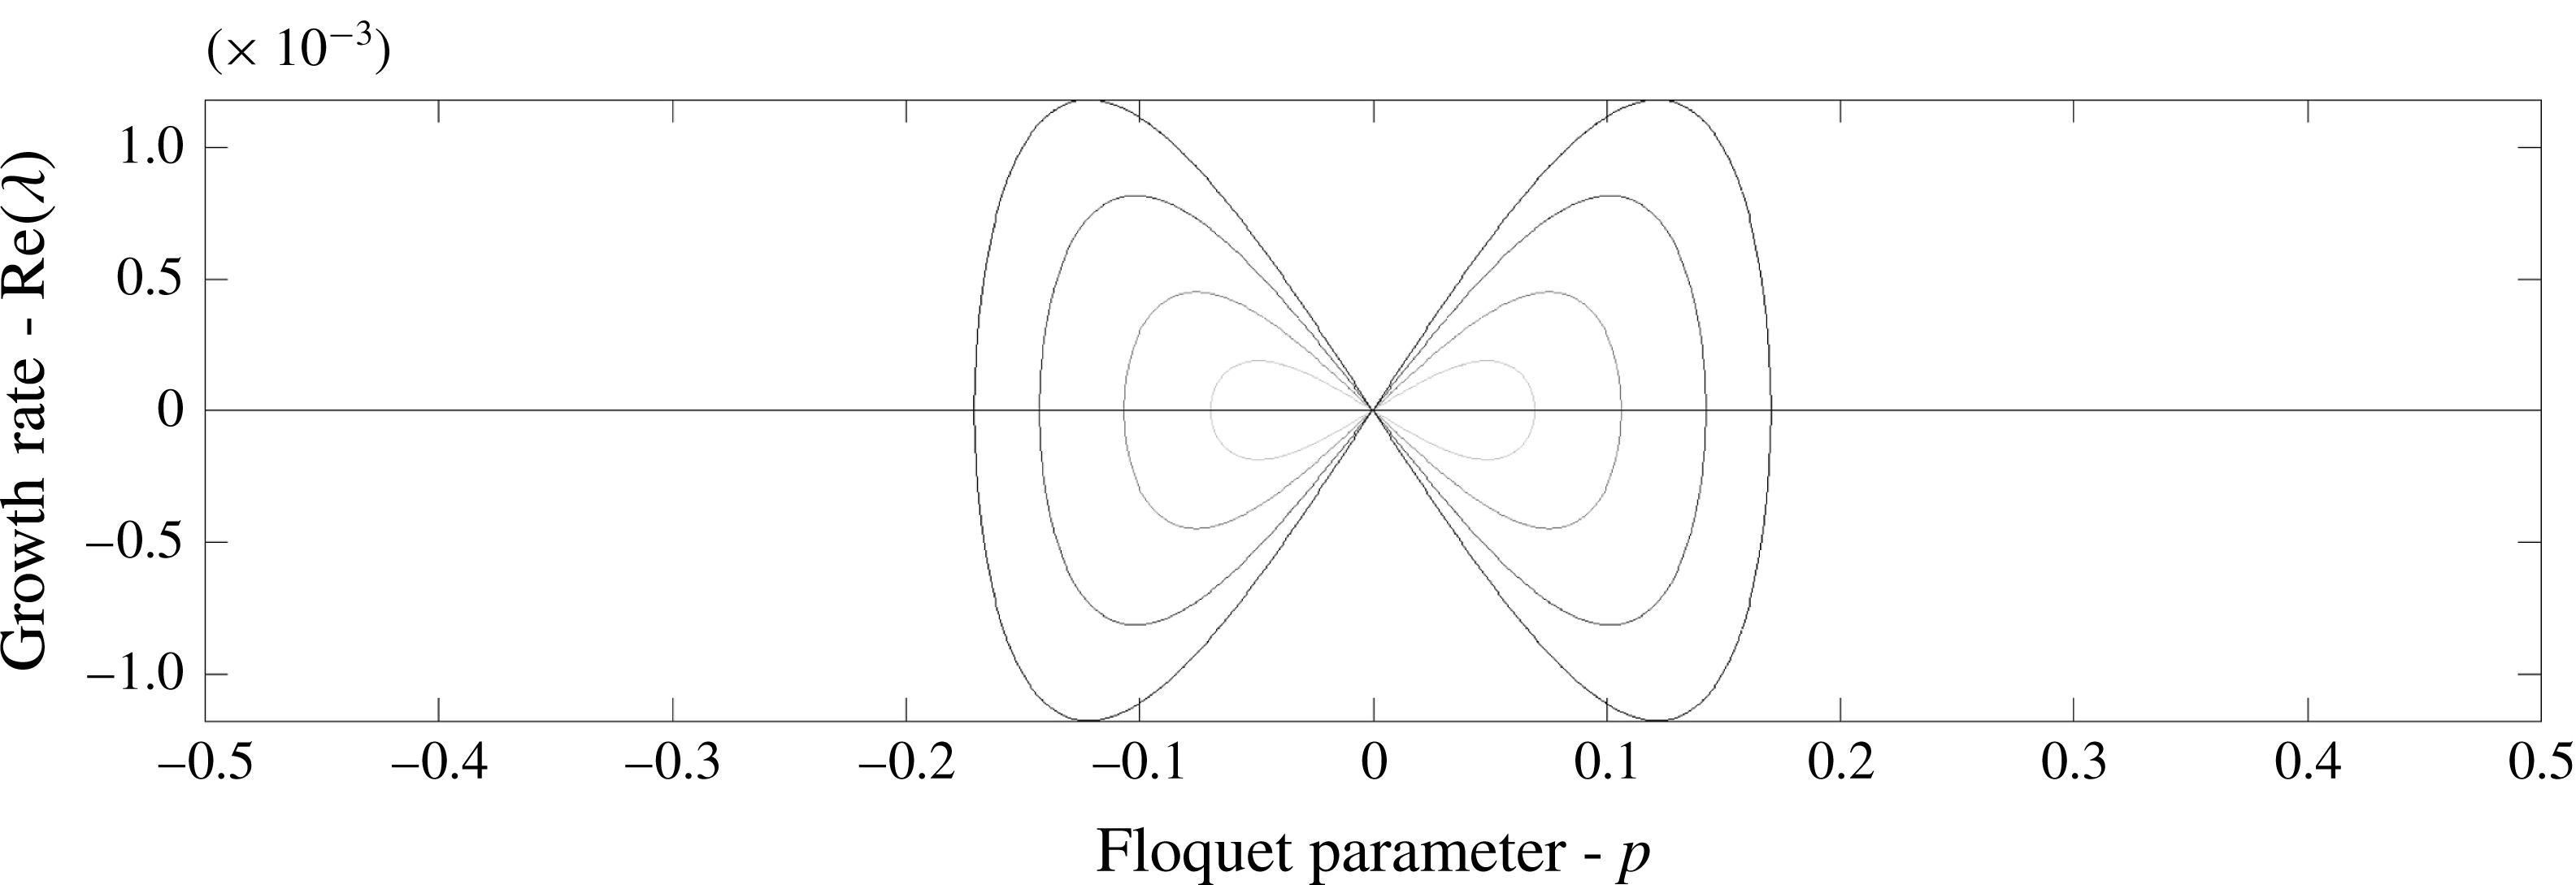
Real part of growth rates as a function of the Floquet parameter
 $p$
with
 $\unicode[STIX]{x1D714}_{1}=-1$
,
 $\unicode[STIX]{x1D714}_{2}=1$
,
 $\unicode[STIX]{x1D70C}=1.028$
,
 $\unicode[STIX]{x1D6FF}=2$
,
 $\unicode[STIX]{x1D707}=2$
and
 $\unicode[STIX]{x1D716}$
increasing from
 $\unicode[STIX]{x1D716}\approx 0.001$
to
 $\unicode[STIX]{x1D716}\approx 0.08$
. While the MI instabilities are present, the magnitudes of the HFIs have been significantly diminished due to the presence of the shear in both layers.

Including vorticity has an impact on the strength of HFI as seen in figure 12, thereby adding a mechanism for the suppression of instability not seen in the stratified shear-free case. Furthermore, the inclusion of vorticity may also impact whether or not a travelling wave is susceptible to MI. This hints at the more complicated role that vorticity plays in understanding and parameterizing regions of instability for the various parameters in the problem.
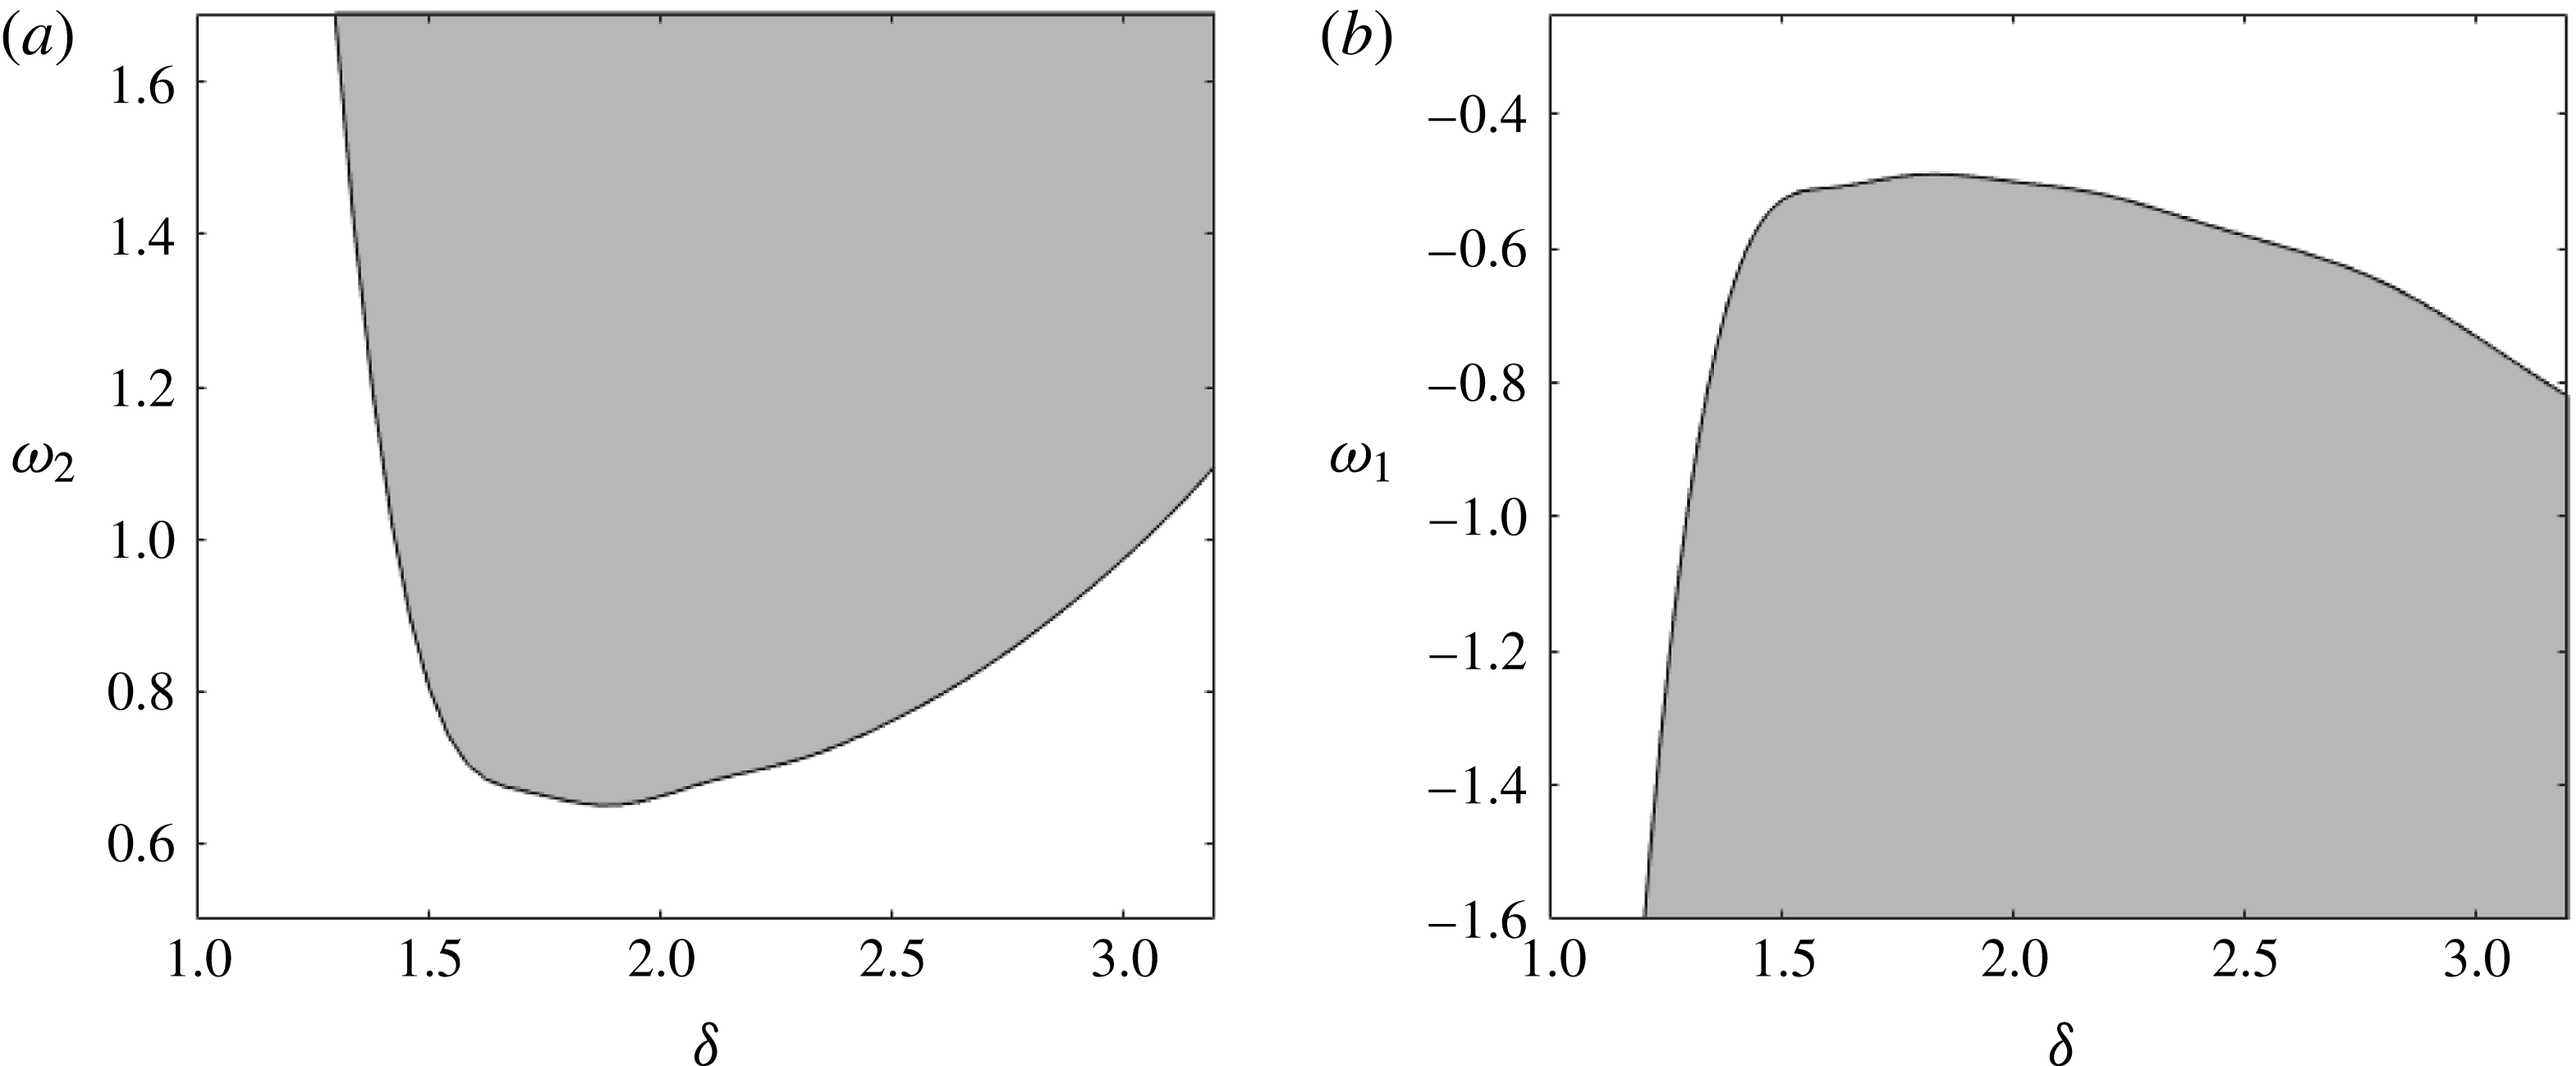
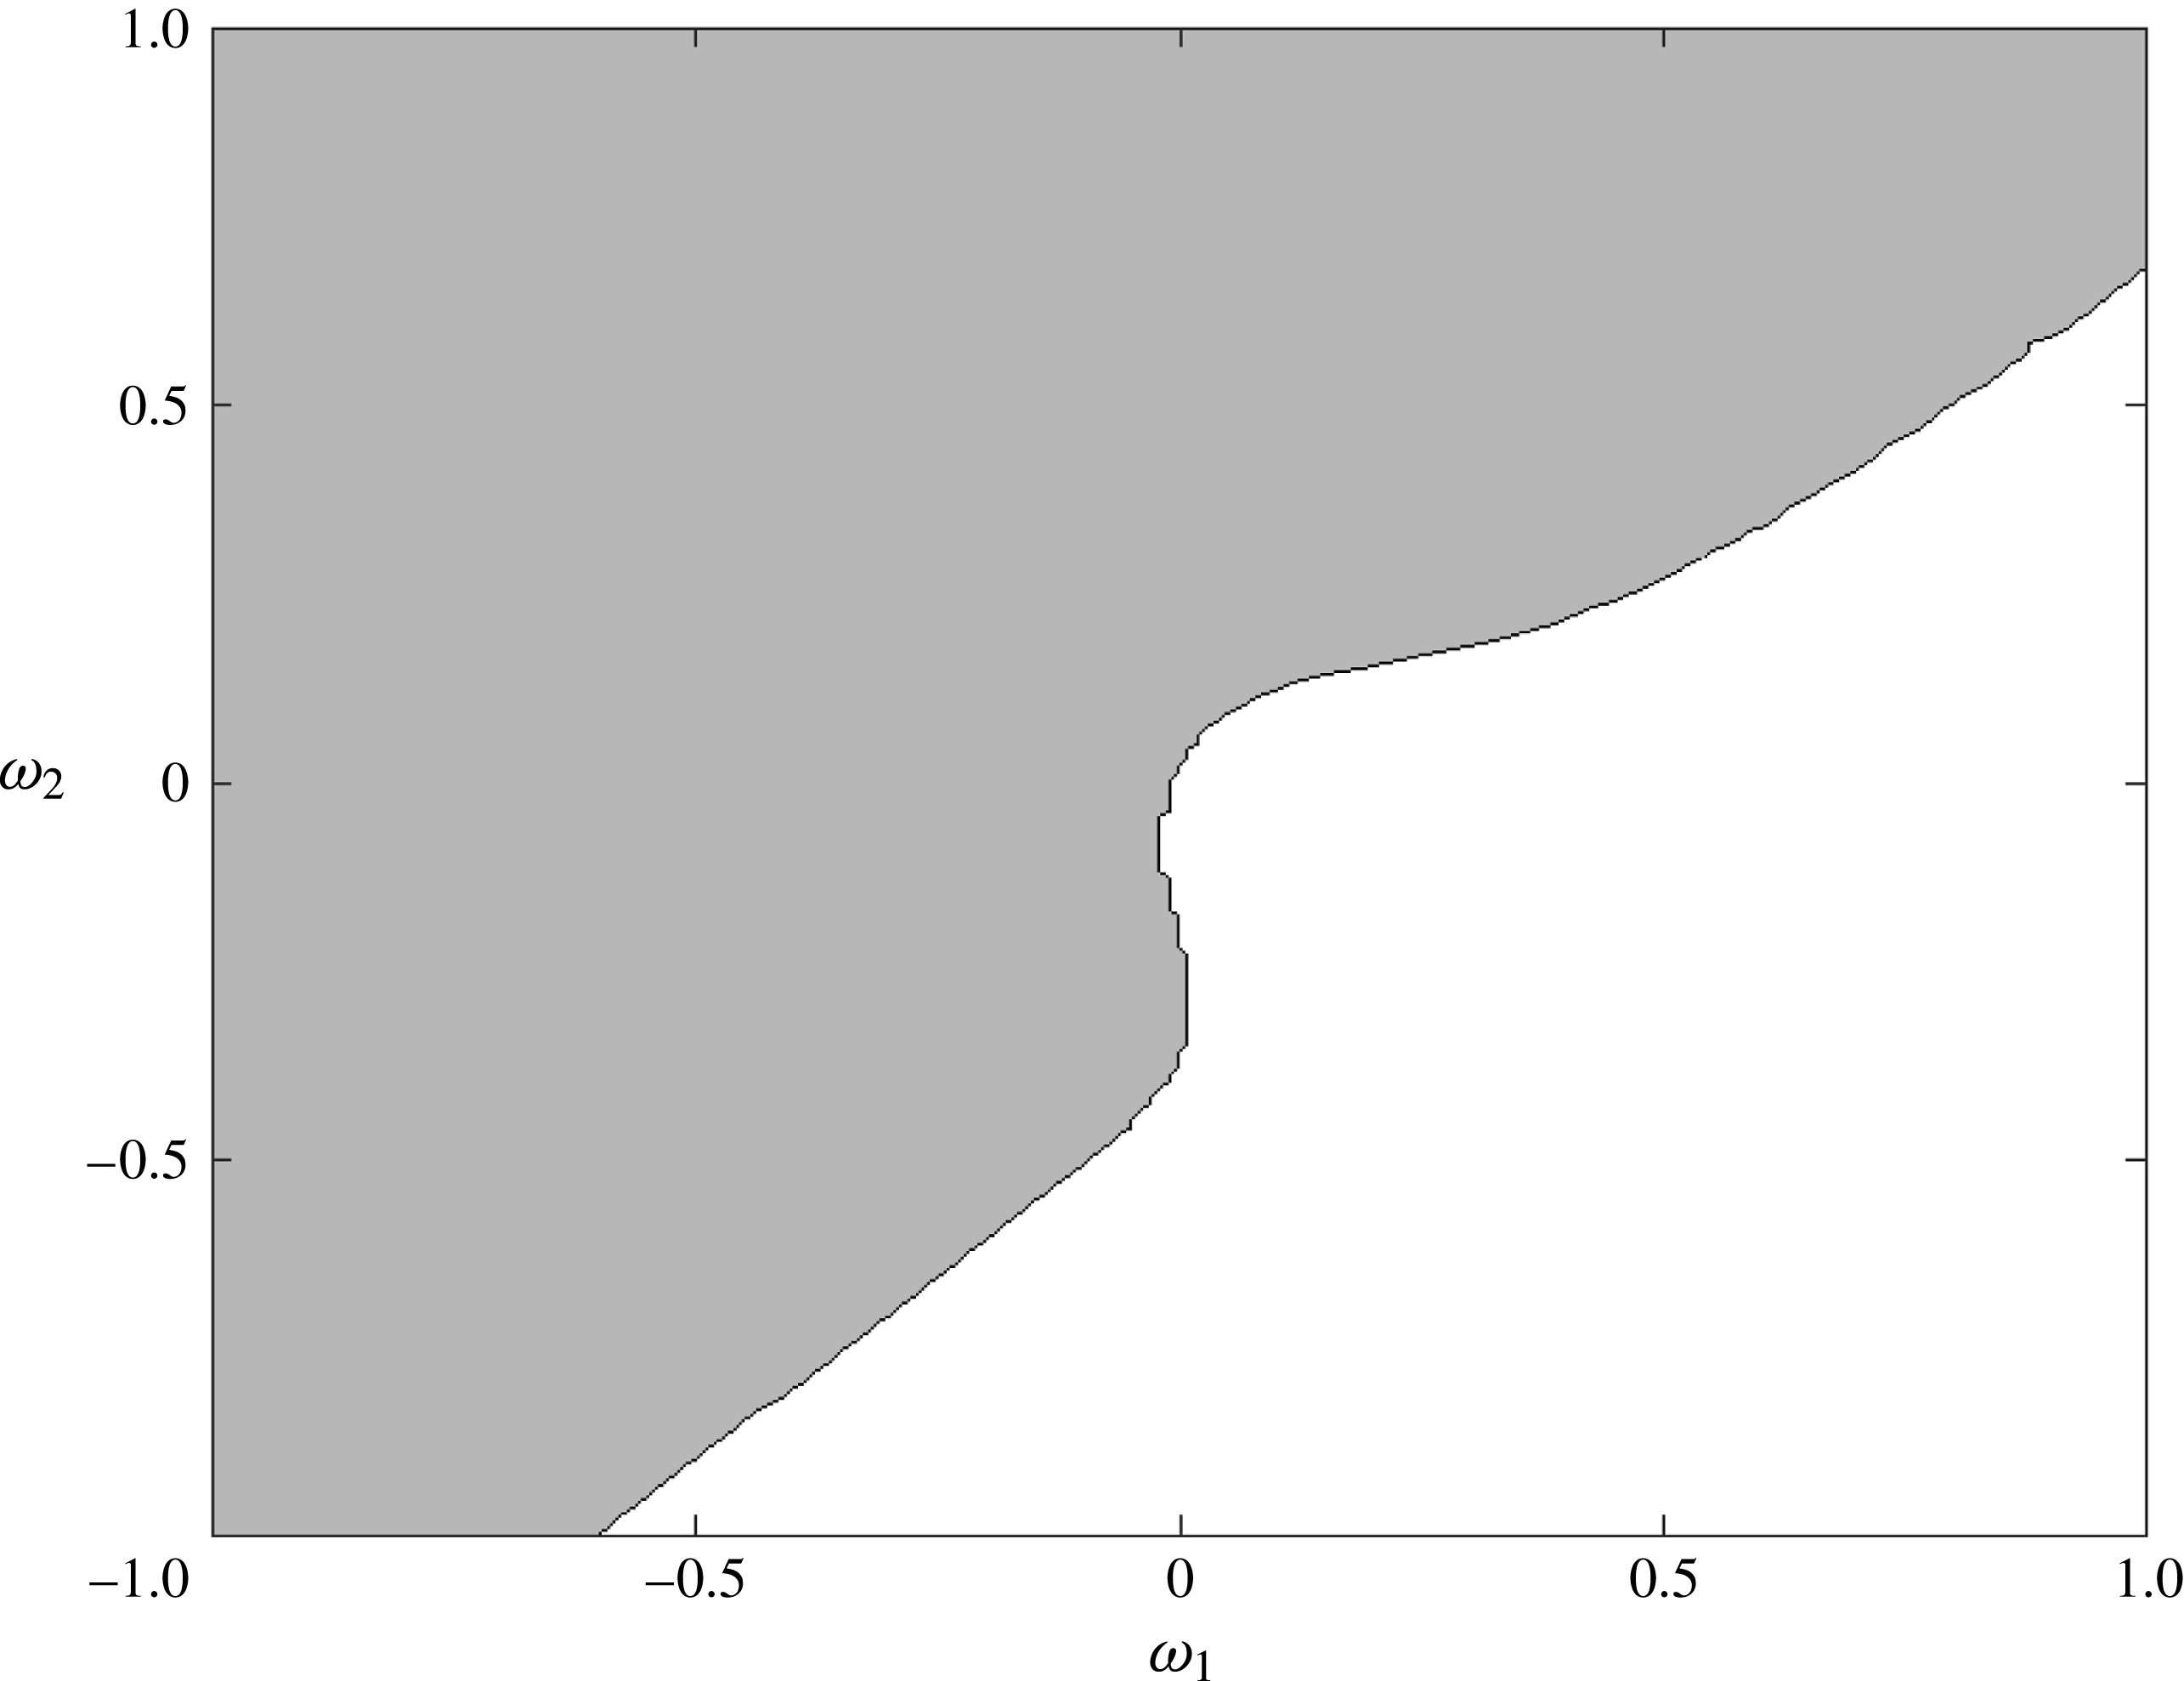
We explore this issue more fully in figures 13 and 14. Here, we show how different balances between the shear, depth ratio and
 $\unicode[STIX]{x1D707}$
either allow or suppress MIs. For simplicity, in figure 13, we have chosen
 $\unicode[STIX]{x1D707}=\unicode[STIX]{x1D6FF}$
. While this particular choice is unnecessary, not choosing so further expands the possible parameter space to be explored. In fixing either
 $\unicode[STIX]{x1D714}_{1}$
or
 $\unicode[STIX]{x1D714}_{2}$
to be zero, we can see how the threshold between
 $\unicode[STIX]{x1D6FF}$
and the strength of the shear must be related in order from small-amplitude travelling wave solutions to be susceptible to MI. Figure 14 shows how this relationship becomes more complicated as both
 $\unicode[STIX]{x1D714}_{1}$
and
 $\unicode[STIX]{x1D714}_{2}$
are simultaneously varied when
 $\unicode[STIX]{x1D707}=\unicode[STIX]{x1D6FF}=2$
. We note that we do not find MI for example when
 $\unicode[STIX]{x1D707}=\sqrt{0.1}$
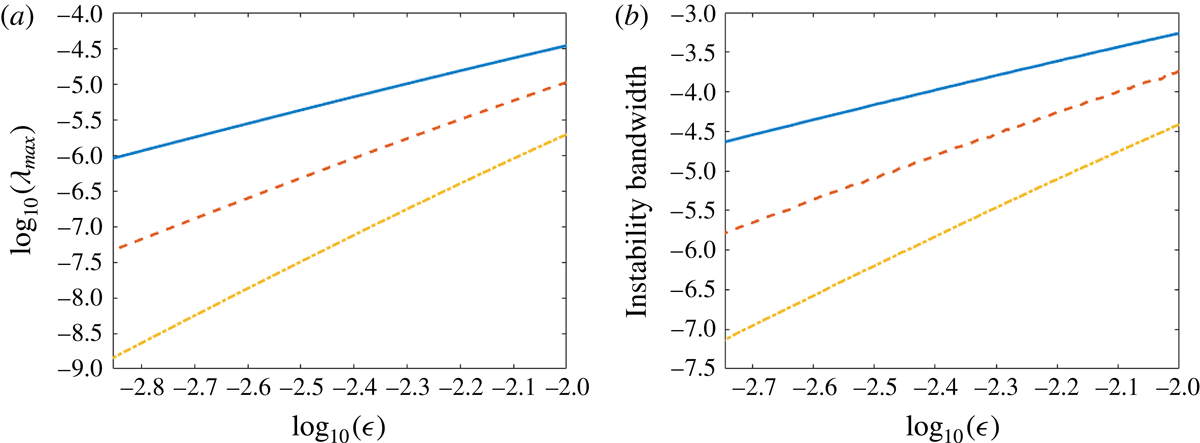
using the solutions presented in § 3 (see figures 15–17). Whether this is a general feature for all solutions, and what the exact parameter values are which ensure the existence of MIs, is a subject of future study. We do show that the growth rates, and bands of instability corresponding to
 $m=2$
,
 $m=3$
and
 $m=4$
resonant interactions grow at rates proportional to
 $\unicode[STIX]{x1D716}^{2}$
,
 $\unicode[STIX]{x1D716}^{3}$
, and
 $\unicode[STIX]{x1D716}^{4}$
as demonstrated in figure 18.
Region of MIs (shaded) as a function of
 $\unicode[STIX]{x1D6FF}$
for small-amplitude solutions with
 $\unicode[STIX]{x1D70C}=1.028$
and
 $\unicode[STIX]{x1D707}=\unicode[STIX]{x1D6FF}$
. (a) The value of
 $\unicode[STIX]{x1D714}_{1}$
is fixed to be zero while the value of
 $\unicode[STIX]{x1D714}_{2}$
is varied. (b) The value of
 $\unicode[STIX]{x1D714}_{2}$
is fixed to be zero while the value of
 $\unicode[STIX]{x1D714}_{1}$
is varied.

Region of MIs as a function of
 $\unicode[STIX]{x1D714}_{1}$
and
 $\unicode[STIX]{x1D714}_{2}$
for
 $\unicode[STIX]{x1D6FF}=2$
,
 $\unicode[STIX]{x1D70C}=1.028$
and
 $\unicode[STIX]{x1D707}=2$
.

When limited to the irrotational case (
 $\unicode[STIX]{x1D714}_{1}=\unicode[STIX]{x1D714}_{2}=0$
), our results appear in good qualitative agreement with the experimental results presented in Grue et al. (Reference Grue, Jensen, Rusøas and Sveen1999). Specifically, as noted in their work when
 $\unicode[STIX]{x1D6FF}=4$
, instabilities do not appear detectible except for large-amplitude waves. Given the time scales involved in their experiment, this appears consistent with the HFIs (see figure 10) being undetectable. Further investigation is clearly warranted, and we aim to compare more carefully in future work.
We note that these results generalize the behaviour of both MIs and HFIs in the irrotational case. These results also expand on those for a single-layer fluid, where the strength of the linear shear has a dramatic effect on the instability of TWSs as discussed in Thomas et al. (Reference Thomas, Kharif and Manna2012) for approximate models, and in Oliveras et al. (Reference Oliveras, Sprenger and Vasan2016) for the full water-wave problem.
Real part of growth rates as a function of the Floquet parameter
 $p$
with
 $\unicode[STIX]{x1D714}_{1}=-1$
,
 $\unicode[STIX]{x1D714}_{2}=1$
,
 $\unicode[STIX]{x1D70C}=1.028$
,
 $\unicode[STIX]{x1D6FF}=1$
,
 $\unicode[STIX]{x1D707}=\sqrt{0.1}$
and
 $\unicode[STIX]{x1D716}$
increasing from
 $\unicode[STIX]{x1D716}\approx 0.001$
(light grey) to
 $\unicode[STIX]{x1D716}\approx 0.25$
(darker grey). (b) Zoomed-in version of a region in (a) demonstrating that the spikes seen on the left do indeed represent continuous curves in the Floquet parameter. As the amplitude increases, the Floquet parameter associated with the dominant instability decreases.

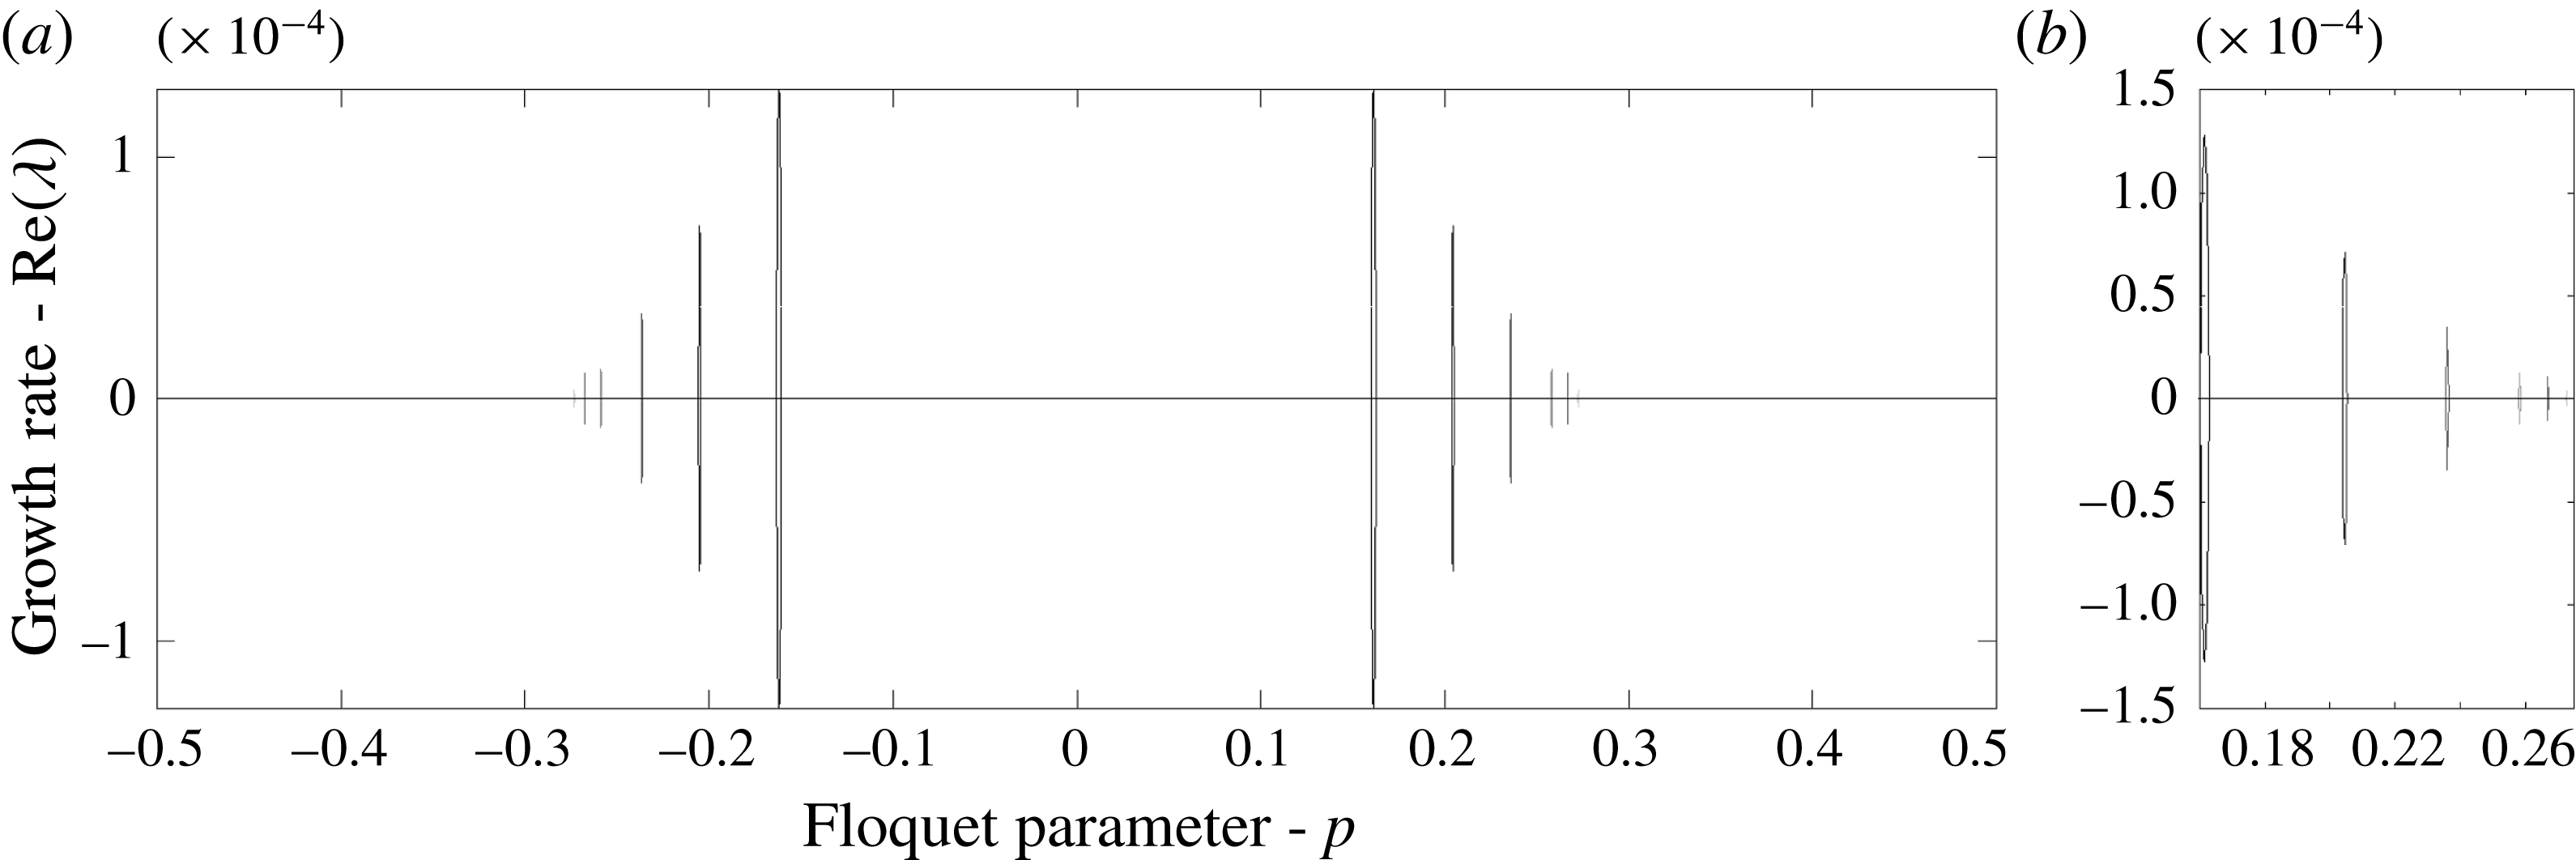
Real part of growth rates as a function of the Floquet parameter
 $p$
with
 $\unicode[STIX]{x1D714}_{1}=1$
,
 $\unicode[STIX]{x1D714}_{2}=1$
,
 $\unicode[STIX]{x1D70C}=1.028$
,
 $\unicode[STIX]{x1D6FF}=4$
,
 $\unicode[STIX]{x1D707}=\sqrt{0.1}$
and
 $\unicode[STIX]{x1D716}$
increasing from
 $\unicode[STIX]{x1D716}\approx 0.001$
(light grey) to
 $\unicode[STIX]{x1D716}\approx 0.015$
(darker grey). (b) Zoomed-in version of a region in (a) demonstrating that the spikes seen on the left do indeed represent continuous curves in the Floquet parameter. As the amplitude increases, the Floquet parameter associated with the dominant instability increases.

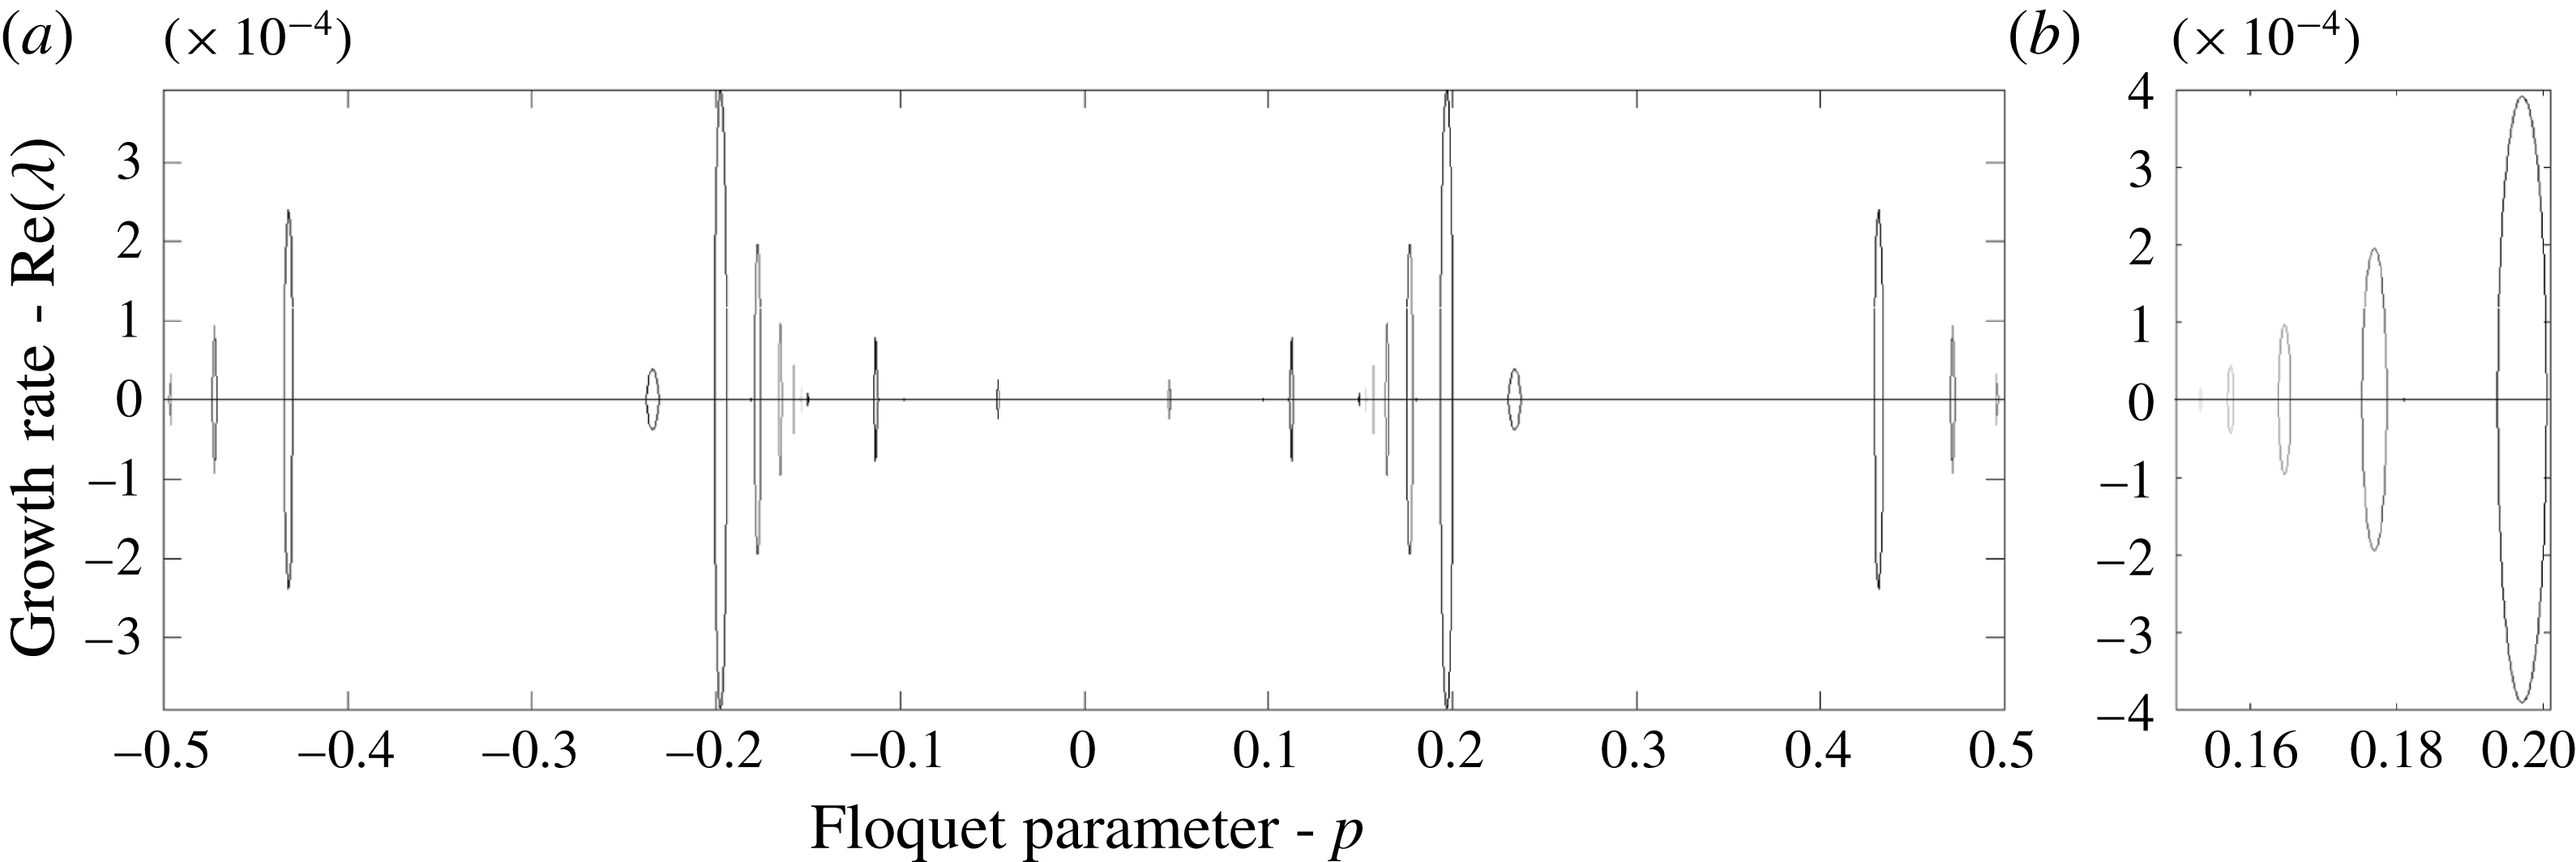
Real part of growth rates as a function of the Floquet parameter
 $p$
with
 $\unicode[STIX]{x1D714}_{1}=-1$
,
 $\unicode[STIX]{x1D714}_{2}=-1$
,
 $\unicode[STIX]{x1D70C}=1.028$
,
 $\unicode[STIX]{x1D6FF}=4$
,
 $\unicode[STIX]{x1D707}=\sqrt{0.1}$
and
 $\unicode[STIX]{x1D716}$
increasing from
 $\unicode[STIX]{x1D716}\approx 0.001$
(light grey) to
 $\unicode[STIX]{x1D716}\approx 0.03$
(darker grey). (b) Zoomed-in version of a region in (a) demonstrating that the spikes seen on the left do indeed represent continuous curves in the Floquet parameter. As the amplitude increases, the Floquet parameter associated with the dominant instability increases.

The bifurcation curves for the maximum growth rate (a) and instability bandwidth (b) as a function of amplitude corresponding to
 $m=2$
(solid),
 $m=3$
(dashed) and
 $m=4$
(dash-dot) as defined in appendix C. Here,
 $\unicode[STIX]{x1D714}_{1}=-1$
,
 $\unicode[STIX]{x1D714}_{2}=-1$
,
 $\unicode[STIX]{x1D70C}=1.028$
,
 $\unicode[STIX]{x1D6FF}=4$
,
 $\unicode[STIX]{x1D707}=\sqrt{0.1}$
.

6 Concluding remarks
Although we focused on internal waves limited to a one-dimensional interface represented by a graph, we can easily adapt our problem formulation to an arclength parametric representation (see Ashton & Fokas Reference Ashton and Fokas2011; Akers et al.
Reference Akers, Ambrose, Pond and Wright2016). Overturning waves, as well as the Hamiltonian structure of our will be explored in a future paper. Despite our focus on single-valued waves, we show a variety of solution structures depending on the density and depth ratios yielding waves of elevation or depression as characterized by the sign of
 $c_{2}$
in our formulation. This is directly related to the second-order correction of the tangent angle of the interface as prescribed by the vortex-sheet formulation of the interface for irrotational fluids over infinite depth in Akers et al. (Reference Akers, Ambrose, Pond and Wright2016). Here, we have extended these results to finite depth and linear shear.
For the single-valued solutions, we show that internal waves can be stabilized by the strength of the linear shear in each layer. While one can amplify the instabilities seen in figure 12, the modulational instabilities can be fully suppressed to machine precision if the differences in magnitudes of the depths of the stratified layers is large enough (see figure 13 for details). This extends the work in Pullin & Grimshaw (Reference Pullin and Grimshaw1986) where they focus on modulational instabilities on fluids of infinite depth and limit their investigates on HFI to that of
 $m=2$
resonant interaction. Here, we consider all resonant interactions that give rise to a growth rate with real part
 ${>}10^{-14}$
. We show that in finite depth, the combination of shears in each layer that gives rise to modulational instability varies significantly from the infinite-depth scenario (Pullin & Grimshaw Reference Pullin and Grimshaw1986). The region of stability for the finite-depth case presented in figure 14 contains a significantly larger portion fourth quadrant of the
 $(\unicode[STIX]{x1D714}_{1},\unicode[STIX]{x1D714}_{2})$
plane as well as regions of the first and third quadrant. For infinite depth, this stability region is shown to be much smaller, and limited to the fourth quadrant only (Pullin & Grimshaw Reference Pullin and Grimshaw1986).
This ability of shear to both amplify and suppress modulational stability in bistratified fluids generalizes the phenomena seen for the single-layer fluid where modulational instabilities are suppressed provided that the strength of the vorticity exceeds a critical threshold (see Thomas et al. Reference Thomas, Kharif and Manna2012; Oliveras et al. Reference Oliveras, Sprenger and Vasan2016).
We also see that the modulational instability is not necessarily the dominant instability when present. Indeed, for small-amplitude waves, the growth rate of the HFI may be the same as those of the MI such as what is shown in figure 11. Furthermore, the dominant instabilities corresponding to resonant interactions can either increase (see figure 16), decrease (see figure 15), or remain stationary (see figure 11) in Floquet parameter as the amplitude of the underlying travelling wave solution increases or decreases depending on the order of the resonant interaction as well as the parameters involved.
Acknowledgements
This work was completed at the Institute for Computational and Experimental Research in Mathematics (ICERM) in Providence, RI. Both K.L.O. and C.W.C. gratefully acknowledge the support of ICERM and their computing facilities. K.L.O. also acknowledges the support of the National Science Foundation under grant number DMS-1313049 and DMS-1715082. C.W.C. acknowledges support of the National Science Foundation under grant number DMS-1715039. Any opinions, findings, and conclusions or recommendations expressed in this material are those of the authors and do not necessarily reflect the views of the National Science Foundation.
Appendix A. Stability formulation
For simplicity, we replace
 $x-ct$
with
 $x$
where the non-dimensional variables
 $\unicode[STIX]{x1D702}$
and
 $q_{j}$
(
 $j=1,2$
) are periodic in the new variable
 $x$
with period
 $2\unicode[STIX]{x03C0}$
. Substituting the expansions for
 $\unicode[STIX]{x1D702}$
,
 $q_{1}$
and
 $q_{2}$
into (2.22), we find at
 $O(\unicode[STIX]{x1D700})$
 $$\begin{eqnarray}\displaystyle & & \displaystyle V\unicode[STIX]{x1D702}_{1}(x)-T_{1}\unicode[STIX]{x2202}_{x}\unicode[STIX]{x1D6FC}_{1}(x)+T_{2}\unicode[STIX]{x2202}_{x}\unicode[STIX]{x1D6FD}_{1}(x)\nonumber\\ \displaystyle & & \displaystyle \quad =\unicode[STIX]{x1D706}((-\tilde{\unicode[STIX]{x1D714}}\unicode[STIX]{x2202}_{x}^{-1}-(T_{1}-T_{2})(\unicode[STIX]{x2202}_{x}\unicode[STIX]{x1D702}_{0}))\unicode[STIX]{x1D702}_{1}(x)+\unicode[STIX]{x1D6FC}_{1}(x)-\unicode[STIX]{x1D70C}\unicode[STIX]{x1D6FD}_{1}(x)),\end{eqnarray}$$
where
 $$\begin{eqnarray}\left.\begin{array}{@{}c@{}}\displaystyle V=\left((\unicode[STIX]{x1D70C}-1)+\unicode[STIX]{x1D714}_{1}T_{1}-\unicode[STIX]{x1D714}_{2}T_{2}+\unicode[STIX]{x1D716}\unicode[STIX]{x1D707}^{2}\unicode[STIX]{x1D716}\unicode[STIX]{x1D707}^{2}(\unicode[STIX]{x2202}_{x}\unicode[STIX]{x1D702}_{0})\left(T_{1}^{2}-\frac{1}{\unicode[STIX]{x1D70C}}T_{2}^{2}\right)\unicode[STIX]{x2202}_{x}\right),\\ \displaystyle \tilde{\unicode[STIX]{x1D714}}=\unicode[STIX]{x1D714}_{1}-\unicode[STIX]{x1D70C}\unicode[STIX]{x1D714}_{2},\quad T_{1}=\frac{(\unicode[STIX]{x1D716}\unicode[STIX]{x1D6FC}_{0}(x)-\unicode[STIX]{x1D714}_{1}\unicode[STIX]{x1D716}\unicode[STIX]{x1D702}_{0}(x)-c)}{1+\unicode[STIX]{x1D716}^{2}\unicode[STIX]{x1D707}^{2}(\unicode[STIX]{x2202}_{x}\unicode[STIX]{x1D702}_{0})^{2}},\quad \text{and}\quad \\ \displaystyle T_{2}=\frac{\unicode[STIX]{x1D70C}(\unicode[STIX]{x1D716}\unicode[STIX]{x1D6FD}_{0}(x)-\unicode[STIX]{x1D714}_{2}\unicode[STIX]{x1D716}\unicode[STIX]{x1D702}_{0}(x)-c)}{1+\unicode[STIX]{x1D716}^{2}\unicode[STIX]{x1D707}^{2}(\unicode[STIX]{x2202}_{x}\unicode[STIX]{x1D702}_{0})^{2}}.\end{array}\right\}\end{eqnarray}$$
For the non-local equations given by (4.2), and (4.3), we find
 $$\begin{eqnarray}\displaystyle & & \displaystyle \unicode[STIX]{x1D706}\langle \text{e}^{-\text{i}kx}{\mathcal{C}}_{1,k}\unicode[STIX]{x1D702}_{1}(x)\rangle \nonumber\\ \displaystyle & & \displaystyle \quad =\langle \text{e}^{-\text{i}kx}(-\text{i}k{\mathcal{C}}_{1,k}(\unicode[STIX]{x1D716}(\unicode[STIX]{x2202}_{x}\unicode[STIX]{x1D6FC}_{0})-\unicode[STIX]{x1D714}_{1}\unicode[STIX]{x1D716}\unicode[STIX]{x1D702}_{0}-c)\unicode[STIX]{x1D702}_{1}(x))\rangle -\frac{\text{i}}{\unicode[STIX]{x1D707}}\langle \text{e}^{-\text{i}kx}({\mathcal{S}}_{1,k}\unicode[STIX]{x2202}_{x}\unicode[STIX]{x1D6FC}_{1}(x))\rangle ,\end{eqnarray}$$
 $$\begin{eqnarray}\displaystyle & & \displaystyle \unicode[STIX]{x1D706}\langle \text{e}^{-\text{i}kx}{\mathcal{C}}_{2,k}\unicode[STIX]{x1D702}_{1}(x)\rangle \nonumber\\ \displaystyle & & \displaystyle \quad =\langle \text{e}^{-\text{i}kx}(-\text{i}k{\mathcal{C}}_{2,k}(\unicode[STIX]{x1D716}(\unicode[STIX]{x2202}_{x}\unicode[STIX]{x1D6FD}_{0})-\unicode[STIX]{x1D714}_{2}\unicode[STIX]{x1D716}\unicode[STIX]{x1D702}_{0}(x)-c)\unicode[STIX]{x1D702}_{1}(x))\rangle -\frac{\text{i}}{\unicode[STIX]{x1D707}}\langle \text{e}^{-\text{i}kx}({\mathcal{S}}_{2,k}\unicode[STIX]{x2202}_{x}\unicode[STIX]{x1D6FD}_{1}(x))\rangle .\qquad\end{eqnarray}$$
Appendix B. Generalized matrix eigenvalue problem
Since
 $\bar{\unicode[STIX]{x1D6FC}}_{1}$
,
 $\bar{\unicode[STIX]{x1D6FD}}_{1}$
and
 $\bar{\unicode[STIX]{x1D702}}_{1}$
are 2
 $\unicode[STIX]{x03C0}$
periodic, we can represent the functions by their Fourier Series given by
 $$\begin{eqnarray}\bar{\unicode[STIX]{x1D6FC}}_{1}(x)=\mathop{\sum }_{n=-\infty }^{\infty }\text{e}^{\text{i}n\unicode[STIX]{x03C0}x}\hat{A}_{n},\quad \bar{\unicode[STIX]{x1D6FD}}_{1}(x)=\mathop{\sum }_{n=-\infty }^{\infty }\text{e}^{\text{i}n\unicode[STIX]{x03C0}x}\hat{B}_{n},\quad \bar{\unicode[STIX]{x1D702}}_{1}(x)=\mathop{\sum }_{n=-\infty }^{\infty }\text{e}^{\text{i}n\unicode[STIX]{x03C0}x}\hat{N}_{n}.\end{eqnarray}$$
Following the steps outlined in § 4, the resulting eigenvalue problem takes the for
 $$\begin{eqnarray}\left[\begin{array}{@{}ccc@{}}\displaystyle {\mathcal{L}}_{1,1} & \displaystyle {\mathcal{L}}_{1,2} & \displaystyle {\mathcal{L}}_{1,3}\\ \displaystyle {\mathcal{L}}_{2,1} & \displaystyle {\mathcal{L}}_{2,2} & \displaystyle 0\\ \displaystyle {\mathcal{L}}_{3,1} & \displaystyle 0 & \displaystyle {\mathcal{L}}_{3,3}\end{array}\right]X=\unicode[STIX]{x1D706}\left[\begin{array}{@{}ccc@{}}\displaystyle {\mathcal{R}}_{1,1} & \displaystyle {\mathcal{R}}_{1,2} & \displaystyle {\mathcal{R}}_{1,3}\\ \displaystyle {\mathcal{R}}_{2,1} & 0 & 0\\ \displaystyle {\mathcal{R}}_{3,1} & 0 & 0\end{array}\right]X,\end{eqnarray}$$
where
 $$\begin{eqnarray}\left.\begin{array}{@{}c@{}}\displaystyle {\mathcal{L}}_{1,1}=\left((\unicode[STIX]{x1D70C}-1)+\unicode[STIX]{x1D714}_{1}T_{1}-\unicode[STIX]{x1D714}_{2}T_{2}-\unicode[STIX]{x1D716}\unicode[STIX]{x1D707}(\unicode[STIX]{x2202}_{x}\unicode[STIX]{x1D702}_{0})\left(\frac{1}{\unicode[STIX]{x1D70C}}T_{2}^{2}-T_{1}^{2}\right)\unicode[STIX]{x2202}_{x}\right),\quad {\mathcal{L}}_{1,2}=-T_{1}\unicode[STIX]{x2202}_{x},\\ \displaystyle {\mathcal{L}}_{1,3}=T_{2}\unicode[STIX]{x2202}_{x},\quad {\mathcal{L}}_{2,1}(k)=k(\unicode[STIX]{x1D716}(\unicode[STIX]{x2202}_{x}\unicode[STIX]{x1D6FC}_{0})-\unicode[STIX]{x1D716}\unicode[STIX]{x1D714}_{1}\unicode[STIX]{x1D702}_{0}(x)-c)\cosh (\unicode[STIX]{x1D707}k(\unicode[STIX]{x1D716}\unicode[STIX]{x1D702}_{0}-1)),\\ \displaystyle {\mathcal{L}}_{2,2}(k)=\frac{1}{\unicode[STIX]{x1D707}}\sinh (\unicode[STIX]{x1D707}k(\unicode[STIX]{x1D716}\unicode[STIX]{x1D702}_{0}-1))\unicode[STIX]{x2202}_{x},\\ \displaystyle {\mathcal{L}}_{3,1}(k)=k(\unicode[STIX]{x1D716}(\unicode[STIX]{x2202}_{x}\unicode[STIX]{x1D6FD}_{0})-\unicode[STIX]{x1D716}\unicode[STIX]{x1D714}_{2}\unicode[STIX]{x1D702}_{0}(x)-c)\cosh (\unicode[STIX]{x1D707}k(\unicode[STIX]{x1D716}\unicode[STIX]{x1D702}_{0}+\unicode[STIX]{x1D6FF})),\\ \displaystyle {\mathcal{L}}_{3,3}(k)=\frac{1}{\unicode[STIX]{x1D707}}\sinh (\unicode[STIX]{x1D707}k(\unicode[STIX]{x1D716}\unicode[STIX]{x1D702}_{0}+\unicode[STIX]{x1D6FF}))\unicode[STIX]{x2202}_{x},\end{array}\right\}\end{eqnarray}$$
and
 $$\begin{eqnarray}\left.\begin{array}{@{}c@{}}\displaystyle {\mathcal{R}}_{1,1}=\tilde{\unicode[STIX]{x1D714}}\unicode[STIX]{x2202}_{x}^{-1}+(T_{1}-T_{2})(\unicode[STIX]{x2202}_{x}\unicode[STIX]{x1D702}_{0}),\quad {\mathcal{R}}_{1,2}=1,\quad {\mathcal{R}}_{1,3}=-\unicode[STIX]{x1D70C},\\ \displaystyle {\mathcal{R}}_{2,1}(k)=\text{i}\cosh (\unicode[STIX]{x1D707}k(\unicode[STIX]{x1D716}\unicode[STIX]{x1D702}_{0}-1)),\quad {\mathcal{R}}_{3,1}(k)=\text{i}\cosh (\unicode[STIX]{x1D707}k(\unicode[STIX]{x1D716}\unicode[STIX]{x1D702}_{0}+\unicode[STIX]{x1D6FF})),\end{array}\right\}\end{eqnarray}$$
where
 $k=p+\ell ,$
for
 $\ell \in \mathbb{Z}$
, and
 $X=\text{e}^{\text{i}\unicode[STIX]{x1D707}x}[\bar{\unicode[STIX]{x1D702}}_{1}\;\bar{\unicode[STIX]{x1D6FC}}_{1}\;\bar{\unicode[STIX]{x1D6FD}}_{1}]^{T}$
.
Instead of directly solving the eigenvalue problem as stated above, a more stable approach is to calculate the eigenvalues is to reformulate the problem as a quadratic eigenvalue problem. Noting that both
 ${\mathcal{L}}_{2,2}$
and
 ${\mathcal{L}}_{3,3}$
are invertible (see Craig et al.
Reference Craig, Guyenne, Nicholls and Sulem2005b
), we can formally replace both
 $\bar{\unicode[STIX]{x1D6FC}}_{1}$
and
 $\bar{\unicode[STIX]{x1D6FD}}_{1}$
with the expressions
 $$\begin{eqnarray}\bar{\unicode[STIX]{x1D6FC}}_{1}={\mathcal{L}}_{2,2}^{-1}(\unicode[STIX]{x1D706}{\mathcal{R}}_{2,1}-{\mathcal{L}}_{2,1})\bar{\unicode[STIX]{x1D702}}_{1},\quad \bar{\unicode[STIX]{x1D6FD}}_{1}={\mathcal{L}}_{3,3}^{-1}(\unicode[STIX]{x1D706}{\mathcal{R}}_{3,1}-{\mathcal{L}}_{3,1})\bar{\unicode[STIX]{x1D702}}_{1}.\end{eqnarray}$$
Using these expressions in the
 $3\times 3$
eigenvalue problem above, we can reduce the system to a quadratic eigenvalue problem of the form
 $$\begin{eqnarray}(\unicode[STIX]{x1D706}^{2}{\mathcal{A}}_{2}+\unicode[STIX]{x1D706}{\mathcal{A}}_{1}+{\mathcal{A}}_{0})\bar{\unicode[STIX]{x1D702}}_{1}=0,\end{eqnarray}$$
where the expressions for the operators
 ${\mathcal{A}}_{j}$
are given by
 $$\begin{eqnarray}\displaystyle & \displaystyle {\mathcal{A}}_{0}={\mathcal{L}}_{1,1}-{\mathcal{L}}_{1,2}{\mathcal{L}}_{2,2}^{-1}{\mathcal{L}}_{2,1}-{\mathcal{L}}_{1,3}{\mathcal{L}}_{3,3}^{-1}{\mathcal{L}}_{3,1}, & \displaystyle\end{eqnarray}$$
 $$\begin{eqnarray}\displaystyle & \displaystyle {\mathcal{A}}_{1}=-{\mathcal{R}}_{1,1}+{\mathcal{R}}_{1,2}{\mathcal{L}}_{2,2}^{-1}{\mathcal{L}}_{2,1}+{\mathcal{L}}_{1,2}{\mathcal{L}}_{2,2}{\mathcal{R}}_{2,1}+{\mathcal{L}}_{1,2}{\mathcal{L}}_{3,3}^{-1}{\mathcal{R}}_{3,1}+{\mathcal{R}}_{1,3}{\mathcal{L}}_{3,3}^{-1}{\mathcal{L}}_{3,1}, & \displaystyle\end{eqnarray}$$
 $$\begin{eqnarray}\displaystyle & \displaystyle {\mathcal{A}}_{2}=-{\mathcal{R}}_{1,2}{\mathcal{L}}_{2,2}^{-1}{\mathcal{R}}_{2,1}-{\mathcal{R}}_{1,3}{\mathcal{L}}_{3,3}^{-1}{\mathcal{R}}_{3,1}. & \displaystyle\end{eqnarray}$$
Appendix C. Variational structure and resonant interactions
Following the now established variational procedure first outlined in Luke (Reference Luke1967), we can readily verify that a Lagrangian for our two-layer fluid system with shear is given in dimensional units by
 $$\begin{eqnarray}\displaystyle {\mathcal{L}} & = & \displaystyle -\unicode[STIX]{x1D70C}_{1}\int _{0}^{2\unicode[STIX]{x03C0}L}\int _{\unicode[STIX]{x1D702}}^{h_{1}}\left(\unicode[STIX]{x2202}_{t}\unicode[STIX]{x1D711}_{1}+\frac{1}{2}|\boldsymbol{u}_{1}|^{2}+gz\right)\,\text{d}z\,\text{d}x+\frac{\unicode[STIX]{x1D714}_{1}\unicode[STIX]{x1D70C}_{1}}{2}\int _{0}^{2\unicode[STIX]{x03C0}L}\unicode[STIX]{x1D702}\unicode[STIX]{x2202}_{x}^{-1}\unicode[STIX]{x1D702}_{t}\,\text{d}x\nonumber\\ \displaystyle & & \displaystyle -\unicode[STIX]{x1D70C}_{2}\int _{0}^{2\unicode[STIX]{x03C0}L}\int _{-h_{2}}^{\unicode[STIX]{x1D702}}\left(\unicode[STIX]{x2202}_{t}\unicode[STIX]{x1D711}_{2}+\frac{1}{2}|\boldsymbol{u}_{2}|^{2}+gz\right)\,\text{d}z\,\text{d}x-\frac{\unicode[STIX]{x1D714}_{2}\unicode[STIX]{x1D70C}_{2}}{2}\int _{0}^{2\unicode[STIX]{x03C0}L}\unicode[STIX]{x1D702}\unicode[STIX]{x2202}_{x}^{-1}\unicode[STIX]{x1D702}_{t}\,\text{d}x.\end{eqnarray}$$
Passing to surface variables, this becomes
 $$\begin{eqnarray}\displaystyle {\mathcal{L}} & = & \displaystyle \unicode[STIX]{x1D70C}_{1}\int _{0}^{2\unicode[STIX]{x03C0}L}\left(-q_{1}\unicode[STIX]{x2202}_{t}\unicode[STIX]{x1D702}+\frac{1}{2}q_{1}G_{u}(\unicode[STIX]{x1D702})q_{1}+\frac{g}{2}\unicode[STIX]{x1D702}^{2}+\frac{\unicode[STIX]{x1D714}_{1}^{2}}{6}\unicode[STIX]{x1D702}^{3}-\unicode[STIX]{x1D714}_{1}q_{1}\unicode[STIX]{x1D702}\unicode[STIX]{x2202}_{x}\unicode[STIX]{x1D702}+\frac{\unicode[STIX]{x1D714}_{1}}{2}\unicode[STIX]{x1D702}\unicode[STIX]{x2202}_{x}^{-1}\unicode[STIX]{x2202}_{t}\unicode[STIX]{x1D702}\right)\,\text{d}x\nonumber\\ \displaystyle & & \displaystyle +\,\unicode[STIX]{x1D70C}_{2}\int _{0}^{2\unicode[STIX]{x03C0}L}\left(q_{2}\unicode[STIX]{x2202}_{t}\unicode[STIX]{x1D702}-\frac{1}{2}q_{2}G_{l}(\unicode[STIX]{x1D702})q_{2}-\frac{g}{2}\unicode[STIX]{x1D702}^{2}-\frac{\unicode[STIX]{x1D714}_{2}^{2}}{6}\unicode[STIX]{x1D702}^{3}+\unicode[STIX]{x1D714}_{2}q_{2}\unicode[STIX]{x1D702}\unicode[STIX]{x2202}_{x}\unicode[STIX]{x1D702}-\frac{\unicode[STIX]{x1D714}_{2}}{2}\unicode[STIX]{x1D702}\unicode[STIX]{x2202}_{x}^{-1}\unicode[STIX]{x2202}_{t}\unicode[STIX]{x1D702}\right)\,\text{d}x.\nonumber\\ \displaystyle & & \displaystyle\end{eqnarray}$$
Collecting those terms which depend on time then gives us
 $$\begin{eqnarray}{\mathcal{L}}=\int _{0}^{2\unicode[STIX]{x03C0}L}p\unicode[STIX]{x2202}_{t}\unicode[STIX]{x1D702}\,\text{d}x-H(\unicode[STIX]{x1D702},p),\end{eqnarray}$$
where
 $$\begin{eqnarray}p=\unicode[STIX]{x1D70C}_{2}q_{2}-\unicode[STIX]{x1D70C}_{1}q_{1}-{\textstyle \frac{1}{2}}(\unicode[STIX]{x1D70C}_{2}\unicode[STIX]{x1D714}_{2}-\unicode[STIX]{x1D70C}_{1}\unicode[STIX]{x1D714}_{1})\unicode[STIX]{x2202}_{x}^{-1}\unicode[STIX]{x1D702}\end{eqnarray}$$
and the Hamiltonian
 $H$
is given by
 $$\begin{eqnarray}\displaystyle H & = & \displaystyle \int _{0}^{2\unicode[STIX]{x03C0}L}\,\text{d}x\left(\unicode[STIX]{x1D70C}_{2}\left(\frac{1}{2}q_{2}G_{l}(\unicode[STIX]{x1D702})q_{2}+\frac{g}{2}\unicode[STIX]{x1D702}^{2}+\frac{\unicode[STIX]{x1D714}_{2}^{2}}{6}\unicode[STIX]{x1D702}^{3}-\unicode[STIX]{x1D714}_{2}\unicode[STIX]{x1D702}\unicode[STIX]{x1D702}_{x}q_{2}\right)\right.\nonumber\\ \displaystyle & & \displaystyle -\left.\unicode[STIX]{x1D70C}_{1}\left(\frac{1}{2}q_{1}G_{u}(\unicode[STIX]{x1D702})q_{1}+\frac{g}{2}\unicode[STIX]{x1D702}^{2}+\frac{\unicode[STIX]{x1D714}_{1}^{2}}{6}\unicode[STIX]{x1D702}^{3}-\unicode[STIX]{x1D714}_{1}\unicode[STIX]{x1D702}\unicode[STIX]{x1D702}_{x}q_{1}\right)\right),\end{eqnarray}$$
where we have introduced the Dirichlet-to-Neumann operators (DNOs)
 $G_{u}(\unicode[STIX]{x1D702})$
and
 $G_{l}(\unicode[STIX]{x1D702})$
where
 $$\begin{eqnarray}G_{u}(\unicode[STIX]{x1D702})=-\unicode[STIX]{x2202}_{x}\unicode[STIX]{x1D702}\unicode[STIX]{x2202}_{x}\unicode[STIX]{x1D719}_{1}+\unicode[STIX]{x2202}_{z}\unicode[STIX]{x1D719}_{1},\quad G_{l}(\unicode[STIX]{x1D702})=-\unicode[STIX]{x2202}_{x}\unicode[STIX]{x1D702}\unicode[STIX]{x2202}_{x}\unicode[STIX]{x1D719}_{2}+\unicode[STIX]{x2202}_{z}\unicode[STIX]{x1D719}_{2},\end{eqnarray}$$
so that the kinematic conditions at the boundary are given by
 $$\begin{eqnarray}\unicode[STIX]{x2202}_{t}\unicode[STIX]{x1D702}=G_{u}(\unicode[STIX]{x1D702})+\unicode[STIX]{x1D714}_{1}\unicode[STIX]{x1D702}\unicode[STIX]{x2202}_{x}\unicode[STIX]{x1D702},\quad \unicode[STIX]{x2202}_{t}\unicode[STIX]{x1D702}=G_{l}(\unicode[STIX]{x1D702})+\unicode[STIX]{x1D714}_{2}\unicode[STIX]{x1D702}\unicode[STIX]{x2202}_{x}\unicode[STIX]{x1D702}.\end{eqnarray}$$
This of course is still not in terms of canonical variables alone. Following the methodology in Craig, Guyenne & Kalisch (Reference Craig, Guyenne and Kalisch2005a ), using the kinematic conditions across the boundary, we have that
 $$\begin{eqnarray}G_{l}(\unicode[STIX]{x1D702})q_{2}-\unicode[STIX]{x1D714}_{2}\unicode[STIX]{x1D702}\unicode[STIX]{x2202}_{x}\unicode[STIX]{x1D702}=G_{u}(\unicode[STIX]{x1D702})q_{1}-\unicode[STIX]{x1D714}_{1}\unicode[STIX]{x1D702}\unicode[STIX]{x2202}_{x}\unicode[STIX]{x1D702}.\end{eqnarray}$$
This then leads to the transformations
 $$\begin{eqnarray}q_{1}=\tilde{G}_{11}(\unicode[STIX]{x1D702})\left(p+\frac{1}{2}(\unicode[STIX]{x1D70C}_{2}\unicode[STIX]{x1D714}_{2}-\unicode[STIX]{x1D70C}_{1}\unicode[STIX]{x1D714}_{1})\unicode[STIX]{x2202}_{x}^{-1}\unicode[STIX]{x1D702}\right)-(\unicode[STIX]{x1D714}_{2}-\unicode[STIX]{x1D714}_{1})\tilde{G}_{12}(\unicode[STIX]{x1D702})\left(\frac{\unicode[STIX]{x1D702}^{2}}{2}\right),\end{eqnarray}$$
and
 $$\begin{eqnarray}q_{2}=\tilde{G}_{21}(\unicode[STIX]{x1D702})\left(p+\frac{1}{2}(\unicode[STIX]{x1D70C}_{2}\unicode[STIX]{x1D714}_{2}-\unicode[STIX]{x1D70C}_{1}\unicode[STIX]{x1D714}_{1})\unicode[STIX]{x2202}_{x}^{-1}\unicode[STIX]{x1D702}\right)+(\unicode[STIX]{x1D714}_{2}-\unicode[STIX]{x1D714}_{1})\tilde{G}_{22}(\unicode[STIX]{x1D702})\left(\frac{\unicode[STIX]{x1D702}^{2}}{2}\right),\end{eqnarray}$$
where
 $$\begin{eqnarray}\left.\begin{array}{@{}c@{}}\displaystyle \tilde{G}_{11}(\unicode[STIX]{x1D702})=(\unicode[STIX]{x1D70C}_{2}G_{l}^{-1}(\unicode[STIX]{x1D702})G_{u}(\unicode[STIX]{x1D702})-\unicode[STIX]{x1D70C}_{1})^{-1},\\ \displaystyle \tilde{G}_{12}(\unicode[STIX]{x1D702})=\tilde{G}_{11}(\unicode[STIX]{x1D702})G_{l}^{-1}(\unicode[STIX]{x1D702})\unicode[STIX]{x2202}_{x},\\ \displaystyle \tilde{G}_{21}(\unicode[STIX]{x1D702})=G_{l}^{-1}(\unicode[STIX]{x1D702})G_{u}(\unicode[STIX]{x1D702})\tilde{G}_{11}(\unicode[STIX]{x1D702}),\\ \displaystyle \tilde{G}_{22}(\unicode[STIX]{x1D702})=G_{l}^{-1}(\unicode[STIX]{x1D702})(1-G_{u}(\unicode[STIX]{x1D702})\tilde{G}_{11}(\unicode[STIX]{x1D702})G_{l}^{-1}(\unicode[STIX]{x1D702}))\unicode[STIX]{x2202}_{x}.\end{array}\right\}\end{eqnarray}$$
Using the non-local formulation, we can readily find the symbol associated with the linear part of the second variation of the Hamiltonian. We readily find that the leading-order terms of
 $G_{u}$
and
 $G_{l}$
are given by
 $$\begin{eqnarray}G_{u0}=-k\tanh (kh_{1}),\quad G_{l0}=k\tanh (kh_{2}).\end{eqnarray}$$
This then readily allows us to find the leading-order symbols of every other operator defined thus far, and therefore we can ultimately find the spectrum associated with the operator
 $$\begin{eqnarray}\unicode[STIX]{x1D6FF}^{2}H=\left(\begin{array}{@{}cc@{}}\displaystyle g(\unicode[STIX]{x1D70C}_{2}-\unicode[STIX]{x1D70C}_{1})-\frac{\tilde{\unicode[STIX]{x1D714}}^{2}}{4}H_{11} & \displaystyle \frac{\tilde{\unicode[STIX]{x1D714}}}{2}H_{21}^{\dagger }\\ \displaystyle \frac{\tilde{\unicode[STIX]{x1D714}}}{2}H_{21} & \displaystyle H_{22}\end{array}\right),\end{eqnarray}$$
where
 $$\begin{eqnarray}\left.\begin{array}{@{}c@{}}\displaystyle H_{11}=\unicode[STIX]{x2202}_{x}^{-1}(\unicode[STIX]{x1D70C}_{2}\tilde{G}_{210}G_{l0}\tilde{G}_{210}-\unicode[STIX]{x1D70C}_{1}\tilde{G}_{110}G_{u0}\tilde{G}_{110})\unicode[STIX]{x2202}_{x}^{-1},\\ \displaystyle H_{21}=(\unicode[STIX]{x1D70C}_{2}\tilde{G}_{210}G_{l0}\tilde{G}_{210}-\unicode[STIX]{x1D70C}_{1}\tilde{G}_{110}G_{u0}\tilde{G}_{110})\unicode[STIX]{x2202}_{x}^{-1},\\ \displaystyle H_{22}=\unicode[STIX]{x1D70C}_{2}\tilde{G}_{210}G_{l0}\tilde{G}_{210}-\unicode[STIX]{x1D70C}_{1}\tilde{G}_{110}G_{u0}\tilde{G}_{110},\end{array}\right\}\end{eqnarray}$$
and
 $$\begin{eqnarray}\tilde{\unicode[STIX]{x1D714}}=\unicode[STIX]{x1D70C}_{1}\unicode[STIX]{x1D714}_{1}-\unicode[STIX]{x1D70C}_{2}\unicode[STIX]{x1D714}_{2}.\end{eqnarray}$$
C.1 Linearization about the trivial interface
After non-dimensionalizing, if we linearize around a flat solution travelling with the bifurcating speed
 $c_{0}=\unicode[STIX]{x1D6FA}_{+}(k_{0})/k_{0}$
, we find that the corresponding linearized spectrum is given by
 $$\begin{eqnarray}\unicode[STIX]{x1D706}_{\pm }=\text{i}(ck+\unicode[STIX]{x1D6FA}_{\pm }(k)),\quad \unicode[STIX]{x1D6FA}_{\pm }(k)=\frac{1}{2}\left(-\tilde{\unicode[STIX]{x1D714}}{\mathcal{T}}_{k}\pm \text{sgn}(k)\sqrt{{\mathcal{T}}_{k}^{2}\tilde{\unicode[STIX]{x1D714}}^{2}+4(\unicode[STIX]{x1D70C}-1)k{\mathcal{T}}_{k}}\right),\end{eqnarray}$$
and
 $$\begin{eqnarray}{\mathcal{T}}_{k}=\frac{\tanh (\unicode[STIX]{x1D707}k)\tanh (\unicode[STIX]{x1D707}\unicode[STIX]{x1D6FF}k)}{\unicode[STIX]{x1D707}(\unicode[STIX]{x1D70C}\tanh (\unicode[STIX]{x1D707}k)+\tanh (\unicode[STIX]{x1D707}\unicode[STIX]{x1D6FF}k))},\end{eqnarray}$$
where we note that
 $\unicode[STIX]{x1D6FA}_{\pm }(-k)=-\unicode[STIX]{x1D6FA}_{\pm }(k)$
. The corresponding Krein signatures for the two branches of spectra are found to be
 $$\begin{eqnarray}\unicode[STIX]{x1D705}(\unicode[STIX]{x1D706}_{\pm })=\pm \text{sgn}(k)\text{sgn}\left(c_{0}-\frac{\unicode[STIX]{x1D6FA}_{\pm }}{k}\right).\end{eqnarray}$$
Similar formulas appear in Deconinck & Trichtchenko (Reference Deconinck and Trichtchenko2016). Following then the approach in resonant interaction theory Dias & Kharif (Reference Dias and Kharif1999), we likewise see that all potential non-zero amplitude instabilities must emanate from the ‘collision’ of two elements of the spectrum, say
 $$\begin{eqnarray}\unicode[STIX]{x1D706}_{\pm }(n_{1}+p)=\unicode[STIX]{x1D706}_{\pm }(n_{2}+p),\quad n_{j}\in \mathbb{Z},\end{eqnarray}$$
which is equivalent to the multi-wave mixing formula
 $$\begin{eqnarray}\displaystyle \unicode[STIX]{x1D6FA}_{\pm }(n_{1}+p)-\unicode[STIX]{x1D6FA}_{\pm }(n_{2}+p) & = & \displaystyle (n_{2}-n_{1})\frac{\unicode[STIX]{x1D6FA}_{+}(k_{0})}{k_{0}},\nonumber\\ \displaystyle & = & \displaystyle m\unicode[STIX]{x1D6FA}_{+}(k_{0}),\end{eqnarray}$$
where we have set
 $n_{2}-n_{1}=mk_{0}$
, or
 $$\begin{eqnarray}k_{2}-k_{1}=mk_{0},\quad k_{j}=n_{j}+p.\end{eqnarray}$$
Here we call
 $m$
the order of the resonant interaction, and we see that the
 $m$
th-order resonant interaction corresponds to a
 $m+2$
wave mixing problem.
(a) Order of resonance,
 $m$
, as a function of the Floquet parameter
 $p$
for
 $\unicode[STIX]{x1D714}_{1}=0$
,
 $\unicode[STIX]{x1D714}_{2}=0$
,
 $\unicode[STIX]{x1D707}=\sqrt{0.1}$
,
 $\unicode[STIX]{x1D6FF}=4$
and
 $\unicode[STIX]{x1D70C}=1.028$
. (b) Log plot of the values
 $n_{1}$
as a function of the order of resonance
 $m$
.

By setting
 $n_{2}=k_{1}+mk_{0}$
and then varying
 $m$
from
 $1$
to some chosen value, we can use numerical root finding to determine
 $k_{1}$
and thus
 $n_{1}+p$
given that
 $p\in [-1/2,1/2)$
. Using this then, we can track at which Floquet parameters
 $p$
we have resonances involving opposite Krein signature eigenvalue collisions. Taking
 $\unicode[STIX]{x1D714}_{1}=\unicode[STIX]{x1D714}_{2}=0$
,
 $\unicode[STIX]{x1D70C}=1.028$
,
 $\unicode[STIX]{x1D6FF}=4$
and
 $\unicode[STIX]{x1D707}=\sqrt{0.1}$
, we then get the plot in figure 19 for
 $1\leqslant m\leqslant 20$
. As we can see, there is no potentially unstable resonance until
 $m=5$
, after which several mechanisms for instability are present. We also note that
 $n_{1}$
is of the order of
 $40$
or so when
 $m=20$
.
In constrast, when we add vorticity by setting
 $\unicode[STIX]{x1D714}_{1}=-1$
and
 $\unicode[STIX]{x1D714}_{2}=1$
, thereby generating figure 20, while
 $m=2$
and
 $4$
become possible mechanisms for instability generation, the higher-order wave mixing corresponding to larger values of
 $m$
corresponds to markedly higher wavenumbers than in the zero-vorticity case. Thus, in some sense, the presence of vorticity stabilizes the problem by pushing instabilities out to far higher frequencies.
(a) Order of resonance,
 $m$
, as a function of the Floquet parameter
 $p$
for
 $\unicode[STIX]{x1D714}_{1}=-1$
,
 $\unicode[STIX]{x1D714}_{2}=1$
,
 $\unicode[STIX]{x1D707}=\sqrt{0.1}$
,
 $\unicode[STIX]{x1D6FF}=4$
and
 $\unicode[STIX]{x1D70C}=1.028$
. (b) Log plot of the values
 $n_{1}$
as a function of the order of resonance
 $m$
.