I. INTRODUCTION
In recent years, active antennas have become an area of growing interest because they can reduce size, weight, and cost of the transmitter and receiver systems [Reference Chang, York, Hall and Itoh1]. In an active antenna structure, a passive antenna is placed beside of the amplifier. If the antenna is to be used as a load to the amplifier, the antenna is a transmitter; and similarly, if it is used as an input to the amplifier, it will act as a receiver, respectively. The main considerations in the design of an active antenna include high gain and smooth frequency response in all its bandwidth, linear operation, small size, and low noise figure. Unfortunately, only a few papers have been published dealing with the active receiving microstrip antenna [Reference Duerr, Menzel and scurmacher2–Reference Li, Xing, Xu, Ding and Guo4]. In our research, we design and fabricate an active receiving microstrip antenna, for Radio Navigation and Radio Positioning applications, in which the antenna is a rectangular patch. This structure offers a number of parameters for the optimization, and by properly choosing all of these parameters, low noise receiving antenna can be designed, operating with a minimum of matching circuits between passive antenna and transistor, and therefore reducing losses and overall noise figure.
II. THE PASSIVE ANTENNA DESIGN
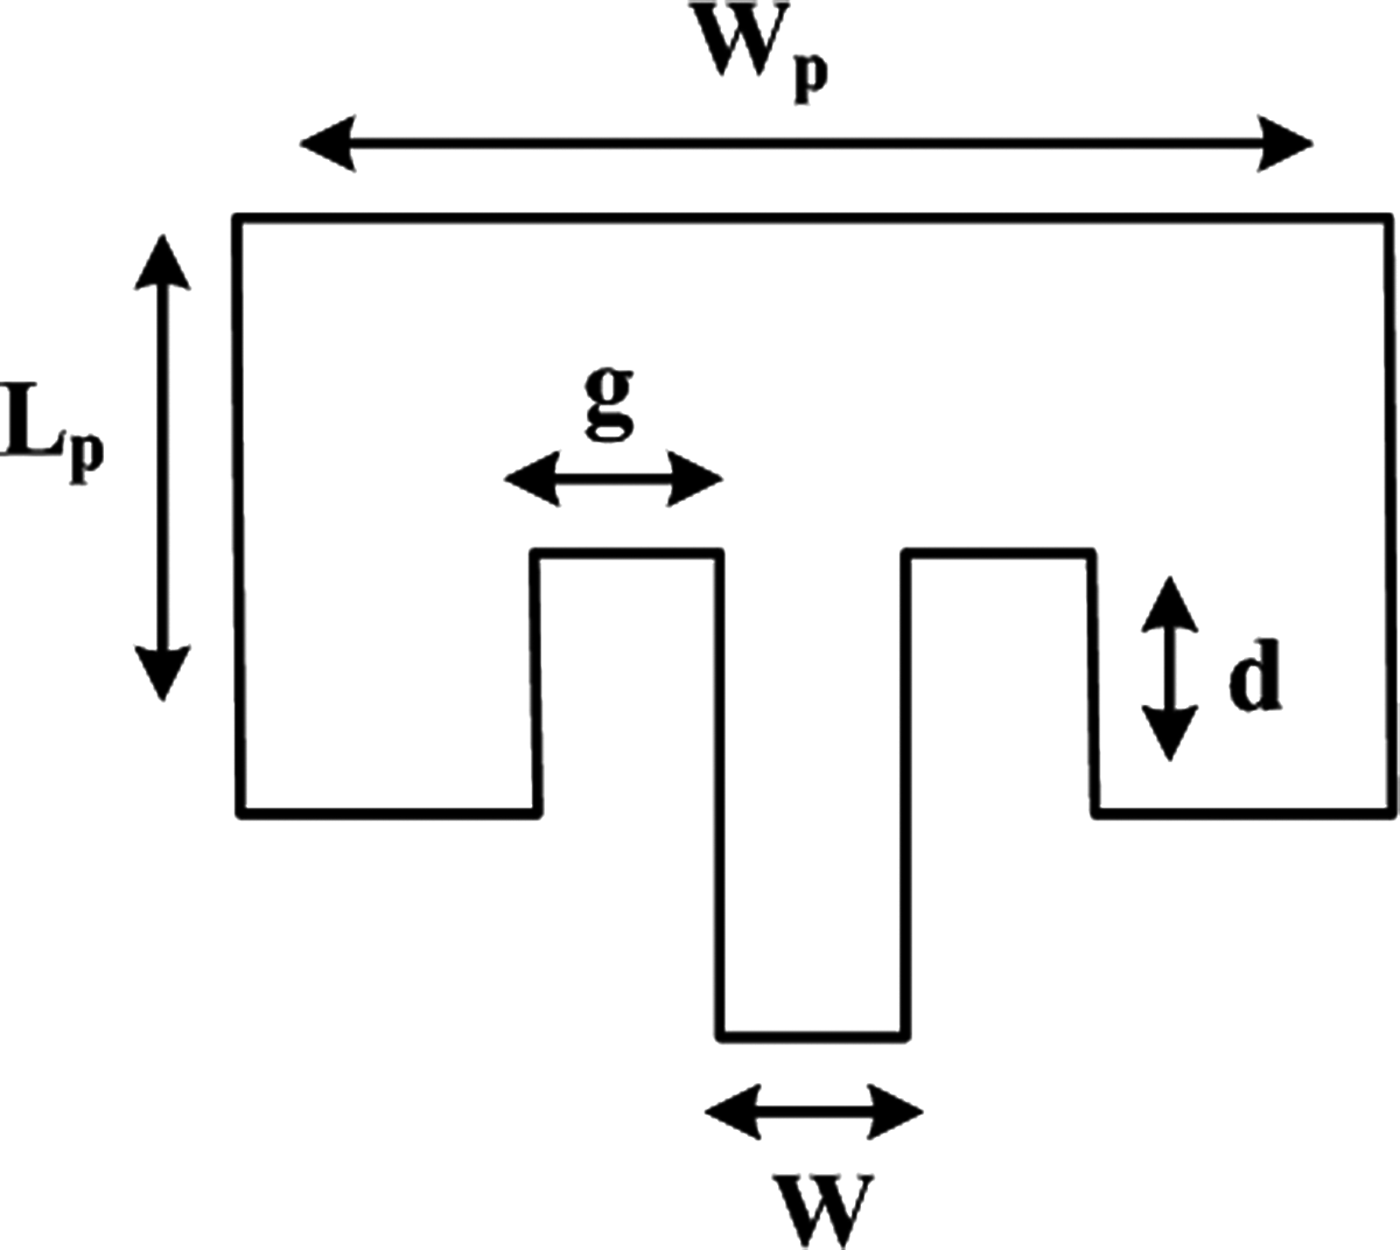
Among different planar antennas such as dipoles, microstrip patches, bowties, or slot antennas, which can be used as a radiator in an active antenna, we choose microstrip patch because of its low profile, easy fabrication, and analysis and its compatibility with solid-state devices. The rectangular microstrip patch antenna, which is used as the input of the amplifier, is designed at a fundamental resonant frequency of 3 GHz, using the relations extracted from [Reference Bhartia, Bahl, Garg and Ittipiboon5–Reference Matin and Sayeed8]. Also we select a center microstrip feed arrangement [Reference Abdipour, Moradi and Sarraf Shirazi9]. In order to obtain a well-matched broadband passive antenna, a matching network is designed at the input port of the patch antenna. Then the whole passive antenna is simulated and analyzed by momentum. The obtained input impedance will be considered as an input for the amplifier. The overall schematic of the designed patch antenna is shown in Fig. 1.
Geometry of the employed microstrip patch.

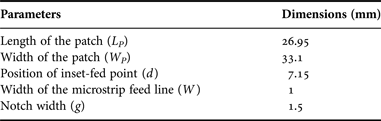
The used substrate is RO-4003 with relative permittivity of 3.38 and thickness of 20 mil. Basic parameters of this antenna include the length of patch (L p), the width of patch (W p), the notch width (g), the inset distance from the radiating edge (d), and width of feed line (w). Using classical formulas (1)–(10), we can calculate these parameters as shown in Table 1
The physical dimensions of microstrip patch antenna.
The width of the antennas can be determined by
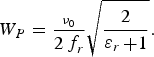 $$W_P=\displaystyle{{_{\mathop \nu \nolimits_0 } } \over {2\mathop f\nolimits_r }}\sqrt {\displaystyle{2 \over {\mathop \varepsilon \nolimits_r+1}}} .$$
The effective dielectric can be obtained by
 $$\eqalign{\mathop \varepsilon \nolimits_{reff}&=\displaystyle{{\mathop \varepsilon \nolimits_r+1} \over 2}+\displaystyle{{\mathop \varepsilon \nolimits_r - 1} \over 2}\mathop {\left[{1+12\displaystyle{h \over {\mathop W\nolimits_p }}} \right]}\nolimits^{ - 1/2}\comma \; \quad \cr & {\rm for}\quad W_p /h\gt 1.}$$
Normalized extension of the length, ΔL, is given by
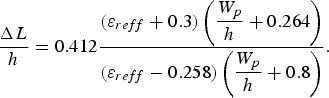 $$\displaystyle{{\Delta L} \over h}=0.412\displaystyle{{\lpar \varepsilon _{reff}+0.3\rpar \left({\displaystyle{{W_p } \over h}+0.264} \right)} \over {\lpar \varepsilon _{reff} - 0.258\rpar \left({\displaystyle{{W_p } \over h}+0.8} \right)}}.$$
The actual length of the patch, L p, can be expressed by
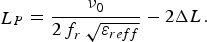 $$\mathop L\nolimits_P=\displaystyle{{\mathop \nu \nolimits_0 } \over {2\mathop f\nolimits_r \sqrt {\mathop \varepsilon \nolimits_{reff} } }} - 2\Delta L.$$
The notch width, g, can be obtained by using
 $$\mathop f\nolimits_r=\displaystyle{{\mathop \nu \nolimits_0 } \over {\sqrt {2 \times \mathop \varepsilon \nolimits_{reff} } }}\displaystyle{{4.6 \times \mathop {10}\nolimits^{ - 14} } \over g}+\displaystyle{f \over {1.01}}\comma$$
 $$g=\displaystyle{{\mathop \nu \nolimits_0 } \over {\sqrt {2 \times \mathop \varepsilon \nolimits_{reff} } }}\displaystyle{{4.65 \times \mathop {10}\nolimits^{ - 12} } \over f}.$$
We can calculate the value of Z 0 as
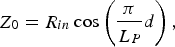 $$\mathop Z\nolimits_0=\mathop R\nolimits_{in} \cos \left({\displaystyle{\pi \over {\mathop L\nolimits_P }}d} \right)\comma$$
where d is the inset distance from the radiating edge, and R in is the resonant input resistance when the patch is fed at a radiating edge.
J 0, is the Bessel function of the first kind of order zero.
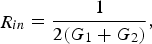
We can calculate R in as
 $$\mathop R\nolimits_{in}=\displaystyle{1 \over {2\lpar G_1+G_2 \rpar }}\comma$$
where G 1 is the conductance of a single slot and can be obtained by
 $$G_1=\displaystyle{1 \over {120\mathop \pi \nolimits^2 }}\int_0^\pi {\mathop {\left[{\displaystyle{{\sin \left({\displaystyle{{\mathop k\nolimits_0 \mathop W\nolimits_p } \over 2}\cos \theta } \right)} \over {\cos \theta }}} \right]}\nolimits^2 \mathop {\sin }\nolimits^3 \theta d\theta }$$
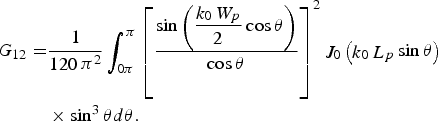
and, G 12, is the mutual conductance and can be calculated using
 $$\eqalign{G_{12}=&\displaystyle{1 \over {120\mathop \pi \nolimits^2 }}\int_{0\pi }^\pi {\mathop {\left[{\displaystyle{{\sin \left({\displaystyle{{\mathop k\nolimits_0 \mathop W\nolimits_p } \over 2}\cos \theta } \right)} \over {\cos \theta }}} \right]}\nolimits^2 } \mathop J\nolimits_0 \left({\mathop k\nolimits_0 \mathop L\nolimits_p \sin \theta } \right)\cr & \times \mathop {\sin }\nolimits^3 \theta d \theta.}$$
The simulation results of the designed patch are given in Fig. 2. As shown in this figure, the antenna has a good matching performance. The E- and H-plane patterns of the antenna are shown in Figs 2(c) and 2(d), which shows a wide beam pattern, which is desirable for many applications such as navigation systems.
The simulation results. (a) S 11 parameter of the passive antenna, (b) real part of the input impedance, (c) E-plane pattern of the passive antenna, (d) H-plane pattern of the passive antenna.
III. AMPLIFIER DESIGN
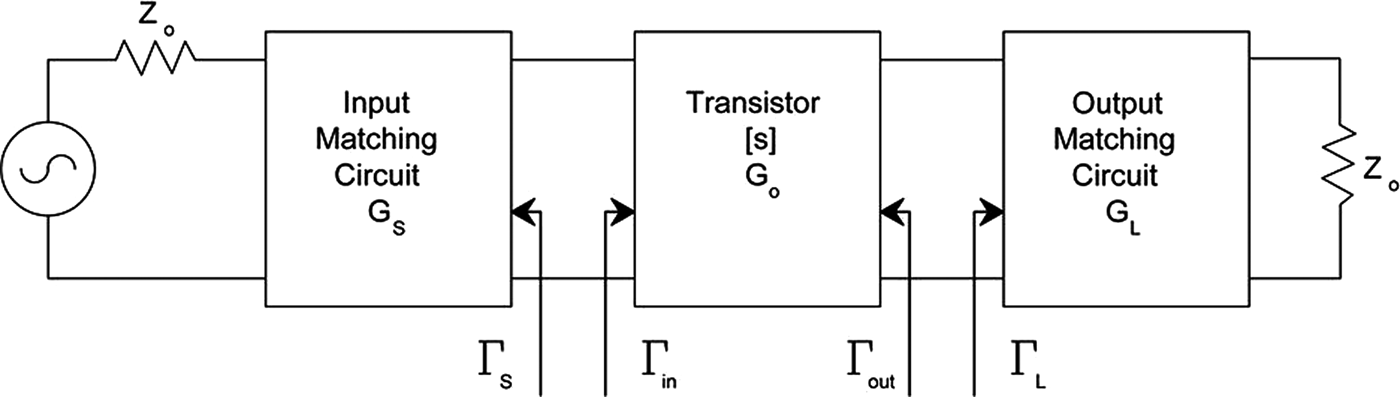
The next stage is the amplifier design. The low noise amplifier (LNA), as one of the most important blocks in a receiving system, governs receiving sensitivity of the entire system. The first stage is amplifier selection. Most of the radio frequency (RF) and microwave LNAs are designed in CMOS, BiCMOS, GaAs FET, and p-HEMT technologies, and are used in a variety of applications. The area of application is an essential factor in the amplifier section design of an active antenna. For example, for transmitter applications, the design goals are to achieve higher gain and more bandwidth. For receiving applications, having a good noise figure is a design goal. This is a criterion for transistor selection, so that for transmitter antenna, HBT transistors are preferred because of their high gain, whereas for reception application, HEMT transistors are good choices because of their low noise. The second stage designs an appropriate bias network. Bias point is selected depending on the application such as low-power consumption, low noise, linearity, etc. After that we should check the stability situation of the transistor. The stability of an amplifier is a very important consideration in the design and it can be determined from the S-parameters, the matching networks, and the terminations. In the circuit Fig. 3 oscillations are possible when either the input or the output presents a negative resistance. This occurs when |ΓIN| > 1 and |ΓOUT| > 1. The reason is that ΓIN and ΓOUT depend on the source- and load-matching networks, while, the stability of the amplifier depends on ΓS and ΓL as presented by the matching networks. Alternatively, it can be shown that the amplifier will be unconditionally stable if the following necessary and sufficient conditions are met.
 $$K=\displaystyle{{1+\mathop {\left\vert {\mathop S\nolimits_{11} } \right\vert }\nolimits^2 - \mathop {\left\vert {\mathop S\nolimits_{22} } \right\vert }\nolimits^2 - \mathop {\left\vert {\Delta S} \right\vert }\nolimits^2 } \over {2\left\vert {\mathop S\nolimits_{21} \mathop S\nolimits_{12} } \right\vert }}$$
and
 $$\left\vert \Delta \right\vert \lt 1.$$
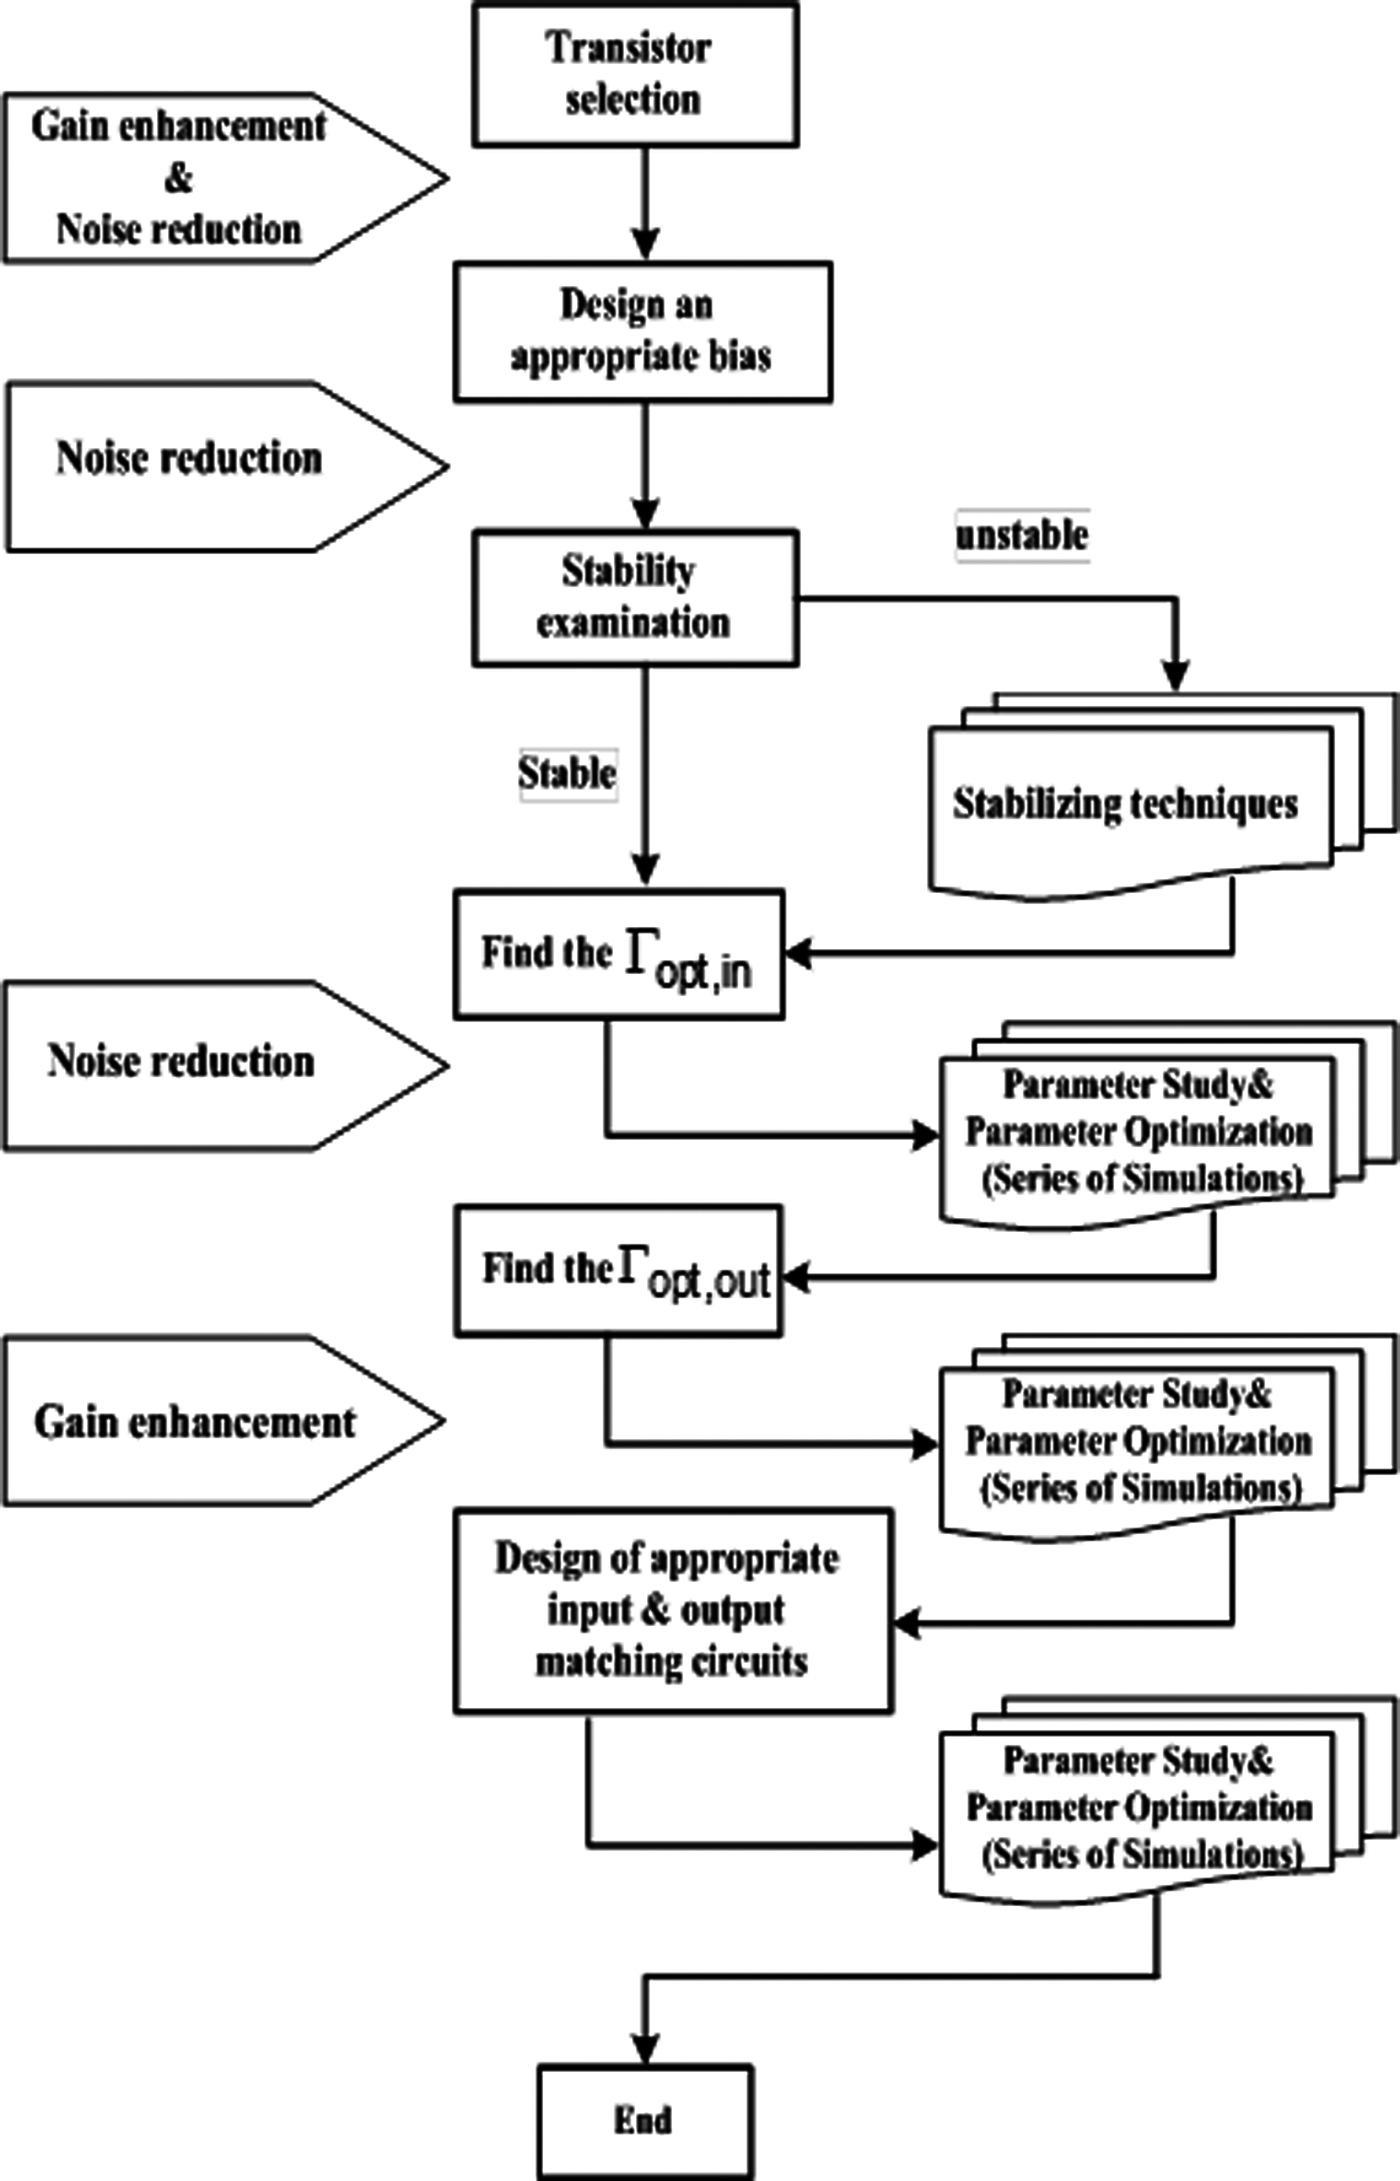
If transistor is unstable at the desired frequency, then proper techniques are applied to make it stable. After this stage, we must design the proper matching networks, and optimize them. Different techniques are applied to optimize different parameters, such as noise figure, gain, and power dissipation. Two parameters cannot be optimized simultaneously. Various stages of the amplifier design for the active antenna are shown in the flow diagram of Fig. 4. The active device in this circuit is ATF-34143, whose small signal-scattering parameters are extracted from its datasheet. The calculated stability factor shows that this transistor is unconditionally stable at the desired frequency band. This active antenna needs two matching network, which are designed using simultaneous conjugate match condition. Also we assume that the source and load impedances are equal to 50 Ω. Using the appropriate design of the active elements, the passive part interconnections, and overall circuit layout, the structure shown in Fig. 5 is achieved.
The general transistor amplifier circuit.
Amplifier design flow diagram.
Final layout of receiving active antenna.
IV. SIMULATION RESULTS AND DISCUSSION
The antenna simulation is performed by ADS simulator. Figures 6(a) and 6(b) display the simulated VSWR INVSWR OUT of the proposed active antenna, respectively. It is evident that the impedance matching is excellent in intermediate frequency. An active antenna gain >13 dB has been obtained across the bandwidth and is depicted in Fig. 6(c). The maximum gain of the proposed antenna is 14.5 dB at the frequency of 3.05 GHz by ADS simulator. Figure 6(d) shows the simulated noise figure of the antenna. It is seen that there is a very low noise performance near the fundamental resonant frequency of 3 GHz; so this antenna can support many wireless services especially Radio navigation and Radio positioning.
Results of active antenna simulation. (a) VSWR IN, (b) VSWR OUT, (c) S(2,1), (d) noise figure.
V. EXPERIMENTAL RESULTS
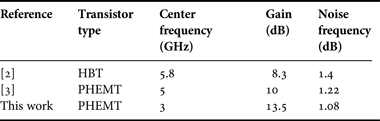
A prototype antenna was fabricated and measured using an Agilent_8722ES Vector Network Analyzer. Figure 7 shows the fabricated active antenna. Note that the bias circuit is designed and fabricated separately to reduce the total size of the active antenna and additive noise. The experimental results are shown in Fig. 8. Figures 8(a) and 8(b) show the measured return loss and gain of the fabricated active antenna, respectively. Also, Fig. 8(c) shows the measured noise figure. The noise performance of the antenna is excellent which ensures a good sensitivity of the overall circuit. As seen in these figures, the measured gain varies from 13.25 to 13.6 dB and the measured noise figure varies from 1.05 to 1.15 dB; so they are nearly stable. As shown in Figs 9(a) and 9(b) the measured radiation patterns of E- and H-planes have good agreement with the simulation results. The slight difference between simulation and experimental results are to some extend because of the calibration errors. Table 2 compares the characteristics of the proposed antenna to the other active receiving antennas. It is seen that our proposed antenna has higher gain and better noise performance compared with the other active receiving antennas.
The proposed antenna.
The experimental results. (a) The measured return loss, (b) the measured gain, (c) the measured noise figure of the active antenna active antenna.
Comparison between the simulation results with the experimental results. (a) The measured E-plane of the active antenna. (b) The measured H-plane of the active antenna.
A comparison between this work and similar works.
VI. CONCLUSION
In this paper, an active receiving microstrip patch antenna has been designed and fabricated for Radio navigation and Radio positioning applications. The implemented active antenna was investigated based on a comparison of the measured and simulated results. With the design proposed here, the transistor is operated near its noise minimum over the whole region of interest.
 Mahmoud Abdipour received a B.Sc. degree in Communication Engineering in 2008 and received his M.Sc. degree in Electronic Engineering in 2012. He now holds a research chair at the Polytecnico di Torino, Italy. He has co-authored several books, including Signals and Systems, Electrical Engineering Dictionary, Phased Array Antennas, and Digital Signal Processing. His main research interests are Analysis of Active Integrated Antennas, phased array antennas, and numerical methods in electromagnetic.
 Gholamreza Moradi received his Ph.D. degree in Electrical Engineering from Tehran Polytechnic University, Tehran, Iran in 2002. His main research interests are numerical Electromagnetics, antennas, active microwave circuits, mm-wave circuits and systems and microwave measurements. He has published several papers in the refereed journals and the local and international conferences. Also, he has co-authored five books (in Farsi), one of them entitled “Active Transmission Lines” was selected as the book of the year of Iran in 2008. He is currently an Associate Professor with the Electrical Engineering Department of Amirkabir University of Technology (Tehran Polytechnic), Tehran, Iran.
 Reza Sarraf Shirazi was born in Yazd, Iran, in 1959. He received his B.Sc., M.Sc., and Ph.D. all in Electrical Communication Engineering from Tehran PolytechnicUniversity, Tehran, Iran, respectively, in1980, 1993, and 2006. His main research interests are numerical electromagnetics, antennas, and wave propagations. He is currently an Associate Professor with Electrical Engineering Department at Amirkabir University of Technology (Tehran Polytechnic), Tehran, Iran.