

Background
Family benefit policy has followed rather different trajectories in Japan and the UK (Bradshaw and Tokoro, Reference Bradshaw and Tokoro2012). In the UK, family allowances were part of the Beveridge plan for social security and introduced in 1945 for the second and subsequent child. In the late 1970s, the existing child tax allowances and family allowances were combined and became universal child benefits paid for all children. Meanwhile, a means-tested child benefit for employed families had been introduced in 1972 (Family Income Supplement) and with changes in name over time – family credit, working families tax credit and child tax credit becoming universal credit in 2013 – it has become an important element in supporting families. But now, as part of the Coalition government's response to the financial crisis, child benefit has been frozen for three years from 2010, tax credits and other working age benefits are being increased by less than the rate of inflation and child benefit is being taken away from tax payers with earnings over £50,000 per year so that they are lost completely at £60,000.
The Japanese welfare system, which developed after the Second World War under the Liberal Democratic Party (LDP) government, can be characterised as residual, with work obligations and family responsibility stressed. Full-employment under the post-war rapid economic development, and a strong male-breadwinner model of the family, supported the public welfare system. Strong families and self-reliance were the preferences of the conservative LDP governments which ruled Japan from 1955, except for short periods in 1995–97.
Japanese politics drastically changed in the 2000s. First, neo-liberal groups within the LDP, led by Junichiro Koizumi, took office and implemented market-oriented social reforms to stimulate the slumping Japanese economy, and, as a result, they left a legacy of social division. After three short-lived LDP prime-minsters, the Japanese public turned to the centre-left Democratic Party of Japan (DPJ). In the 2009 general election, the DPJ promised many vote-winning policies without securing the financial resources to deliver them, which caused political stagnation. Also, the DPJ government failed to manage the economic crisis and the great earthquakes and nuclear power plant accidents in 2011. After being disillusioned by three DPJ prime ministers, the public turned back to the LDP in the December 2012 elections at which the party obtained a landslide victory over the DPJ. Shinzo Abe returned as Prime minister of a coalition government with the centre New Komeito Party.
Japanese politics is in serious crisis. Governments have changed so quickly, with eight prime ministers in ten years, and the result is that no long-term policy can be delivered. The two major political parties have played political games, blaming each other for the failure of Japanese politics. While there is some consensus on extending social support to families with children, in order to stop the fertility decline and to protect them against poverty, successive governments have failed to deliver firm policies in Japan.
Japan introduced child benefit (the Jido-Teate) in 1971 as a means-tested benefit, but eligibility was reduced during the 1980s. At the lowest point, it was only available for children under three years old. But fertility decline led to the expansion of child benefit after 2000. Even the conservative LDP government had agreed with the New Komeito Party, a junior partner in coalition government, on expanding the benefit. From 2009, child benefit was gradually improved. It became available for children under thirteen years old, and a higher benefit was given for children under three, although the LDP appeared to still be committed to selectivity.
In the 2009 general election, the then opposition DPJ promised a new universal child benefit, the Kodomo-teate, of 26,000 yen monthly for all children until they completed secondary school. After winning the election, the DPJ government introduced this new benefit at half the rate (13,000 yen per month per child) for 2010, for the first year, and the benefit should have been 26,000 yen from the second year. But the DPJ government failed to secure enough financial resources to fulfil its election promise and left the benefit at the same level. This decision invited strong criticisms from the opposition parties. The universal benefit became a symbol of irresponsibility and failure of the DPJ government. After the great earthquake and tsunami disaster in March 2011, the financial situation became even worse. In August 2011, the three major political parties made an agreement to bring back the old benefit system with an income test for those on higher incomes from 2012. Although the universal principle has gone, the resurrected system provides 5,000 yen per month for children who lost the benefit as a result of the income test. This was also a necessary measure to compensate for losing the old child tax allowance, although this is not enough. This means that under the LDP–New Komeito coalition government, all children still receive some types of cash benefit, at least for the time being (Tokoro, Reference Tokoro2012).
The focus or objectives of child benefits have been rather different in the two countries (Bradshaw and Tokoro, Reference Bradshaw and Tokoro2012). Family allowances in the UK were originally advocated as a means of tackling child poverty, introducing a degree of horizontal equity in the tax/benefit system and providing a source of income for mothers. Providing an incentive for fertility has never been on the agenda in the post-war period and the UK now has a fertility rate near replacement level (1.91 in 2011). In Japan, while child poverty has been a growing concern, the main rationale for developing child benefit has been a concern at the very low fertility rate since the late 1980s, which dropped to 1.26 in 2005. Although it gradually recovered to 1.39 in 2011, it is still one of the lowest amongst developed countries. This demographic trend has caused serious problems in the Japanese welfare system, notably in sustaining public pensions. It is also important to note that Japanese life expectancy is one of the highest in the world: 85.9 for women and 79.4 for men. Social care provision for older people has become an important issue in social policy since the 1990s.
In 2009, the UK spent 4.2 per cent of GDP on family benefits and services and tax breaks, the second highest amount in the OECD. At that time, Japan was only spending 1.48 per cent of GDP on family benefits and services and tax breaks and came 26th out of thirty-two countries (OECD Family data base Table PF1.1). Of course, this was before the increases introduced in 2010.
Methods
There are a variety of methods that can be employed to compare child benefit packages (Bradshaw, Reference Bradshaw, Kamerman, Phipps and Ben-Arieh2009). In this article, we use model family methods and bring together a number of studies that we have undertaken that enable us to compare child benefit packages in the two countries at four time points (1992, 2001, 2009, 2012) on a consistent basis. The 1992 data are derived from Bradshaw et al. (Reference Bradshaw, Ditch, Holmes and Whiteford1993), with the Japan data calculated retrospectively and added for this paper. The 2001 data are derived from Bradshaw and Finch (Reference Bradshaw and Finch2002), which included Japan with Tokoro as the national informant. The 2009 data are derived from data collected for Marx and Nelson (Reference Marx and Nelson2013) with Tokoro matching the methods for Japan. The UK 2012 data were collected for an update of the Antwerp Minimum Income project in progress, with Tokoro providing matching data for Japan.
The model family method is a way of comparing like with like. Standard families are set and then, using national rules, the taxes paid and benefit received at a given time are estimated for each family. In these comparisons, the following family types have been selected:
• Single (SG)
• Couple (CP)
• Lone parent plus one child aged two (requiring childcare) (LP+1)
• Lone parent plus two children aged seven and fourteen (LP+2)
• Couple plus two children aged seven and fourteen (CP+2)
Two cases are compared:
• A family with one earner in full- time work earning national average earnings.
• The same family, but with no employment income, and receiving the minimum social assistance income in each country.
The child benefit package includes universal and income-related cash benefits paid in respect of children, any child tax allowances or credits, local taxes where children are taken into account, the costs of full-time childcare and housing benefits.
The advantage of the model family method is that up-to-date comparisons of the structure and level of the packages can be made. The disadvantage is that the comparisons can only be illustrative rather than representative. The actual child benefit package can vary by the type and size of family, age of children, number of earners and earnings, tenure, size and location of housing, where the family lives and whether there are childcare costs, and not all of these factors are taken into account in the above assumptions.
Results
Child benefit packages
The level of the child benefit package is estimated for a lone parent by deducting the net income of a single adult from their net income and for a couple with children by deducting the net income of a childless couple from their net income. The difference is effectively what the state provides in respect of children.
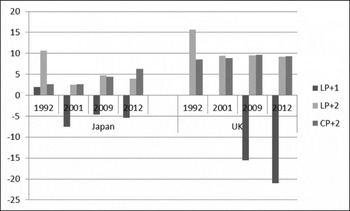
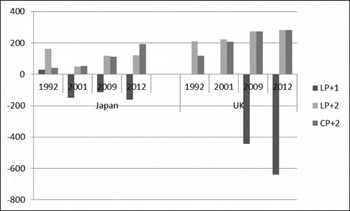
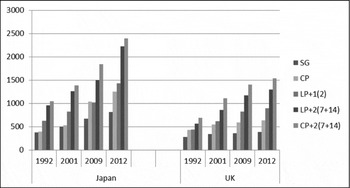
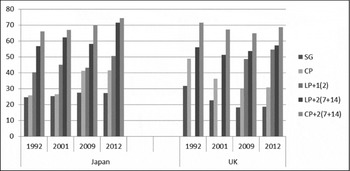
Figure 1 presents the child benefit package as a proportion of the net income of a single person and a couple for the three family types given above and in Figure 2 the package is presented in US$ purchasing power parities (there was no data collected for LP+1 for the UK in 1992 and 2001). The pattern in the two figures is very similar. In Japan in 1992, the income-tested child benefit was only available to children under three years old. By 2009, the benefit had become available for children aged seven and fourteen under the LDP-led coalition government. After the general election in 2009, the DPJ government introduced a new universal child benefit which removed the income test and increased the amount for all age groups. And, having faced political and economic difficulties, the DPJ government compromised with the opposition groups, and the old system is back in terms of the income test and targeting to younger age groups.
Child benefit package as a proportion of the net income of a single person and a couple one earner average earnings

Child benefit package in $ purchasing power parities one earner average earnings

In the UK, childcare tax credit is not payable at average earnings and the costs of childcare for the LP+1 more than cancels out the value of the child benefit package. In the UK in 1992, there was a lone parent premium in child benefit that was abandoned in 1997.
The level of the child benefit package is higher in the UK than in Japan, but it still adds less than 10 per cent to the income of a single parent or couple. In Japan, support for a lone parent was higher than for a couple in 1992, but that difference had fallen by 2012. For a CP+2, there has been some closing of the gap between the level of the package in Japan and the UK.
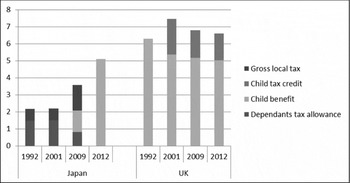
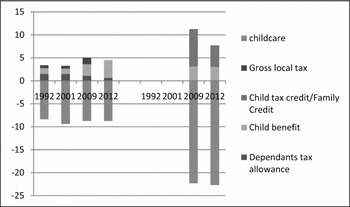
Figure 3 shows how the structure of the child benefit package has changed in both countries for a couple plus two children. Gross local tax is council tax in the UK and local taxes in Japan. Only in Japan does a couple with children pay more local tax than a childless couple. In Japan, children in elementary schools were not eligible for the child benefit until 2004. The expansion of the child benefit can be seen in 2009 and 2012. The tax exemption for children was abolished when universal benefit was introduced, and the total impact of the tax/benefit reform can be seen in the data for 2012.
The structure of the child benefit package as a percentage of gross average earnings (couple plus two children one earner average earnings)

In the UK in 1992, a family on average earnings would only have received the universal child benefit. By 2001, child tax credits had been introduced and the family element was payable at this income level. The level of the package is higher in the UK than it is in Japan.
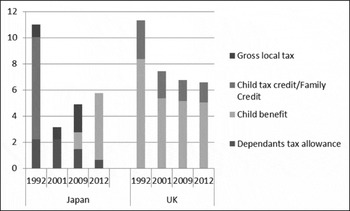
Figure 4 repeats the analysis for a lone parent with two children. In Japan, policy for lone parents has not expanded since the 1990s, in contrast to child benefit policy. An income-tested benefit for lone mother families has provided relatively generous financial support since the 1960s. But the successive reforms of the system since the late 1990s introduced stricter rules on the income-test as well as cuts in provision, which left many lone parents families outside of the provision. It is worth noting that current child benefit reform can be understood in the context of the fertility crisis, while little attention is paid to the issue of child poverty, which affects many lone parent families. Although financial support for families with children in general is improving, this is not enough for many lone parent families. It can be seen as a characteristic of Japanese family policy that there is a wide division between policies for fertility/aging issues and those for poverty issues.
The structure of the child benefit package as a percentage of gross average earnings. Lone parent plus two children average earnings

In the UK in 1992, there was a lone parent premium in child benefit and the lone parent family would also have been receiving some means-tested family credit. The lone parent premium was abolished in 1997, and by 2001 child tax credits had replaced family credit and a lone parent would have been entitled to the family element. This was not uprated consistently after that and has declined in value.
The child benefit package for a lone parent in Japan is much closer to the level in the UK than for couple families.
Figure 5 repeats the analysis, this time for a lone parent with one child requiring full-time childcare (there are no estimates for this case in 1992 and 2001 for the UK). Childcare is less expensive in Japan than in the UK, but in both countries it more than wipes out the value of state support provided for children. In Japan, childcare services are provided by the public and independent sectors in the form of nurseries under strict legal regulations which require the meeting of national standards in terms of facilities and childcare workers/professions. The social services department of the local authority has responsibility for administering childcare facilities in its areas, including contracts, subsidies and charges for services users. The charges for childcare services vary depending on the local authorities, but income-related charge scales are applied so that the childcare cost for families on low income is far less expensive. This public childcare system is especially important for lone mothers who participate in the labour market. On the other hand, those on above-average income are required to pay relatively high charges for childcare services, and this is particularly the case for dual breadwinner families with above-average incomes. It is also important to note that public childcare provision is often in short supply in some urban areas, despite the fertility decline and rapid service expansion by local authorities, because more mothers are seeking jobs. When the universal principle was introduced into child benefit, many argued that the financial resources should have been used for services rather than cash benefits.
The structure of the child benefit package as a percentage of gross average earnings. Lone parent plus one preschool child requiring childcare average earnings

The childcare system can be understood in its historical context, with the public welfare system being reserved for those with special needs. A strong male breadwinner model, which was a core of the Japanese residual welfare system, needed only a limited amount of provision for exceptional cases such as lone mother families. This is no longer the case. Policy makers have been exploring the alternatives, including childcare vouchers, in return for deregulation of the ‘social care market’ in order to bring private enterprises into childcare provision.
In the UK at this income level, a lone parent is not entitled to childcare tax credits and there are no other subsidies to help with the costs of childcare.
Social assistance
So far we have explored the child benefit package for families with employment income. In Figure 6, the minimum incomes (social assistance) payable to these family types is compared using US$ purchasing power parities. It is clearly evident that social assistance levels are and have been far more generous in Japan than in the UK and for all family types. The Japanese public assistance level has increased as the additional rate for children has increased in the last ten years. In the UK, there was a jump in the social assistance scales for children in 1999 with the introduction of child tax credits.
Social assistance (excluding housing benefits) per month in $ purchasing power parities

The generosity of the social assistance scales in Japan might indicate that the replacement rates of social assistance might be higher in Japan than in the UK. This is explored in Figure 7 where the notional replacement rates are estimated. The net income on social assistance is expressed as a proportion of the net income of the same family in employment. In fact, it turns out that the notional replacement rates are fairly similar, thanks to higher net average earnings in Japan. For all family types, the replacement rate of social assistance in Japan has increased over time. In the UK, replacement rates have tended to fall because social assistance has not been uprated in line with earnings. Generally, replacement rates are lower in the UK than Japan, except for LP+1(2) who have to pay childcare costs when in employment – although there is an income-related charging system in Japan and families on public assistance would be granted free childcare. The social assistance levels used in these calculations exclude housing costs and housing benefit and in both countries an amount would be added to social assistance to help with rent, which would not be available to earners. So the effective replacement rates would be higher than shown, at least for tenants.
Notional replacement rates of social assistance %

Conclusions
For Japan, it is still difficult to evaluate the impact of the debacle over the universal benefit and its political aftermath. The LDP and other political groups attacked the principle of universality as a waste of financial resources. It is not surprising that universal benefits are not welcome for those who believe in the residual welfare model. They have been successful in undermining the universal principle and in justifying a more targeted approach. But a different view can be taken too. Although the income test has been reintroduced and the amount is targeted, a long-term trend of child benefit expansion is also undeniable.
The current LDP-led coalition government has recently returned to office. Their first policy initiative was to cut the benefit rate of public assistance. As the Japanese economy is making a far from solid recovery, the number of benefits recipients reached 2 million, which is a record high since the 1940s. Successive governments have tried to promote welfare-to-work programmes. In this context, the current government has argued that the level of public assistance is too high, compared with the expenditure level of non-recipients, and this has caused poverty traps and benefit dependency. In the 2012 elections, the LDP proposed a 10 per cent cut in the benefit level, and they were backed by the electorate.
Although the government's proposal is yet to be brought to the Diet for debate, it is likely to pass as they have a large majority in the lower house. It has been pointed out that families with children in urban areas are going to be particularly hit by the cuts. In the worst case, a couple with two children or a lone parent might lose 20,000 yen per month. Some commentators have expressed concerns over the impact on child well-being in low income families (Mainichi Shinbun newspaper on 29 January 2013). It is becoming clear that the current government is not enthusiastic about expanding support for families with children. They call instead for a strong economy and family responsibility. Is this the same old story for Japan?
In the UK, we are waiting, with some trepidation, for the introduction of universal credit, which, if it works, will increase the incomes of some families with children and reduce child poverty. But meanwhile, with earnings falling, child benefits frozen and other benefits being increased by less than the rate of inflation, family living standards are falling. Other measures, in particular the introduction of the ‘bedroom tax’, which restricts housing benefit if there are any surplus bedrooms, the household benefit cap, the abolition of council tax benefit and the localisation of the Social Fund are all impacting on the poorest and most vulnerable families with children. The increase in personal tax allowances in the April 2013 budget will be of little benefit to low income workers with children with earnings below the tax threshold and it reduces the universal credit of those who do pay tax because universal credit is assessed on net income. Families with children have carried the main burden of the cuts, while pensioners’ benefits have been protected. There are a further £10 billion cuts to come in the next spending round after 2015.