Introduction
Flavonoids are secondary metabolites with C6–C3–C6 tricyclic chemical structures that are peculiar to plants (Petrussa et al., Reference Petrussa, Braidot, Zancani, Peresson, Bertolini, Patui and Vianello2013). Flavonoids are extensively distributed in plants, with more than 10,000 different members (Dixon and Pasinetti, Reference Dixon and Pasinetti2010), and seeds are one of the most important accumulation sites. Flavonoids in higher plants are primarily divided into seven subclasses [chalcones, flavones, flavonols, flavanones, proanthocyanidins (condensed tannins), anthocyanins and isoflavones] (Zhao, Reference Zhao2015), which have important biological functions in plants.
Chalcones do not only promote the symbiosis of plants and bacteria but also resist insect pests (Diaz-Tielas et al., Reference Diaz-Tielas, Grana, Reigosa and Sanchez-Moreiras2016). Flavones and flavanones also absorb ultraviolet irradiation and inhibit bacteria, while combining with metal ions to enhance plant colour (Koes et al., Reference Koes, Quattrocchio and Mol1994; Hostetler et al., Reference Hostetler, Ralston and Schwartz2017). Additionally, flavonols can regulate the accumulation and transport of auxin in plants (Kuhn et al., Reference Kuhn, Geisler, Bigler and Ringli2011).
Before seeds are fully matured, the innermost layer of the seed coat accumulates allelopathic substances called proanthocyanidins, which protect the embryo and endosperm (Lepiniec et al., Reference Lepiniec, Debeaujon, Routaboul, Baudry, Pourcel, Nesi and Caboche2006), and also serve to regulate seed size (Doughty et al., Reference Doughty, Aljabri and Scott2014). Anthocyanins comprise the final product of the flavonoid metabolic pathway and are natural antioxidants, which provide pigmentation for flowers, fruits and seeds, while attracting pollinators and seed disseminators (Ibrahim, Reference Ibrahim2005). Isoflavones mainly exist in legumes and have antifungal, antimicrobial and antioxidant functions (Messina, Reference Messina2010).
Flavonoids possess a number of valuable biologically active, nutritional and medicinal elements, which is another important reason why they have garnered intense research interest worldwide. Flavonoids can induce large borers in grain and play a role in the control of pests (Mbatchou et al., Reference Mbatchou, Ghafa and Khan2019). Leaves or stems containing flavonoids affect the oral muscle activities of herbivores and regulate their food intake (Sosa et al., Reference Sosa, Chaves, Alias, Escudero, Henao and Gutierrez-Merino2004). Flavonoids make up the colour and taste of most fruits, vegetables, nuts and seeds, which can be obtained from plant-based foods in daily life (Ibrahim, Reference Ibrahim2005).
Flavonoids are one of the main nutrients in edible flowers, and flower colour is related to their content. The content of total flavonoids in the full flowering stage is much higher than that in the early flowering stage, and its antioxidant activity also follows this rule (Mlcek et al., Reference Mlcek and Rop2011). The analysis of flavonoids in more than 70 common flowers showed that the content of total flavonoids was between 0.07 and 15.25 mg g−1 DW, among which quercitrin and hesperidin, quercetin and luteolin, kaempferol, hesperidin and apigenin were the most common components (Zheng et al., Reference Zheng, Meenu and Xu2019). Fruit is an important source of flavonoids. With the increase of pomegranate maturity, the content of total flavonoids in pomegranate increased from 97.06 mg CE/100 ml PJ to 335.62 mg CE/100 ml PJ, including catechin, epicatechin and naringin (Mphahlele et al., Reference Mphahlele, Stander, Fawole and Opara2014); the contents of total flavonoids in fresh and dried strawberries were 0.59 and 1.24 mg g−1, respectively (Dyduch-SiemiNska et al., Reference Dyduch-SiemiNska, Najda, Dyduch, Gantner and Klimek2015). It was found that the synthesis of plant flavonoids is affected by three aspects: (1) structural gene regulation, as in Dracaena cambodiana (Lour.), by: 4-coumarate-CoA ligase (4CL), Chalcone Synthase (CHS), Chalcone Isomerase (CHI), Dihydroflavonols-4-Reductase (DFR), leucoanthocyanidin reductase (LAR), Flavanones 3-Hydroxylase (F3H) and flavonols synthase (FLS) which all play a key role in the synthesis of flavonoids (Zhu et al., Reference Zhu, Cao, Dai, Li, Guo, Mei and Peng2016). The high expression of F3′H in Chimonantus praecox L. provided a sufficient amount of the precursor dihydroquercetin for the biosynthesis of flavonol and anthocyanin, and the expression level of Anthocyanidin Synthase (ANS) was positively correlated with the whole flavonoid metabolic pathway (Yang et al., Reference Yang, Zhao, Li, Zhao, Aslam, Yu and Chen2018); (2) the regulation of transcription factors (TFs) such as the MYB-bHLH-WDR (MBW) complex. The promoters of UDP-glucose:flavonoids 3-o-glucosyltransferase (UF3GT), ANS and FLS in apple have specific binding elements with MYB; when MYB interacts with bHLH, it had a significant impact on the promoter activity of UFGT, ANS and FLS, and regulates the synthesis of flavonols and other substances (Wang et al., Reference Wang, Xu, Jiang, Zhang, Lu, Qiu, Qu, Wang, Wu and Chen2017); and (3) regulation of different hormone signalling pathways, such as abscisic acid (ABA), jasmonic acid (JA) or cytokinin, promotes the synthesis of flavonoids, while gibberellin (GA), ethylene or brassinosteroid (BR) inhibit the synthesis of flavonoids (Peng et al., Reference Peng, Han, Yuan, Zhang, Huang and Ren2011). The flavonoid components and metabolic pathways of Arabidopsis thaliana seeds were described to some extent: the substances enter the phenylalanine pathway catalyzed by phenylalanine ammonia-lyase (PAL), enter the flavonoid metabolic pathway through C4H and 4CL of specific subtypes, and then form various flavonoid components catalyzed by a series of enzymes such as CHS, CHI, F3H, F3′H, FLS, DFR, ANS and GT. This laid the foundation for related research in other species (Saito et al., Reference Saito, Yonekura-Sakakibara, Nakabayashi, Higashi, Yamazaki, Tohge and Fernie2013).
Seed is an important storage organ of flavonoids. The content of total flavonoids in different organs of Euscaphis konishii Hayata was 26.31 mg g−1 in leaves, 1.43 mg g−1 in branches and 7.29 mg g−1 in seeds (Liang et al., Reference Liang, Ni, Carballar-Lejarazu, Zou, Sun, Wu, Yuan, Mao, Huang and Zou2019). The average content of total flavonoids in leguminous forage seeds such as Cicer arietinum and Glycine max was 1.49 ± 0.89 mg g−1 FW (Prati et al., Reference Prati, Baravelli, Fabbri, Schwarzinger, Brandolini, Maietti, Tedeschi, Benvenuti, Macchia, Marotti, Bonetti, Catizone and Dinelli2007), which was between the contents of abovementioned edible flowers and fruits. Seed development is a dynamic process of constant metabolism of substances, and the metabolism of flavonoids in each stage will have an impact on the total flavonoids and components of its mature seeds. However, the content and components of flavonoids in seeds at different developmental stages have been studied only in Scutellaria baicalensis Georgi. (Xu et al., Reference Xu, Yu, Shi, Xie, Zhu, Wu and Qin2018). The molecular regulatory mechanisms of flavonoid metabolism during seed development have not been reported to date.
Flavonoids from Artemisia are rich in species and have anti-tumor, anti-diabetic complications and anti-inflammatory activities, which have broad development prospects (Liu et al., Reference Liu, Si, Jiao, Zhang, Li, Liu and Wang2020). Desert plants have good viability in harsh habitats (e.g. drought, high temperatures, high light intensity, ultraviolet rays and lack of nutrients), and flavonoids are one of the important adaptive mechanisms they employ to cope with stress (Xu et al., Reference Xu, Dubos and Lepiniec2015). Artemisia sphaerocephala (belonging to Artemisia of Compositae) is widely distributed across Gansu Province and the Inner Mongolia Autonomous region of China, and comprises one of the most important pioneer plants of mobile semi-stable sand dunes in the desert steppe of Northwest China (Huang et al., Reference Huang, Gutterman and Osborne2004). A. sphaerocephala seeds have a strong resistance to drought, cold and saline-alkali soil conditions (Yang et al., Reference Yang, Baskin, Baskin, Liu and Huang2012), and are a source of traditional Chinese medicines (Zhao et al., Reference Zhao, Li, Liu, Li and Wang2007). This study endeavoured to gain an in-depth understanding of the regulatory mechanisms behind flavonoid biosynthesis and lays the foundation for the further development and utilization of the desert plant A. sphaerocephala.
Materials and methods
Plant materials
A. sphaerocephala seeds were collected from late August to mid-October 2016 in the Alxa desert of Inner Mongolia (38°68′N, 105°61′E). From the 10th day after flowering, seeds were harvested from the four sides of the plants every 10 d until the seeds matured. Finally, we collected seeds at seven different development stages, respectively, which were designated as S1–S7. Seeds at the same developmental stage were evenly mixed to form a sample, which was repeated for three organisms at each developmental stage (Han et al., Reference Han, Zhang, Miao, Hu, Nan and Fu2020b).
Extraction of flavonoids and components of HPLC analysis
Extraction of total flavonoids
The seeds at all developmental stages were dried to constant weight at 65°C. The dried seeds were ground with a ball mill at 30 Hz for 1.5 min and then passed through a 2.0 mm screen. A 0.2 g sample was placed in a 10 ml brown centrifuge tube with a 1/1000 balance, to which 5 ml methanol (70%, v/v) was added, to obtain extract for 15 min at 40°C with a 40 kHz ultrasonic cleaning instrument (Dingtai Hengsheng, Wuhan, China). The extract was then centrifuged (Eppendorf, Hamburg, Germany) at 8000g at room temperature for 5 min, after which the supernatant was transferred to a 10 ml volumetric flask. The residue was re-extracted with 5 ml methanol (70%, v/v) and centrifuged according to the above conditions. The extract was merged into a 10 ml volumetric flask at a fixed volume with methanol (70%, v/v) (Mesquita and Monteiro, Reference Mesquita and Monteiro2018).
Determination of total flavonoid content
A standard 0.1 mg ml−1 rutin solution was prepared by adding a 5 mg volume of rutin (Beringway Technology, Beijing, China, purity ≥ 98%) to a 50 ml volumetric flask, which was dissolved in a methanol solution (70%, v/v), and the volume was fixed to scale. The determination of the total flavonoid content proceeded according to the following method. A 1 ml sample was added to a 10 ml volumetric flask, to which methanol was added (70%, v/v) to 5 ml. A 0.3 ml volume of NaNO2 (5%, w/v) was then added to the flask and mixed. After 5 min, a 0.6 ml volume of AlCl3 (10%, w/v) was added to the mixture, which sat for 6 min, after which 2 ml 1 mol/l NaOH was added to the mixture. The solution was diluted with methanol (70%, v/v) and well shaken, placed at room temperature for 30 min, after which the absorbance was read at 510 nm with a UV spectrophotometer (Li et al., Reference Li, Fan, Qiu, Li and Nie2015).
HPLC analysis of components
Subsequently, the extract was purified through a C18 solid-phase extraction cartridge (BondElut, Agilent Technologies, Palo Alto, USA), and finally passed through a 0.22 μm organic phase filter membrane into a high-performance liquid chromatography (HPLC) sample bottle for testing. Metabolic chromatography was analysed via an HPLC (Agilent 1100 series, Palo Alto, USA) system, using a C18 column (4.6 × 150 mm, 5 μm, Agilent, Palo Alto, USA) and fluorescence detector (de Rijke et al., Reference de Rijke, Out, Niessen, Ariese, Gooijer and Brinkman2006). The chromatographic conditions were improved according to Georgieva et al.: the mobile phase was acetonitrile (A)-phosphoric acid aqueous solution (0.3%, v/v) (B), the column temperature was 30°C, the injection volume was 5 μl, the flow rate was 0.8 ml min−1, and the gradient was 88–85% B (0–1 min), 85–84% B (1–5 min), 40–25% B (11–13 min), 25–60% B (13–15 min) and 60–88% B (15–20 min), and finally the mobile phase ratio was maintained for 5 min. The chromatographic column was balanced for 10 min between two injections, and the detection wavelength was 270 nm (Georgieva et al., Reference Georgieva, Кatsarova, Gercheva, Bozov and Dimitrova2019). The flavonoids were qualitatively and quantitatively determined with an external standard method using chalcone, quercetin, naringenin, taxifolin, cyanidin chloride and apigenin standards (Aladdin Biochemical Technology Co., Ltd., Shanghai, China, purity ≥ 98%).
RNA extraction and creation of a cDNA library
The cDNA library was constructed according to the method of Han et al. (Reference Han, Zhang, Miao, Hu, Nan and Fu2020b). Total RNA was extracted from the seeds of A. sphaerocephala at seven different developmental stages using the Plant RNA Kit (OMEGA, Norcross, USA). The RNA degradation and contamination were assessed via 1% agarose gel electrophoresis, whereas the RNA purity was quantified using a Nanodrop ND1000 (Thermo Science, Waltham, USA), at least 20 μg of total RNA was used for cDNA library preparation. Construction of cDNA Library based on Illumina HiSeq2500 (Illumina, San Diego, USA) platform. There were three biological repeats at each developmental stage.
Differential expression analysis
Pacific Biosciences RSII platform (Pacific Bioscience, Menlo Park, USA) was used for full-length transcriptome sequencing, and Illumina Hiseq2500 platform was used for high-throughput sequencing. Both of the two sequencing methods were paired-end sequencing. The readings obtained by sequencing each sample were compared with the Unigene library by Bowtie (Langdon, Reference Langdon2015). In the assembly and clustering process, the gene expression levels were normalized and calculated as FPKM (fragments per kilobase of exon model per million mapped reads) values (Zong et al., Reference Zong, Li, Xi, Cao, Wang, Wang and Liu2019). Differential expression analysis was performed between samples using DESeq, and the false detection rate (FDR) < 0.001 and estimated absolute log2 folding change (log2FC) ≥ 1 were employed as the threshold to identify differentially expressed genes (DEGs) (Wang et al., Reference Wang, Hua, Wang, Hannoufa, Xu and Wang2010a).
Functional annotation of genes
We employed BLASTX (version 2.2.26) and databases: COG (Clusters of Orthologous Groups), GO (Gene Ontology), KEGG (Kyoto Encyclopedia of Genes and Genomes), KOG (euKaryotic Ortholog Groups), Pfam (Protein family), Swiss-Prot and NR (NCBI non-redundant protein sequence), to annotate the functions of these genes (Chen et al., Reference Chen, Tang, Ren, Wei, Wu, Wu and Pei2018). Subsequent to setting the BLAST E-value parameter at less than 1 × 10⁻⁵, the KEGG E-value parameter at less than 1 × 10⁻⁵ and the HMMER parameter E-value at less than 1 × 10⁻¹⁰, the unigene annotations were obtained.
Quantitative Real-time PCR analysis
A total of 14 genes were selected, and specific primers were designed by PrimerPremier 5.0 software for Quantitative Real-time PCR (qRT-PCR) (supplementary Table S2). The cDNA of seeds at different developmental stages was used as a template, and the target genes were analysed by qRT-PCR using a MyiQ Single-Color Real-Time PCR Detection System (Bio-Rad, Berkeley, USA) by SYBR Premix Ex Taq Kit (Takara, Dalian, China). The relative expressions of the genes were normalized to the expression of an internal reference gene UBC9 (Hu et al., Reference Hu, Zhang, Nan, Miao, Yang, Duan and Fu2018), and the formula of the gene relative expression was 2−ΔΔCt.
Statistical analysis
Origin 2019 software is used for picture and heat map drawing, whereas IBM SPSS Statistics 26 software was employed to test significant differences and correlations (P < 0.05). The cluster analysis and expression pattern assessment for the DEGs were performed by the K-means clustering using Origin 2019 software, and the sequences of flavonoid metabolic genes were compared by DNAMAN 8.0.
Results
Total flavonoid and component content
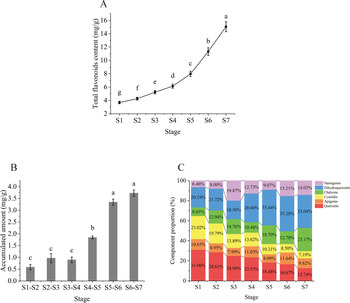
In this study, the total flavonoid content of A. sphaerocephala seeds at seven developmental stages was determined. The results revealed that the content of total flavonoids in S1–S4 increased continuously 10–70 d following anthesis, albeit that the accumulations were small (3.68, 4.27, 5.24 and 6.13 mg g−1, respectively). However, the flavonoid contents of S4–S7 increased rapidly, from 6.13 to 15.05 mg g−1 (Fig. 1A), and their accumulation was significantly higher than that of the other stages (Fig. 1B). The content and proportion of dihydroquercetin were calculated by the molar mass of each component: among them, dihydroquercetin accumulated significantly, and its content increased from 20.19 to 33.04%; chalcone accumulated more, and its content increased from 8.63 to 23.17%; naringin content increased from 6.46 to 19.83%, decreased to 9.07% of S5 and increased to 14.03%; apigenin content remained stable for seven periods, and the final content was 9.82%. The content of quercetin decreased from 31.06 to 12.74%, and the content of cyanidin continued to decrease from 23.02 to 7.19% (Fig. 1C). The content of each component was significantly different during S4–S7 (supplementary Table S1).
Changes of component proportion, component content and growth at different development stages. Note: (A) content of total flavonoids, (B) accumulation of total flavonoids and (C) proportion of each component to the content of total flavonoids. Different letters represent significant differences in content (P < 0.05).

Expression analysis of related genes of the flavonoid metabolic pathway
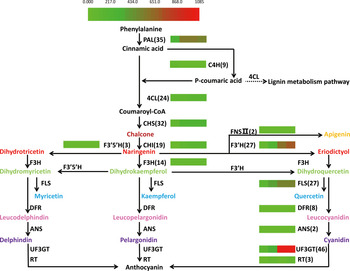
Total flavonoids accumulated rapidly during the S4–S7 stage. A cluster analysis of metabolic pathway-related DEGs expression showed that S4–S5 was the first group and S6–S7 was the second group (supplementary Fig. S2). Phenylalanine metabolites enter the flavonoid metabolic pathway through PAL, C4H and 4CL catalysis, CHS catalyzes the formation of chalcones, and CHI continues to catalyze chalcone as naringenin, to form intermediates of various flavonoid components and continues to be catalyzed by F3′5′H, F3H, FNSII and F3′H into different subgroups of dihydroflavonol, respectively. Dihydroflavonol was catalyzed by FLS to form proanthocyanidins under the action of DFR and ANS. Finally, anthocyanins were catalyzed by UF3GT and RT. The results revealed that there was a significant difference in the DEGs expression pattern between S4–S5 and S6–S7. The metabolic pathways of the flavonoids in A. sphaerocephala seeds were developed according to their composition and KEGG analysis (Fig. 2). A total of 251 DEGs were obtained through DEGs analysis (supplementary Table S4), and an NCBI database comparison showed that they encoded for 14 enzymes related to flavonoid synthesis. Pairwise alignment of the annotated sequences of the gene family to which DEG belonged showed that the similarity between sequences was less than 99% (supplementary Table S3), which was consistent with the CD-HIT results.
Metabolic pathway of flavonoids in A. sphaerocephala seeds and the expression levels of related genes from S4–S7. Note: the corresponding parentheses of genes are the number of annotated sequences, where the components of flavonoids of the same colour represent the same subclass.

Taking the sum of the FPKM of all members of the gene family as the total gene expression level, the expression pattern changes of related genes during the significant increase of flavonoids (S4–S7) were analysed (supplementary Table S6). The results indicated that the expression of PAL in S5 was 2.04 times higher than that in S4, and this high expression was maintained until S7, which was 1.98 times higher than that in S4, whereas the expression of 4CL was unchanged from S4–S5, and the expression in S6 and S7 was 1.58 and 1.52 times higher than that in S5, respectively. The expression of CHS in S5 was 2.33 times higher than that in S4 and increased continuously to S7, which was 3.09 times higher than that in S4.
The expression of CHI in S5 was 3.95 times higher than that in S4, and that in S6 and S7 was 5.66 and 5.63 times higher than that in S4, respectively. The expression level of F3′H in S5 was 5.59 times as much as that in S4, and that in the S7 stage was 3.30 times higher than that in S5. The expression of FLS in S5 was 3.52 times higher than that in S4 and continued to rise to S7, and the expression in S7 was 4.73 times higher than that in S4. The expression of UF3GT in S6 was 7.72 times higher than that in S4, and that in S7 was 8.47 times higher than that in S4. The expressions of other structural genes were at low levels.
DEGs expression analysis
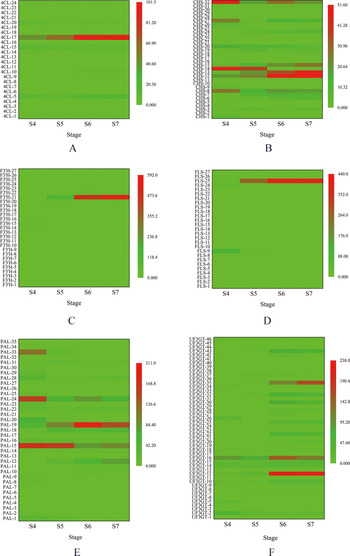
The higher expression levels of gene family members for S4–S7 were further analysed (Fig. 3). There were 24 members in 4CL, of which the expression of 4CL-17 accounts for a high proportion of the total expression, which was 47.75, 66.15, 70.47 and 68.70% respectively (Fig. 3A). There were 32 members in CHS, and the expression levels of CHS-8, CHS-12, CHS-13, CHS-14, CHS-15, CHS-27 and CHS-32 were relatively high. The sum of their expression levels for S4–S7 accounted for 59.39, 65.89, 72.30 and 82.08%, respectively (Fig. 3B).
Expression analysis of major genes related to flavonoids biosynthesis. Note: (A–F) the 4CL, CHS, F3′H, FLS, PAL and UF3GT gene family, respectively.

The F3′H included 27 members, among which the expression of F3′H-21 accounts for a high proportion of the total expression, which was 6.50, 56.35, 83.31 and 84.89% respectively (Fig. 3C). The FLS family included 27 members, among which the expression of FLS-25 accounts for a high proportion of the total expression, which was 7.70, 72.05, 84.15 and 85.19%, respectively (Fig. 3D).
The PAL family consisted of 35 members, where PAL-15, PAL-19, PAL-24 and PAL-33 were highly expressed, and the sum of their expressions accounted for 61.36, 61.61, 66.30 and 56.09% of the total expression for S4–S7, respectively (Fig. 3E). The UF3GT included 46 members, and the expression levels of UF3GT-2, UF3GT-12, UF3GT-16, UF3GT-32, UF3GT-35 and UF3GT-43 were high. The sum of their expressions accounted for 43.72, 50.51, 60.63 and 63.43% of the total (Fig. 3F).
Correlations between the expression of structural genes and the content of different components
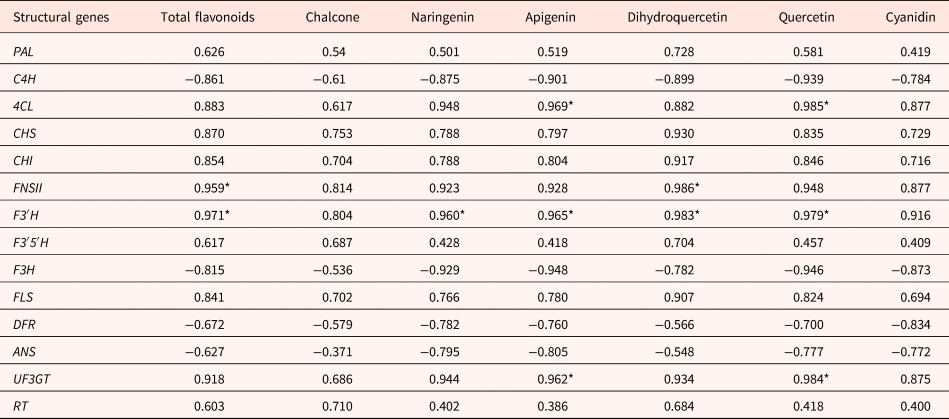
We analysed the correlations between the expressions of each structural gene, as well as the content of total flavonoids and different components during the S4–S7 period (Table 1). The results indicated that 4CL was positively correlated with the contents of apigenin and quercetin; FNSII was positively correlated with the contents of total flavonoids and dihydroquercetin; F3′H was positively correlated with the contents of total flavonoids, naringin, apigenin, dihydroquercetin and quercetin. There was no significant correlation between the expression of the genes PAL, C4H, CHS, CHI, F3H, FLS, DFR, ANS, UF3GT and RT and the content of total flavonoids and components.
Correlation analysis between the expressions of flavonoid metabolism-related genes and the content of flavonoids and their components

PAL, Phenylalanine ammonia-lyase; C4H, Cinnamate-4-hydroxylase; 4CL, 4-coumarate-CoA ligase; CHS, Chalcone Synthase; CHI, Chalcone Isomerase; F3′5′H, Flavonoids 3′,5′-hydroxylase; FNSII, Flavones synthaseII; F3′H, Flavonoids 3′-hydroxylase; F3H, Flavanones 3-hydroxylase; FLS, Flavonols Synthase; DFR, Dihydroflavonols-4-Reductase; ANS, Anthocyanidin Synthase; UF3GT, UDP-glucose:flavonoids 3-o-glucosyltransferase; and RT, Rhamnosyl transferase.
* There was a significant correlation between structural gene expression and substance content (P<0.05).
Analysis of TFs
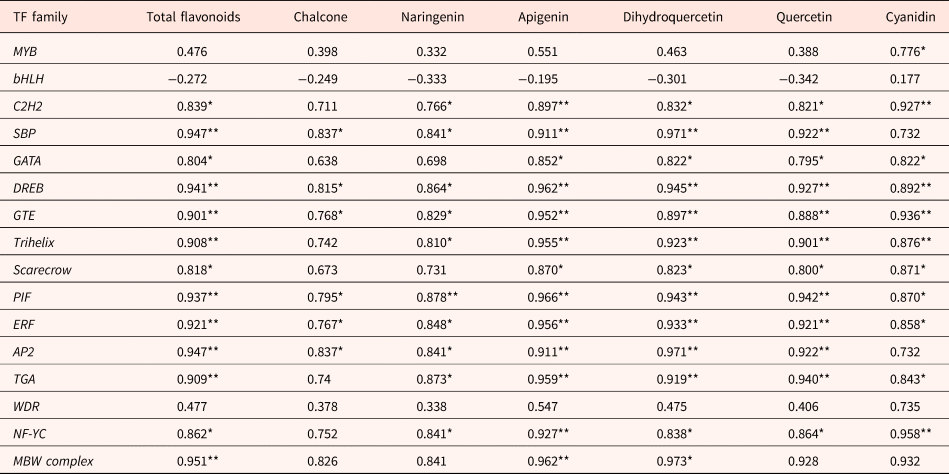
In this study, 15 TFs related to flavonoid synthesis were identified (Table 2), with a total of 992 annotation sequences (supplementary Table S5). Among these, except for MYB, bHLH and WDR, other TFs and the MBW complex were significantly positively correlated with the content of total flavonoids. A correlation analysis of the flavonoid components revealed that Ethylene-responsive element-binding factor (ERF), Dehydration-responsive element binding (DREB), Global Transcription factor Group E protein (GTE) and Phytochrome-interacting factor (PIF) had significant correlations with all components, whereas MYB had a positive correlation only with cyanidin. Further, bHLH and WDR had no significant correlations with the total components; however, the three complexes had positive correlations with dihydroquercetin and apigenin, whereas C2H2, Selenium-binding protein (SBP), GATA, Trihelix, scarecrow, AP2, TGA and NF-YC had positive correlations with dihydroquercetin, quercetin and apigenin.
Annotated sequence numbers of TFs in A. sphaerocephala seeds and their correlations with flavonoids
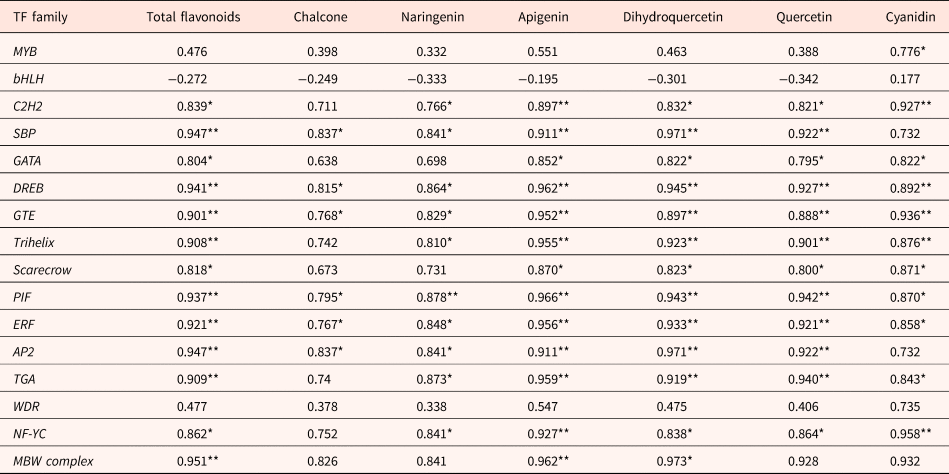
MYB, MYB transcription factors; bHLH, Basic helix-loop-helix; C2H2, C2H2-type zinc finger; SBP, Selenium-binding protein; GATA, Zinc-finger transcription factor; DREB, Dehydration-responsive element binding; GTE, Global Transcription Factor Group E protein; Trihelix, Trihelix DNA-binding factors; scarecrow, scarecrow-like protein; PIF, Phytochrome-interacting factor; ERF, Ethylene-responsive element-binding factor; AP2, APETALA2; TGA, TGACG motif-binding factor; WDR, WD repeat proteins; NF-Y, Nuclear factor Y transcription factor; and MBW complex, MYB-bHLH-WDR complex.
* P<0.05; ** P<0.01.
The degree of regulation of each transcription factor on the metabolic pathways of flavonoids and related structural genes was calculated according to the method of Sikdar and Datta (Reference Sikdar and Datta2017). The results indicated that during S4–S7, the TFs that played an obvious role in regulating the metabolic pathways of flavonoids primarily included MYB, bHLH, C2H2, SBP, GATA, MBW complex, DREB, GTE, Trihelix and PIF, and the main regulation period was during S5–S7 (supplementary Fig. S1A). Structural genes were significantly regulated by TFs during different development periods, among which the 4CL and CHS were from S4–S7, F3′H was from S5–S7, UF3GT was S4 and from S6–S7, C4H was from S4–S6, and FLS, ANS and CHI were from S5–S6, whereas F3H and F3′5′H were regulated during S5 and S6, PAL, FNSII, RT and DFR were regulated in S4 (supplementary Fig. S1B).
Transcriptome data validation by qRT-PCR
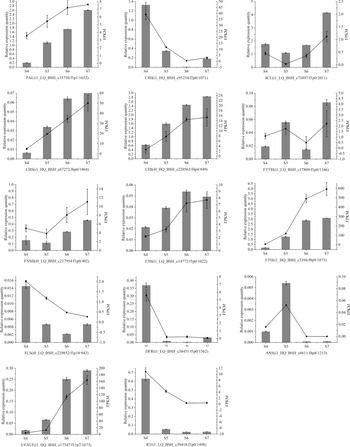
The relative expression of 14 genes directly involved in flavonoid metabolism during the S4–S7 development stages of A. sphaerocephala seeds was verified by qRT-PCR, with the results being in good agreement with the outcomes of RNA-Seq (Fig. 4). The correlation between the relative gene expression obtained by qRT-PCR and the gene expression obtained by RNA-seq was calculated (supplementary Table S2). The results implied that the sequencing results were accurate and the DEGs analysis was reliable. The expression data of each gene came from three biological repeats.
Analysis of unigene expressions involved in flavonoid biosynthesis at different development stages. Note: The left and right Y-axes represent the relative expression level based on qRT-PCR results and the expression level based on RNA-seq results, respectively (FPKM).

Discussion
In this study, it was found that the content of total flavonoids in mature seeds of A. sphaerocephala was 15.05 mg g−1, and the total flavonoids accumulated continuously during the whole seed development, and the rapid accumulation stage was from 40 to 70 d after anthesis. Total flavonoids of A. sphaerocephala were accumulated with the development process, and many species were similar: During the flower development of two Paeonia suffruticosa Andr. varieties, the content of total flavonoids increased from 2.98 and 5.30 mg g−1 to 3.46 and 6.08 mg g−1, respectively (Zhao et al., Reference Zhao, Tang, Hao and Tao2015); with the development of flowers, the total flavonoids of three varieties of Paeonia lactiflora Pall. have an upward trend (Zhao et al., Reference Zhao, Tao, Han and Ge2012); the content of total flavonoids in the fruit of Musa nana Lour. variety ‘Brazil’ increased firstly and then decreased during fruit ripening (Dong et al., Reference Dong, Hu, Hu and Xie2016); most flavonoid components such as quercetin and kaempferol increased during the development of yellow and black Brassica campestris L. seeds (Jiang et al., Reference Jiang, Shao, Li, Lu, Zhang and Wang2013).
In this study, high-throughput and full-length transcriptome sequencing techniques were used to sequence and compare the transcripts of A. sphaerocephala seeds at different developmental stages. There were 14 structural genes with 255 annotated sequences and 15 TFs with 992 sequences related to flavonoids metabolism. Structural genes mainly include: PAL had 35 members, 4CL had 24 members, CHS had 32 members, F3′H had 27 members, FLS had 27 members and UF3GT had a maximum of 46 members. The sequencing results of lotus (Lotus corniculatus L.) showed that 150 sequences were annotated as flavonoids synthesis-related structural genes, among which PAL had 23 members, CHS had 13 members, FLS had 17 members and GT had 30 members (Wang et al., Reference Wang, Hua, Wang, Hannoufa, Xu and Wang2013). There were 146 flavonoids metabolism-related unigene in lotus (Saussurea lappa Falc.), and the structural genes with more sequences include UFGT with 118 members, PAL with 6 members and F3H with 7 members (Bains et al., Reference Bains, Thakur, Kaur, Singh and Kaur2019). It can be seen that although the number of unigenes for flavonoids metabolism design was different in different species, PAL and GT were the key genes, and other key genes were different.
In this study, we found that the mature seeds of A. sphaerocephala were rich in flavonoid subclasses, including flavonols (45.78%), chalcones (23.17%), flavanones (14.03%), flavones (9.82%) and anthocyanidins (7.19%). The main flavonols were dihydroquercetin (72.17%) and quercetin (27.83%), and the proportion of dihydroquercetin to total flavonoids increased significantly with the development of A. sphaerocephala seeds, while the proportion of quercetin decreased gradually. Among flavonoids from A. sphaerocephala, dihydroquercetin could effectively increase the anti-mildew ability of seeds, and at the same time improve the germination rate of seeds and the adaptability of seedlings (Balakhnina et al., Reference Balakhnina, Gavrilov, Wlodarczyk, Borkowska, Nosalewicz and Fomina2009). Quercetin effectively protects plant cells from reactive oxygen species (ROS), while flavanones inhibit the consumption of important antioxidant enzymes by iron in the mitochondria (Jagetia and Reddy, Reference Jagetia and Reddy2011, Kurepa et al., Reference Kurepa, Shull and Smalle2016). Flavones were observed to reduce the UV damage of tobacco DNA (Li et al., Reference Li, Li, Yang, Zeng, Luo and He2020), whereas anthocyanins could improve the adaptability of plants to low-temperature environment (Zhang et al., Reference Zhang, Zhai, Shao and Lin2019).
The above components coexisted in A. sphaerocephala seeds, which may help to avoid fungal infections and increase their capacity to resist drought and ultraviolet stress in desert areas. Flavonoids from A. sphaerocephala also possess a certain medicinal value. Chalcones could be combined with other anti-cancer drugs to enhance their efficacy and could be employed to develop new anti-cancer drugs (Gao et al., Reference Gao, Huang and Xiao2020). Flavones and their derivatives might be utilized as substrates for antioxidant, anti-cancer and anti-inflammatory drugs (Singh et al., Reference Singh, Kaur and Silakari2014). Proanthocyanidins can increase glutathione peroxidase and catalase, which are antioxidant defence components that might be employed to prevent cardiovascular diseases (Kruger et al., Reference Kruger, Davies, Myburgh and Lecour2014). A. sphaerocephala has been used as a traditional Chinese medicine to treat mumps and tonsillitis, whose efficacy may be related to flavonoids (Zhao et al., Reference Zhao, Li, Liu, Li and Wang2007).
Phenylalanine enters the metabolic route of flavonoids through the phenylpropane pathway, to finally produce anthocyanins. The phenylpropane pathway includes three enzymes (PAL, C4H and 4CL) where PAL plays a key regulatory role (Su et al., Reference Su, Jiang and Li2015). In this study, the expression of PAL increased 1.04 times from S4–S5, maintained high expression until S7, and converted a large quantity of phenylpropionic acid to the substrate required for the synthesis of flavonoids; this result was consistent with the result that 40–70 d after anthesis was the rapid accumulation period of flavonoids in A. sphaerocephala. At the same time, it was consistent with the results of higher PAL enzyme activity and higher content of quercetin in transgenic tobacco with A. membranaceus PAL (Liu et al., Reference Liu, Xu, Li, Hu and Lin2006); PAL could increase the flux of flavonoid metabolic pathway.
Type I and II 4CL are associated with lignin and flavonoid metabolic pathways, respectively (Wang et al., Reference Wang, Yu, Cai, Zhu, Liu, Zhao, Lu, Li, Xu and Yu2016). The 4CL-17 of A. sphaerocephala was similar to that of Os4CL2 and belonged to subtype II (supplementary Fig. S3), indicating that its high expression induced more substances to flow into the flavonoid metabolic pathway. The structural genes of the flavonoid metabolic pathway are divided into early biosynthesis genes (EBGs) (CHS, CHI, F3H, F3′5′H, F3′H and FLS), which catalyze flavonol synthesis, and late biosynthesis genes (LBGs) (DFR, ANS, UF3GT and RT), which catalyze anthocyanin synthesis (Xu et al., Reference Xu, Grain, Bobet, Le Gourrierec, Thevenin, Kelemen, Lepiniec and Dubos2014). Among the EBGs in this study, the expression of CHS increased continuously during S4–S7, which might further promoted the synthesis of other downstream substances by promoting the accumulation of chalcone, and the expression level of CHS gene in grape increased gradually with the ripening process, which could promote the accumulation of flavonols, which was consistent with the results of this study (Harris et al., Reference Harris, Luczo, Robinson and Walker2013).
Naringenin was produced by CHI catalysis. The expression of CHI in S5 was 3.95 times higher than that in S4 and continued to increase in S6, resulting in the rapid accumulation of naringin in the S4–S7 stage (supplementary Table S1). The results of this study were consistent with the results of the study that there was a positive correlation between the expression of CHI and the changes of their contents during the development of citrus and tomato fruits (Wang et al., Reference Wang, Li and Xia2010b). Naringenin was the common substrate of F3′H and F3′5′H, FNSII and F3H. In this study, the expression of F3′H from S4–S7 was very high, which was 0.6, 2.5, 9.0 and 9.8 times of the total expression of the other three, which led to a metabolic pathway that was biased towards the synthesis of dihydroquercetin.
It is worth noting that F3′H was positively correlated with the total contents of flavonoids, naringenin, apigenin, dihydroquercetin and quercetin (Table 1), which suggested that F3′H may promote the accumulation of total flavonoids by promoting the metabolic pathway flux in A. sphaerocephala. This was consistent with the result that there was a positive correlation between the expression level of F3′H and the expression level of ANS and the content of total flavonoids in Chimonanthus praecox L. (Yang et al., Reference Yang, Zhao, Li, Zhao, Aslam, Yu and Chen2018). The total content of tobacco plants transformed with Cynara cardunculus L. F3′H was also higher than that of the control plants, which directly proved that the expression of F3′H promoted the synthesis of total flavonoids (De Palma et al., Reference De Palma, Fratianni, Nazzaro and Tucci2014).
FLS was the key step to regulate flavonol components. Fagopyrum tataricum Gaertn. FtFLS can catalyze the conversion of dihydroquercetin to quercetin, myricetin and kaempferol, and this study also reached a consistent conclusion FLS was the key gene that regulated the flavonol components. The overexpression of FLS in Fagopyrum tataricum Gaertn. significantly increased the content of total flavonoids and flavonols (Li et al., Reference Li, Bai, Li, Chen, Han, Zhao, Shao, Park and Wu2012). It is worth noting that the expression of F3′H in A. sphaerocephala during S6–S7 was 1.14 and 1.35 times higher than that of FLS, respectively (supplementary Table S6).
Among the LBGs in this study, a key gene for anthocyanin synthesis (UF3GT) exhibited a high expression level. The two genes responsible for precursor products (DFR for catalyzing dihydroquercetin to leucoanthocyanidins and ANS for controlling anthocyanin synthesis) had low expression levels that limited the accumulation cyanidin, thus limiting anthocyanin synthesis. Interestingly, UF3GT was positively correlated with the contents of apigenin and quercetin. The Arabidopsis GT family improved the expression level of CHI, F3H and FLS in flavonoid synthesis pathway through ectopic expression and increased the flux of flavonoid metabolism pathway by glycosylating quercetin and other substances to promote the accumulation of total flavonoids (Li et al., Reference Li, Yu, Meng, Lin, Li and Hou2018). UF3GT, a member of GT family, may also promote the accumulation of apigenin and quercetin in A. sphaerocephala seeds through similar activities. However, in this study, the expression of RT was lower in S4–S7 stage and had no significant relationship with the content of total flavonoids and various components, indicating that RT did not directly affect the metabolism of flavonoids.
The flavonoids metabolic pathway depends largely on the regulation of TFs on synthesis-related genes, which was further verified in this study. The regulation level of TFs in A. sphaerocephala for the metabolic pathway was lower at S4 and higher during S5–S7 (supplementary Fig. S1A), which may be one of the reasons for the increased expression of structural genes in late seed development. The MBW complex formed by MYB, bHLH and WDR regulates the metabolic pathways of flavonoids at the transcription level, in which MYB determines the complex activity and plays a key regulatory role (Arlotta et al., Reference Arlotta, Puglia, Genovese, Toscano, Karlova, Beekwilder, De Vos and Raccuia2020). WDR lacks a DNA-binding domain, which is employed as an auxiliary activator to enhance gene expression and promote the interactions of proteins between MBW complexes (Matus et al., Reference Matus, Poupin, Canon, Bordeu, Alcalde and Arce-Johnson2010). The MYB and bHLH of A. sphaerocephala had significant regulatory effects, while WDR had none, which was consistent with previous research results.
The expression pattern of MYB in Malus pumila Mill. was directly related to the expression pattern of FLS and interacts with bHLH, which plays an important role in the expression of FLS, ANS and UFGT. (Wang et al., Reference Wang, Xu, Jiang, Zhang, Lu, Qiu, Qu, Wang, Wu and Chen2017), and the expression pattern of bHLH in Punica granatum L. was related to the expression of MYB, and it is also related to DFR, CHS, F3′5′H and UFGT, indicating that both of them play an important role in flavonoid metabolism (Arlotta et al., Reference Arlotta, Puglia, Genovese, Toscano, Karlova, Beekwilder, De Vos and Raccuia2020). The expression pattern of MBW in A. sphaerocephala was significantly correlated with total flavonoids and flavonols. The increase of its transcriptional level promoted the high expression of FLS and UF3GT in S5–S6 and S4–S7, respectively, which was basically consistent with the results of previous studies. The significant regulation of bHLH in A. sphaerocephala occurred from S5–S6, which corresponded to the period of the transcriptional regulation of F3′H, F3H and F3′5′H (supplementary Fig. S1B).
The SBP of apple releases bHLH through JA signalling pathway and significantly promoted the expression of DFR, ANS and UF3GT, thus promoting the accumulation of proanthocyanins and anthocyanidins (Liu et al., Reference Liu, An, Liu, Hu, Wang, You and Hao2017). The expression pattern of SBP in A. sphaerocephala was significantly correlated with total flavonoids and flavonols, and its regulation period on structural genes was S6–S7, corresponding to the transcription regulation period of ANS and UF3GT, which proved that SBP might play an important role in flavonoids metabolism of A. sphaerocephala.
Studies have revealed that TFs can indirectly affect the expression of genes related to flavonoid metabolism by regulating hormone levels. As positive factors of optical signals, the GATA and PIF in Arabidopsis thaliana inhibit the accumulation of BR through antagonism between BR and optical signals (Luo et al., Reference Luo, Lin, Zhu, Zhu, Sun, Fan, Cheng, Hao, Oh, Tian, Liu, Zhang, Xie, Chong and Wang2010; Oh et al., Reference Oh, Zhu and Wang2012); BR inhibited the expression of F3′H and UFGT in apple and reduced the synthesis of flavonoids (Zheng et al., Reference Zheng, An and Wang2018). In this study, the GATA and PIF of A. sphaerocephala seeds were positively correlated with the expression of F3′H and UF3GT (supplementary Table S7).
ABA inhibited the expression of FLS in tomato (Mou et al., Reference Mou, Li, Luo, Mao and Ying2015). The high expression of DREB, C2H2, ERF and AP2 will reduce the endogenous ABA content in plants (Zhu et al., Reference Zhu, Zhang, Gao, Tong, Xiao, Li and Zhang2010; Upadhyay et al., Reference Upadhyay, Gupta, Soni, Garg, Pathre, Nath and Sane2017). Trihelix and GTE inhibit the transduction signals of ABA hormones, which make genes insensitive to ABA regulation (Luo et al., Reference Luo, Tang, Mei, Peng, Li, Li, Yan, Zeng, Liu, Wu and Wu2017; Misra et al., Reference Misra, McKnight and Mandadi2018). In this research, Trihelix, GTE, C2H2, ERF and AP2 were positively correlated with the expression of FLS (supplementary Table S7), which may promote flavonols synthesis by reducing the inhibition of ABA on FLS expression.
Scarecrow and NF-Y participate in the regulation of reserve nutrients in seeds (Gao et al., Reference Gao, Li, Huang, Gropp, Gjetvaj, Lindsay, Wei, Coutu, Chen, Wan, Hannoufa, Lydiate, Gruber, Chen and Hegedus2015; Xu et al., Reference Xu, Zhang and Xue2016), whereas TGA can increase the content of pyridine and alkaloid in Tripterygium wilfordii Hook. f. (Han et al., Reference Han, Liu, Wang, Wang and Miao2020a). Flavonoids were not the direct targets of scarecrow, TGA and NF-YC; however, they had a positive correlation with the flavonoid content in A. sphaerocephala. It was speculated that these three compounds influenced the synthesis of flavonoids in A. sphaerocephala seeds by regulating the metabolism of other substances.
Conclusions
The results of this study revealed that the rapid accumulation of flavonoids in A. sphaerocephala seeds occurred 40–70 d after flowering. Flavonoids include flavonols (dihydroquercetin and quercetin), chalcones (chalcone), flavones (apigenin), flavanones (naringin) and anthocyanidins (cyanidin). The metabolic pathways of flavonoids in A. sphaerocephala seeds are regulated by structural genes, TFs and plant hormones, environmental factors. The key genes involved in the synthesis of flavonoids included PAL, 4CL, CHS, CHI, F3′H FLS and UF3GT. PAL, 4CL and UF3GT might increase the material flux of the flavonoid metabolic pathway, the high expression of CHS promoted the synthesis of chalcone, the high expression of CHI promoted the synthesis of naringenin, and the high expression of F3′H and FLS led to the highest flavonol content of dihydroquercetin and quercetin in A. sphaerocephala seeds. TFs such as the MBW complex and SBP might directly regulated the structural genes of flavonoid metabolism, while C2H2, GATA, DREB, GTE, Trihelix and PIF might indirectly promoted the synthesis of flavonoids in seeds by affecting hormones such as BR and ABA.
Supplementary material
To view supplementary material for this article, please visit: https://doi.org/10.1017/S096025852100012X.
Supplementary Table S1 shows the content of flavonoids in A. sphaerocephala at different stages; supplementary Table S2 shows the primer sequences for qRT-PCR and correlation between the expression level of RNA-seq and the relative expression level of qRT-PCR; and a pairwise comparison of the annotation sequences of flavonoid metabolic pathway structural genes is depicted in supplementary Table S3. The annotation sequence of the flavonoid metabolic pathway structural genes is shown in supplementary Table S4; the annotation sequence of TFs related to flavonoid metabolism is displayed in supplementary Table S5; the expression of structural genes during S4–S7 is shown in supplementary Table S6; and correlations between the expression of structural genes related to flavonoid metabolism and TFs are displayed in supplementary Table S7. Supplementary Fig. S1 shows the degree of regulation of TFs on the metabolic pathways and structural genes of flavonoids during S4–S7; supplementary Fig. S2 shows cluster analysis of genes related to flavonoid Metabolism in S4–S7; supplementary Fig. S3 shows phylogenetic tree analysis of A. sphaerocephala 4CL-17 and Rice 4CL.
Data availability
The datasets are available from the NCBI Short Read Archive (SRA) (https://www.ncbi.nlm.nih.gov/sra/) under accession number SAMN15196573 and SAMN15196574, respectively.
Financial support
This study was funded by the National Natural Science Foundation of China (31770763), the National Key R&D Program of China (2016YFC0500506), the National Basic Research Program of China (2014CB138703), the Fundamental Research Funds for the Central Universities (lzujbky-2017-54), the Changjiang Scholars and Innovative Research Team in University (IRT_17R50) and the 111 project (B12002).
Conflict of interest
The authors declare no conflict of interest.