Introduction
The East Antarctic Ice Sheet (EAIS) is an elliptical dome that contains more than 26 million km3 of glacier ice, about 83% of the total volume of ice in Antarctica. If the EAIS melted, it would cause a further global sea level rise of ~70 m (Denton et al. Reference Denton, Prentice, Burckle and Tingey1991, Anderson Reference Anderson1999). Thus, knowledge of the past configurations and behaviour of the EAIS is critical to construct Antarctic glaciological models and to anticipate its contribution to sea level rise with any future global warming. Considerable data that could represent the past behaviour of the EAIS have been acquired from studies of marine sediments, ice cores, and moraines (Ingólfsson et al. Reference Ingólfsson, Hjort, Berkman, Björck, Colhoun, Goodwin, Hall, Hirakawa, Melles, Möller and Prentice1998, Petit et al. Reference Petit, Jouzel, Raynaud, Barkov, Barnola, Basile, Bender, Chappellaz, Davis, Delaygue, Delmotte, Kotlyakov, Legrand, Lipenkov, Lorius, Pépin, Ritz, Saltzman and Stievenard1999, Wilson et al. Reference Wilson, Barron, Ashworth, Askin, Carter, Curren, Dalhuisen, Friedman, Fyodorov-Davidov, Gilichinsky, Harper, Harwood, Hiemstra, Janecek, Licht, Ostroumov, Powell, Rivkina, Rose, Stroeven, Stroeven, van der Meer and Wizevich2002). However, there is a lack of direct evidence regarding the height of the past ice sheet surface in the interior EAIS (Anderson Reference Anderson1999, Bentley Reference Bentley1999). Considerable controversy exists over whether or not East Antarctica experienced extensive deglaciation during the mid-Pliocene (~3 Ma), when global temperatures are believed to have been a little warmer than today (Miller & Mabin Reference Miller and Mabin1998, Haywood et al. Reference Haywood, Valdes, Sellwood and Kaplan2002).
Two apparently opposing viewpoints have emerged amongst earth scientists. The first proposes that the current ice sheet has existed in its present cold and polar form since at least ~8.1 Ma (Clapperton & Sugden Reference Clapperton and Sugden1990, Sugden et al. Reference Sugden, Marchant, Potter, Souchez, Denton, Swisher III and Tison1995, Warnke et al. Reference Warnke, Marzo and Hodell1996). The second viewpoint suggests that the EAIS varied considerably under the more temperate climatic conditions, and a major decrease to one-third of the present ice volume may have occurred during the Pliocene (Webb & Harwood Reference Webb and Harwood1991, Wilson Reference Wilson1995). Discrimination between these viewpoints requires more field evidence, especially from the interior of East Antarctica, as it represents a critical part of the EAIS.
Dating surface exposures of bedrock or moraine deposits using in situ produced cosmogenic nuclides provides a direct method to determine the glacial history (Nishiizumi et al. Reference Nishiizumi, Winterer, Kohl, Klein, Middleton, Lal and Arnold1989, Lal Reference Lal1991, Ivy-Ochs et al. Reference Ivy-Ochs, Schlüchter, Kubik, Dittrich-Hannen and Beer1995, Schäfer et al. Reference Schäfer, Ivy-Ochs, Wieler, Leya, Baur, Denton and Schlüchter1999). To measure the extent of past ice surface elevation fluctuations in the interior of East Antarctica, we have analysed in situ produced cosmogenic 10Be (half life = 1.52 Ma) and 26Al (half life = 0.71 Ma) along bedrock profiles sampled from two nunataks in the Grove Mountains (GM). The results show a limited decrease of the ice surface elevation for a period as long as 1–2 Ma since mid-Pliocene time and subsequent increase at least one time.
Geological setting
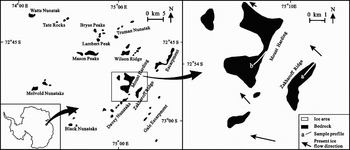
The Grove Mountains (GM) lie in Princess Elizabeth Land (72°20′–73°10′S, 73°50′–75°40′E), in the interior of East Antarctica (Fig. 1). They stand 440 km away from the Larsemann Hills, which belong to the east band of hills near Prydz Bay. The GM cover an area of ~3200 km2 and include 64 nunataks (Liu et al. Reference Liu, Zhao, Liu and Yu2003).
Map of the Grove Mountains showing sample profile a in Zakharoff Ridge, and profile b in southern Mount Harding.

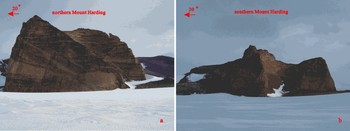
Bedrock of the GM is composed mainly of high-grade late Proterozoic metamorphic rocks, ranging in grade from upper amphibolite to granulite facies, and including felsic granulite, granitic gneiss, mafic granulite lenses and charnockite (Liu et al. Reference Liu, Zhao, Liu and Yu2003). The elevations of the present ice surface in most parts of the GM are c. 1900–2100 m. Few reports regarding the glacial history of the GM had been published before the 15th Chinese Antarctic Research Expedition (CHINARE) arrived there in 1998. Models have been used to speculate about the surface elevation of the EAIS during the Last Glacial Maximum (LGM) without field support (Denton & Hughes Reference Denton and Hughes2002, Huybrechts Reference Huybrechts2002). The 15th, 16th, and 22nd CHINARE worked in the GM during the 1998, 1999, and 2005 summers and found potential indicators of past surface elevations of the interior EAIS, such as large ice eroded cliffs, striations, soils and moraines (Liu et al. Reference Liu, Zhao, Liu and Yu2003, Li et al. Reference Li, Liu, Ju and Huang2003, Fang et al. Reference Fang, Liu, Li, Huang and Yu2005). The cliffs commonly occur on the lateral and lee sides of the nunataks of the GM (relative to the ice flow direction), and usually rise several hundred metres high. Typical cliffs on Mount Harding (divided into northern Mount Harding and southern Mount Harding) extend almost to the crest (Fig. 2). Ice striations and moraines were commonly found up to ~100 m above the present ice surface. This perhaps suggests a limited increase of the ice sheet surface elevation after initially decreasing from the crest.
Ice eroded cliffs in a. northern Mount Harding, and b. southern Mount Harding. The cliffs extend almost to the crest on the lateral and lee sides (relative to the ice flow direction).

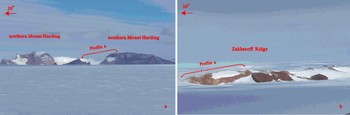
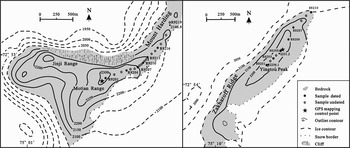
The bedrock samples analysed in this work come from two profiles, on Mount Harding (72°53′S, 75°01′E) (Fig. 3a) and Zakharoff Ridge (72°54′S, 75°11′E) (Fig. 3b), respectively. Ten felsic granulite samples (R8201–R8210) were collected from a smooth slope on Zakharoff Ridge (Fig. 4). Six of the ten samples taken were studied in this work. R8201 comes from the crest at an elevation of 2250 m; R8205 comes from close to a GPS mapping control point with an elevation of 2230 m, and R8210 from near the present ice surface, at ~2100 m. In addition, we also analysed six of nineteen felsic granulite samples (R9201–R9219) from another gentle slope on southern Mount Harding (Fig. 4). Southern Mount Harding, ~5 km farther west, rises ~50 m higher than the Zakharoff Ridge. R9201 comes from the crest of southern Mount Harding, at an elevation of ~2300 m, ~200 m above present ice surface on the stoss side. All bedrock samples have thin (0.1–0.5 cm) and white silicified surfaces, which suggest that they may have undergone very little erosion (Ivy-Ochs et al. Reference Ivy-Ochs, Schlüchter, Kubik, Dittrich-Hannen and Beer1995). Table I lists the elevations of all samples, which were interpolated from detailed topographic maps (Fig. 4). We believe that the elevation uncertainties for R8201, R8205, R8210, and R9201 are within about 10 m, but the elevation uncertainties for the other samples may be a little larger (about 10–20 m). The two slopes are smooth, with angles of ~4° from the horizon. The bedrock sampling depth was about 2 cm, and sites sheltered by erratic boulders were avoiding during sampling. Thus, shielding corrections were not considered in this work.
Field view of a. sample profile b in Mount Harding, and b. profile a in Zakharoff Ridge.

Sample positions in southern Mount Harding and Zakharoff Ridge, based on a topographic map made by Chinese Antarctic Center of Surveying and Mapping of Wuhan University, State Bureau of Surveying and Mapping of China, and Chinese Polar Research Administration.

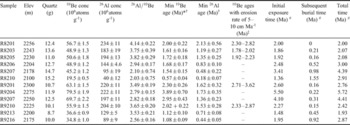
Elevations and exposure ages of the bedrock samples in the Grove Mountains, interior East Antarctica*

* The minimum 10Be and 26Al exposure ages are calculated by using scaling method for Antarctica from Lal (Reference Lal1991), modified by Stone (Reference Stone2000).
† The errors of minimum 10Be and 26Al exposure ages include 2% from AMS, 6% from production rate, 1% from Be carrier and 4% from ICP-AES for Al.
‡ 10Be exposure ages assuming erosion rates of 5–10 cm Ma-1 for samples with simple exposure history. To calculate the 10Be exposure ages with erosion, we use values of 2.7 g/cm3 and 150 g/cm2 for ρ and Λ, respectively.
# Assuming samples experienced initial exposure and subsequent burial just one time with no erosion, and neglecting the recent exposure. The possible initial exposure and subsequent burial time for samples with simple exposure history are also calculated as a test.
Methodology
Chemical preparations were carried out in the cosmogenic nuclide lab at the Institute of Geology and Geophysics, Chinese Academy of Sciences. Samples were first crushed to 0.1~1.0 mm size, after which, each sample underwent magnetic separation. Quartz samples were purified by leaching 4 or 5 times in a hot ultrasonic bath with a mixed solution of HF and HNO3 (Kohl & Nishiizumi Reference Kohl and Nishiizumi1992), and were completely dissolved together with ~0.5 mg 9Be carrier. Be and Al were separated by ion chromatography, and their hydroxides were precipitated, and then baked to oxides at 850°C. Procedure blanks were used to correct the measured values. Total Al concentrations in aliquots of the dissolved quartz were quantified by ICP-AES, and 10Be and 26Al concentrations were measured by the accelerator mass spectrometry (AMS) at the Australian Nuclear Science and Technology Organisation (ANSTO). Measured ratios of 10Be/9Be were normalized relative to the NIST standard-SRM4325 with a newly assigned ratio of 3.0200 × 10⁻¹¹ (for reasons see Fink et al. Reference Fink, Mckelvey, Hambrey, Fabel and Brown2006).
The minimum exposure ages shown in Table I are calculated using the scaling method of Lal (Reference Lal1991), modified by Stone (Reference Stone2000) for Antarctica. This study used production rates of 5.1 and 31.1 atoms g-1·yr for 10Be and 26Al, respectively, at sea level and high latitude in the calculation. In calculating the exposure ages with erosion or burial time, we have used the values of 2.7 g cm-3 and 150 g cm-2 for ρ and Λ, respectively.
Results
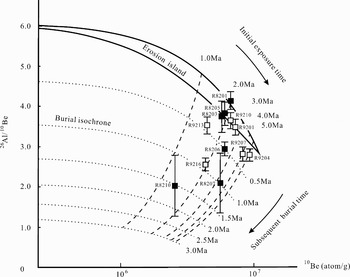
Table I shows both the measured values and calculated ages. Figure 5 plots the 26Al/10Be ratios vs 10Be concentrations normalized to sea level and high latitude for all samples. The results show a trend that the minimum exposure ages decrease with decreasing sample elevations in both of the two profiles.
Plot of 26Al/10Be vs 10Be concentrations. R8201, R8203, R8205, R9201, and R9210 are located within the erosion island suggesting simple exposure histories. R9204 and R9207 are outside of but near the erosion island. The obvious offsets of R8206, R8207, R8210, R9213 and R9216 indicate complex exposure histories of those samples. The initial exposure time and subsequent burial time for all samples can be estimated directly. 10Be concentrations have been normalized to sea level and high latitude according to scaling method of Lal (Reference Lal1991), modified by Stone (Reference Stone2000).

For the Zakharoff Ridge profile, sample R8201 (from the crest) has 10Be and 26Al minimum exposure ages of 2.00 ± 0.22 Ma and 2.13 ± 0.56 Ma, respectively. These are the oldest 10Be and 26Al minimum exposure ages in this profile. Samples R8203 and R8205 have younger minimum exposure ages of 1–2 Ma. R8201, R8203 and R8205 are all projected within the erosion island (see Fig. 5), which is usually considered to only have simple exposure histories because erosion occurred for bedrock samples. Yet short periods of burials of ~0.2 Ma since initial exposure may have occurred if no erosion is assumed (see Table I and Fig. 5). Our belief that they only have simple exposure histories is more probable because moraines, boulders, and ice striations are rather absent in the higher elevation areas. However, R8206, R8207 and R8210, which are taken from lower elevation areas, are projected outside of the erosion island and must have complex exposure histories (Fig. 5); i.e. they must have been shielded from cosmic rays after initial exposure.
The southern Mount Harding profile has a similar trend to the Zakharoff Ridge profile. The crest sample R9201 has 10Be and 26Al minimum exposure ages of 2.30 ± 0.26 Ma and 1.62 ± 0.32 Ma, respectively. Sample R9210 has 10Be and 26Al minimum exposure ages of 2.02 ± 0.22 Ma and 1.53 ± 0.28 Ma, respectively. Thus, their minimum exposure ages are similar to samples R8201, R8203 and R8205 in the Zakharoff Ridge profile, and they likely have simple exposure histories (Fig. 5). Samples R9204 and R9207 have 26Al minimum exposure ages of about 1–2 Ma, but their 10Be minimum exposure ages are 3.89 ± 0.70 Ma and 2.95 ± 0.43 Ma, ~1.5–2 Ma older than either the 26Al minimum exposure ages, or the 10Be minimum exposure ages of R9201 and R9210. Presently we still don't understand why they have such old 10Be ages. More measurements of stable cosmogenic nuclides in those samples may resolve the problem. Like samples R8206, R8207 and R8210, samples R9213 and R9216 have younger 10Be and 26Al minimum exposure ages, and lie outside of the erosion island (Fig. 5). Therefore, they have also experienced complex exposure histories.
Discussion
The minimum exposure ages shown in Table I are obtained by assuming no erosion. However, any erosion of the bedrock increases the actual exposure ages. Although we have no independent means by which to estimate an average erosion rate in the interior of East Antarctica, we can follow the procedure of other works to calculate exposure ages (Fink et al. Reference Fink, Mckelvey, Hambrey, Fabel and Brown2006). We can adopt a ‘reasonable’ erosion rate for the GM in order to test the ages of exposure calculated for those samples with simple exposure histories. Nishiizumi et al. (Reference Nishiizumi, Kohl, Arnold, Klein, Fink and Middleton1991) reported low erosion rates of 5–253 cm Ma-1 for samples from different parts of Antarctica, and most of those erosion rates were < 100 cm Ma-1. Ivy-Ochs et al. (Reference Ivy-Ochs, Schlüchter, Kubik, Dittrich-Hannen and Beer1995) reported erosion rates of between 5–30 cm Ma-1 in the McMurdo Dry Valleys, and gave a low erosion rate of ~5 cm Ma-1 in silicified sandstone. Calculated by the new scaling factors of Stone (Reference Stone2000) those erosion rates do not change significantly. Calculation from our crest samples R8201 and R9201 results in a maximum erosion rate of ~14–17 cm Ma-1. Because all our samples have silica surfaces, we choose a ‘reasonable’ erosion rate of 5–10 cm Ma-1 to calculate the exposure ages of samples that have simple exposure histories and obtained 10Be exposure ages of 2.30–2.82 Ma and 2.71–3.62 Ma for the two crest samples R8201 and R9201, respectively.
Considerable controversy about the EAIS behaviour during the Pliocene epoch has emerged amongst earth scientists (Miller & Mabin Reference Miller and Mabin1998, Haywood et al. Reference Haywood, Valdes, Sellwood and Kaplan2002). Much previous work supports major deglaciation during the Pliocene. Webb et al. (Reference Webb, Harwood, McKelvey, Mercer and Stott1984) reported the discovery of marine microfossil bearing clasts recycled into Sirius Group glacigenic sediments at various localities in the Transantarctic Mountains and suggested major fluctuations in the size of the EAIS during the Pliocene. Barrett et al. (Reference Barrett, Adams, Mcintosh, Swisher III and Wilson1992) reported K–Ar and 40Ar–39Ar ages of ~3 Ma for a volcanic ash bed in diatom bearing glaciomarine strata cored in Ferrar Fjord (East Antarctica), suggesting mid-Pliocene deglaciation. However, Andersson et al. (Reference Andersson, Warnke, Channell, Stoner and Jansen2002) compared mid-Pliocene (4.3–2.6 Ma) benthic stable oxygen and carbon isotope data from ODP Site 1092 (ODP Leg 177) drilled in the sub-Antarctic sector of the Southern Ocean with results from nearby Site 704 (ODP Leg 114) and inferred only minor deglaciation of East Antarctica during this period. Marchant et al. (Reference Marchant, Denton, Bockheim, Wilson and Kerr1994) found an in situ ash fall layer with underlying desert pavement in Arena Valley, southern Victoria Land. The age and the stratigraphic relationship indicate that a cold desert climate has persisted in Arena Valley during the past 4.3 million years. They suggested that the present EAIS has endured for this time and that average temperatures during the Pliocene in Arena Valley were no greater than 3°C above the present values. Old minimum exposure ages (>2 Ma) from the McMurdo Dry Valleys, Royal Society Range, Arena Valley, Dominion Range, northern Prince Charles Mountains, Vernier Valley and Shackleton Range suggest a stable EAIS for a long time, including the Pliocene (Marchant et al. Reference Marchant, Swisher III, Lux, West and Denton1993, Reference Marchant, Denton, Bockheim, Wilson and Kerr1994, Ivy-Ochs et al. Reference Ivy-Ochs, Schlüchter, Kubik, Dittrich-Hannen and Beer1995, Sugden et al. Reference Sugden, Summerfield, Denton, Wilch, McIntosh, Marchant and Rutford1999, Ackert & Kurz Reference Ackert and Kurz2004, Fogwill et al. Reference Fogwill, Bentley, Sugden, Kerr and Kubik2004, Fink et al. Reference Fink, Mckelvey, Hambrey, Fabel and Brown2006, Staiger et al. Reference Staiger, Marchant, Schaefer, Oberholzer, Johnson, Lewis and Swanger2006). Those ages are incompatible with the major mid-Pliocene deglaciation model.
Our results provide a good constraint on the history of the interior EAIS. The 10Be exposure ages with an erosion rate of 5–10 cm Ma-1 for samples R8201, R8203, R8205, R9201 and R9210 (Table I) represent a period of 1–2 Ma from mid-Pliocene to the Plio–Pleistocene boundary, thus we can conclude that the interior EAIS at the GM decreased by only about 100 m during this period. Those samples show no sign of being shielded by ice or other materials again after their initial exposures, which means the decrease of the interior EAIS was continuous for a period as long as 1–2 Ma.
For samples with complex exposure histories, the initial exposure time and subsequent burial time can be calculated using the methods of Bierman et al. (Reference Bierman, Marsella, Patterson, Davis and Caffee1999) and Granger & Muzikar (Reference Granger and Muzikar2001), or can be estimated directly using the plot of 26Al/10Be vs 10Be concentrations (Fig. 5). The total initial exposure and subsequent burial time of samples R8206, R8210, R9213 and R9216 range from 1.9 to 3.0 Ma (sample R8207 has an old calculated total time of 4.39 Ma, but has a large uncertainty). We found it difficult to reconstruct a simple and compatible exposure and burial history for all these samples based on their initial exposure and subsequent burial time. Considering the potential errors, the minimum total initial exposure and subsequent burial time for those five samples could be ~1.7–2.8 Ma (Fig. 5), which is much younger than mid-Pliocene, thus may not conflict with the stable mid-Pliocene EAIS scenario.
The association of lower sample elevations with the lower the 26Al/10Be ratios excludes the possibility of local cover by erratic boulders. Additionally, the morainal deposits are rather thin and scattered on the bedrocks of those areas, so the reasonable conclusion is that they were covered by the ice after its surface elevation increased again. Remarkably, the lowest samples with simple exposure histories in the two profiles (R8205 and R9210) have similar elevations of ~2230 m. The highest samples that were covered by the later ice surface elevation increase (R8206 and R9213) also have similar elevations. Their time of subsequent burial are quite similar, even though their initial exposure time differ (Fig. 5). A similar situation occurs for samples R8207 and R9216. They may be evidence that the ice surface was flat during the later ice surface elevation increase. The retention of low 26Al/10Be ratios for those samples with complex exposure histories indicates extraordinarily low local erosion rates during ice retreat, advance and the subsequent exposure, and thus long-term preservation of the sub-glacial landforms (Sugden et al. Reference Sugden, Balco, Cowdery, Stone and Sass2005).
It is believed that widespread continental glaciers developed in the Northern Hemisphere ~2.5 million years ago (Raymo Reference Raymo1994, Clark et al. Reference Clark, Alley and Pollard1999), and grew quite large in ~2.4 and ~2.0 Ma. In contrast, our results show the interior EAIS to have been relatively stable during the mid-Pliocene to the Plio–Pleistocene boundary.
The complex exposure histories of samples R8206, R8207, R8210, R9213 and R9216 suggest the interior EAIS fluctuated after the Pliocene. The maximum elevation of the ice sheet reached since Pliocene time can be estimated from the elevations of samples found to have simple and complex exposure histories based on concentrations of 26Al and 10Be. The ice sheet surface elevation must have increased at least one time resulting in the covering of sample R8206 (which is ~100 m above the present ice surface on the stoss side) and R9213, but not reaching the elevation of R8205 and R9210. Thus, the ice sheet could reach a level ~2200 m during the subsequent increase, ~100 m higher than the present ice surface but ~100 m lower than that during the mid to late Pliocene. The ice surface elevation decreased again (may have fluctuated), and finally settled near its present ice surface of ~2100 m. However, the minimum elevation of the ice surface of the interior EAIS after the Pliocene cannot be determined by this study, so deglaciation of the interior EAIS since Pliocene remains unclear.
Conclusions
Our 10Be and 26Al data indicate the fluctuation history of the interior EAIS at the GM. Minimum 10Be exposure ages of the crest samples (R8201 and R9201) from Zakharoff Ridge and southern Mount Harding are 2.00 ± 0.22 and 2.30 ± 0.26 Ma, respectively. The simple exposure histories of R8201 and R9201 suggest that they were exposed continuously above the ice sheet at least since the Plio–Pleistocene boundary. Adopting an erosion rate of 5–10 cm Ma-1, their exposure ages extend to the mid-Pliocene. The exposure ages, steadily decreasing with decreasing elevations in the two profiles, indicate ~200 m decrease of the interior East Antarctic Ice Sheet (EAIS) since mid-Pliocene. The 10Be exposure ages with an erosion rate of 5–10 cm Ma-1 for five samples with high elevations indicate that the interior EAIS in the GM decreased only about 100 m during a period about 1–2 Ma since mid-Pliocene, which provides strong evidence for a stable EAIS from the mid-Pliocene to the Plio–Pleistocene boundary.
Five samples, close to the present ice surface, have younger exposure ages and complex exposure histories. The complex exposure requires ~100 m increase of the ice surface elevation at least one time after the Pliocene. Thus, the present ice surface of the EAIS in the GM is only ~200 m lower than that during mid-Pliocene and near the Plio–Pleistocene boundary, and the maximum increase later of the EAIS was only 100 m higher than the present ice surface.
Acknowledgements
We are grateful to Jane Staiger and Chris Fogwill for useful comments on an earlier draft of the manuscript. Bill Isherwood reviewed the manuscript and made useful and constructive suggestions that led to important improvements in the paper. We thank the Chinese Polar Research Administration for field logistic supports during the 16th, 17th and 22th CHINARE. This work was supported by the National Science Fund of China (Grant Number 40506003 and 40631004).