(S)he was not hurting anybody, just running away.
S. Endo
INTRODUCTION
Because Central Banks have abandoned the control of monetary aggregates and implemented inflation targeting rules directly or indirectly by means of aggressive Taylor rules, forecasting inflation rates, both unconditionally or conditionally, has become crucial for both policy makers and private agents who try to understand and react to Central Banks decisions. Several methods have been proposed but the overall performance has been, at best, mixed: the information provided by past inflation appears to suffice and very few variables add marginal predictive content to univariate specifications [see, e.g., Cecchetti, Chu, and Steindel (2001)].
Traditional forecasting models of inflation are motivated by a standard Phillips curve trade-off. Blinder (1997) attributes the popularity of this specification to the stability of the relationship and its reliability as forecasting tool. Stock and Watson (1999) criticized this conventional wisdom, showing that in the United States, the parameters of a standard Phillips curve have changed over time; that other measures of real activity forecast inflation better than the unemployment rate, and that combining forecasts produced by different specifications improves the performance of a model which only uses the unemployment rate. Atkeson and Ohanian (2001) also criticize this view by showing that Phillips curve forecast of U.S. inflation over a 15-year period are no better than those obtained from a random walk model. The instability of the forecasting relationships is not limited to traditional Phillips curve based models but extends to other theoretical or ad hoc empirical models used in the literature [see, e.g., models that include asset prices, for example, Stock and Watson (2000), Goodhart and Hoffman (2000), Marcellino (2002)]. Although forecasting specifications built adding one indicator of real activity at the time work poorly and tend to be unstable, some improvements have been documented by Cristadoro et al. (Forthcoming), Wright (2003), Granger and Yeon (2004), and Inoue and Kilian (2003), using methods that combine information obtained from many predictors.
In this paper, we explore the interaction between predictability and instability by comparing the forecasting performance of some leading models for inflation in G-7 countries. To narrow down the scope of the comparison, we focus attention on four different but interrelated questions. First, we would like to investigate how models that rely on a Phillips curve or other theoretical relationships fare relative to univariate (a-theoretical) models. Our cross-country perspective here can help to shed light on whether U.S. results are unique or common to the most developed countries. Second, we are interested in knowing whether there is information in other domestic variables (which may or may not have theoretical underpinning) useful for forecasting inflation. Third, we would like to know whether models that allow for parameter drifts improve the performance of specifications which force coefficients to be constant over time. Finally, we want to study whether cross-country information helps in forecasting domestic inflation rates.
Our analysis concentrates on CPI inflation but the results are qualitatively similar to those obtained using GDP deflator inflation. We are concerned with three forecasting horizons that are of interest to policy makers: one quarter, one year, and two years. We calculate statistics measuring the average magnitude of the squared forecast errors and the ability to predict turning points of inflation. Our sample covers the period 1980:1–2000:4, and the last five years are typically used to evaluate the performance of various specifications. In all cases, models are estimated recursively and out-of-sample forecasts computed using the information available at each t.
We consider several models in our horse race. First, as a benchmark, we estimate ARIMA models, identified with a standard approach, and AR models, where the lag length optimizes the trade-off between the number of lags and the in-sample forecasting performance. To address the first question, we consider nine alternative bivariate AR specifications: two with a standard Phillips curve relationship (standardized unemployment rate and employment growth) and one with a New Keynesian version of it (labor income share), two with measures of real activity (output gap and GDP growth), two with monetary variables (nominal M2 growth and real M2 growth) and two with financial indicators (the slope of the nominal term structure and nominal stock returns). We find that theory-based bivariate models improve over univariate a-theoretical specifications at long but not at short horizons. Also, we find that the performance of these models is country dependent. Interestingly, a New Keynesian Phillips curve is never best in the race, whereas in France, Italy, and Germany, where a traditional Phillips curve is preferred, the MSE at the one-step horizon is broadly equivalent to the one of univariate specifications. As in Stock and Watson (1999), we find that conclusions concerning the relative ordering of bivariate models are tenuous: changing the forecasting sample at times alters the ranking of models and their MSE performance relative to univariate models. Finally, the collection of best bivariate models are roughly equivalent to univariate models in terms of turning point predictions at all horizons.
To examine the second question, we study the performance of trivariate unrestricted VAR (UVAR) and BVAR models. We find that the MSE of the forecasts can be reduced in some countries and at long horizons but that turning point recognition does not improve. Adding a Bayesian prior helps. However, on average, a BVAR is hardly better than an univariate AR model and a UVAR is actually worse.
To investigate whether the presence of parameter drifts improves the quality of the forecasts, we estimate univariate AR and BVAR models with time varying coefficients. The added flexibility, in general, reduces the MSE of the forecasts of univariate AR models and turning point recognition improves, primarily at the one quarter horizon. Adding time variation to the BVAR model, by contrast, systematically reduces the MSE of the forecasts only in two countries. Some improvements, on average, over the fixed coefficient model are noticeable at all horizons but no improvements over the TVC-AR model occur.
Finally, to evaluate whether international information is useful to forecast domestic inflation, we consider four specifications: one that uses as predetermined in country-specific BVAR variables capturing the state of the world economy (commodity prices, U.S. GDP growth, and the median stock return in the G-7); a BVAR model that includes the seven inflation rates and the same three predetermined variables considered in the previous model; a factor model along the lines of Stock and Watson (1999) and Cristadoro et al. (Forthcoming); and a version of the panel BVAR model studied by Canova and Ciccarelli (2002) and (2004), in which the vector of coefficients is moved by a restricted number of indices capturing common, country specific or variable specific effects. Except for the factor model, time variations are allowed in all setups. With the first specification, MSE improvements both over univariate models and domestic BVAR models are visible primarily at longer horizons and this improved performance is matched by more appropriate turning point detection. Interestingly, this model produces the best one quarter ahead forecast of U.S. inflation. The second specification is, on average, roughly equivalent in MSE to the first one. Also, the turning point recognition of this specification is reasonably good. The index model produces the best overall MSE of the forecasts at all horizons for Germany, France, and at two horizons for Italy, Japan, and Canada. MSE gains are pronounced and robust across forecasting samples: in fact, the forecasts produced by this model one and two years ahead track reasonably well actual inflation in the G-7, with no visible change in the performance across the two halves of the 1990s. The MSE superiority is matched by the record of turning point predictions, which is the best of all models. Comparing the outcomes of these three models with those of the factor model, one can conclude that cross-sectional information helps in forecasting, but it is only when it is used in conjunction with time variations in the coefficients that large improvements are obtained.
In summary, although forecasting inflation rates is difficult and the temptation to rely on naive models is widespread, shrewdly chosen models do improve over univariate ones. The forecasting performance of standard or modified Phillips curve models and of other small-scale fixed coefficients specifications that exploit only domestic interdependencies is far from appealing in the majority of the G-7 countries. However, multivariate models with time-varying coefficients and some international linkages improve on univariate ones, both with fixed and time-varying coefficients. Economically, this is reasonable: the inflation process displayed changes over the sample and there appears to be a common component in the international swings of inflation over time. Our results show that taking into account these two factors may turn around the standard bias-variance trade-off, which favors simple and parsimonious models in prediction.
The rest of the paper is organized as follows: the next section describes the specifications used and the data employed. Section 3 presents the statistics used. Section 4 examines the performance of the various specifications. Section 5 concludes.
THE SPECIFICATIONS
Our sample covers quarterly data from 1980:1 to 2000:4—1980 is chosen because comparable G-7 data is available only from this date on—and we use the last five years to evaluate the performance of various forecasting specifications. In some exercises, we use the 1980s to estimate various models and the sample 1991:1–1995:4 to evaluate the forecasting performance. When we use a data-based Bayesian prior, whatever information is available before 1980 was employed to estimate the hyperparameters of the prior. Details about the sources and the preliminary transformations are in Appendix A. All the comparisons are performed using out-of-sample predictions. That is, models are estimated recursively and forecasts computed at one, four, and eight quarters ahead using the information available at each t. Multistep forecasts are obtained directly fitting the models at the required horizon. This avoids the need to specify an auxiliary model for the exogenous variables, whenever they appear in the specification. All models include intercepts.
We collect two types of forecasting statistics, the MSE and the number of correct turning point signals. To avoid problems with the units of measurement of the variables in different models, we present Theil-U statistics (the ratio of the MSE of the model to the MSE of a no-change model), which immediately allows us to compare the performance relative to a random walk model. Results obtained using Mean Absolute Deviation (MAD) statistics are broadly similar and omitted for reason of space. Turning point predictions are calculated using a two quarters rule, as detailed in the next section. Complementing synthetic MSE measures with turning point detection is important because MSE reduction can be achieved by altering the timing and the direction of the forecasts. Therefore, an evaluation exercise based on both provides a more complete picture of the properties of various specifications.
Univariate Models
We consider two univariate specifications: ARIMA and AR models. For the first type of models the specification is identified using plots of autocorrelation and the partial autocorrelation functions. For AR models, the lag length is selected using the Schwarz criteria (SIC), which trades off the increase in the explanatory power obtained with additional lags with a penalty on the dimensionality of the model. The results we present are roughly insensitive to the criterion employed. Had we used Hannan and Quinn criteria, the ranking presented here would have been unchanged.
Bivariate Models
We considered nine bivariate models. Together with inflation we use unemployment, employment growth, the labor income share, output gap, output growth, money growth, real money growth, and the slope of the term structure or stock returns. This choice of variables is motivated by straightforward theoretical arguments. The first five specifications embody notions of traditional and New Keynesian Phillips curve [see Gali and Gertler (1999), Mankiw (2001)]. (Real) Money growth has been selected since inflation in the long run must be a monetary phenomena; the slope of the term structure is selected following work by Plosser and Rowenshort (1994) and the notion that monetary shocks are typically transmitted to the real economy via changes in the slope of the term structure at different horizons [see, e.g., Evans and Marshall (1998)]. Nominal stock returns are used since they are considered a good hedge against inflation [see Fama (1970)]. For all bivariate models, the lag length is chosen using the Schwarz criteria.
Unrestricted VARs (UVAR)
The UVAR models we consider include domestic variables only. We search for the best specification using GDP (growth and gap), stock returns, the slope of the term structure, wage and rent inflation, real and nominal exchange rate, unit labor costs inflation (when available), capacity utilization, unemployment rate and employment (rate and level) and the labor force as possible predictors. The search is limited to these variables because they are the only ones available on a consistent basis across the G-7. To avoid excessive data mining and large specifications, we restricted attention to three variable models and choose among all possible combinations the two variables that give the smallest MSE for inflation in each country over the estimation sample. The chosen variables differ across countries: for the United States, the trivariate model includes inflation, the output gap, and the labor force; for Japan, inflation, the output gap, and the real exchange rate; for Germany, inflation, employment growth, and unit labor costs; for the United Kingdom, inflation, stock returns, and unit labor costs; for France, inflation, rent, and wage inflation; for Italy, inflation, the unemployment rate, and rent inflation; for Canada, inflation, the output gap, and stock returns. The heterogeneity is more apparent than practical because many variables have similar predictive power. The lag length of the model in each country is selected using the Schwarz criteria.
Bayesian VARs (BVAR)
The Bayesian VAR (BVAR) models used here are standard and, at this stage, we keep the prior specification very simple. Because we are interested in relative comparisons, the variables for each country are the same used in the UVAR. The model is:


where Yt=[yt−j, yt−j−1, …, yt−j−p], j=1, 4, 8,
, et∼(0, Σe) and ut∼(0, Σu). (2) describes the prior of the model. We follow the standard specification of the so-called Minnesota Prior and set D0=0, except on the first lag of the dependent variable in each equation and use one parameter θ1 to trade off the forecasting information in the mean of the first lag. The structure of Σu is standard: one parameter controls the general tightness of the specification (θ2), one the decay of the prior variance as the lag length increases (θ3), and one weights the relative contribution of lags of other variables in each equation (θ4). The prior for Ct is noninformative (θ5=1000). Estimates of the four parameters can obtained informally, using a rough specification search over a grid of values, or formally, maximizing the predictive density of the model in an Empirical Bayes fashion. Here we use the second approach and we revert to informal searches whenever the maximization algorithm failed to converge. Estimates of the hyperparameter vector are similar but not identical across countries (see Table 1).

Time Varying Coefficient Models (TVC)
We consider two TVC models: a BAR and a BVAR. Because their specification is similar, we describe them in one single framework. The models have the structure:


where P is a matrix, I the identity matrix, yt is a scalar in the univariate model and it is a 3×1 vector in the BVAR, and all the other variables have been previous defined. The major difference between (2) and (4) is that Dt is allowed to evolve over time in a geometric fashion and that the variance of ut (denoted by Σut) is also allowed to vary over time.
We parametrize these two additional features as follows: we let P=θ6*I with θ6<1 and set Σut=θ7*Σu0, where Σu0 has the same structure as Σu described in the previous subsection (for univariate models, the parameter controlling the importance of lag of other variables θ4 is set to 1). Here θ7 controls how much time variation there is in the evolution of the law of motion of the coefficients and θ6 the extent of the mean reversion of the coefficient vector. Clearly, if θ6=1 and θ7=0, no time variation in the coefficients is necessary. We experimented with a different structure for D0, along the lines of Canova (1993b) to take into account of predictability over the calendar year. That is, the prior mean of lag j=1, 4, 8 of the dependent variable is θ1 and the prior mean of lag j−4 is 1−θ1. Estimates of the vector Θ are obtained by maximizing the predictive density and when the maximization algorithm failed to convergence the analysis is supplemented with a rough grid search. As with BVARs, the final specifications are similar although not identical across countries. Hyperparameter estimates for the models are shown in Table 1.
International Models
We consider different specifications in this class of models. The first one adds as predetermined to the previous BVAR models (with or without time varying coefficients, whichever is the best) variables controlling for demand and supply pressures in international markets. The variables we use are: a commodity price index, U.S. GDP growth, and the median stock returns across the G-7, and they enter the specification in all countries with one lag. The prior for the coefficients on these variables has a zero mean and variance regulated by the hyperparameter θ5.
The second specification is a BVAR with the G-7 inflation rates augmented with the same international factors used in the previous specification. The prior depends on the same seven hyperparameters we have used in the previous setup and estimates are reported in Table 1.
Because these two specifications take a rough short cut to the problem of specifying interdependencies that may leave out important aspects of the international transmission, the third specification explicitly models these features. The model is:

where i=1, …, N; t=1, …, T; yit is a G×1 vector for each country i,
,
are G×GN matrices, Cit is G×1, and eit is a G×1 vector of random disturbances. Here we have p lags for the NG endogenous variables and interdependencies among units are allowed whenever
for h≠i and for any r. This generalization is not without costs: the number of parameters is greatly increased (we have now k=NGp+1 parameters each equation); furthermore, the G variables entering the VAR must be the same for each unit.
Canova and Ciccarelli (2004) showed that cross-country interdependencies are important in predicting output growth across countries. To reduce the dimensionality of the Parameter vector, they assumed a two components hierarchical structure: the coefficients have a time-invariant component, which randomly varies over the cross-section, and a time-varying one, which drifts over time as in equation (4). In that specification the dimensionality of the time-varying component may still be large. To circumvent this problem, Canova and Ciccarelli (2002) use an index structure. To adapt their structure to the present context, rewrite equation (5) as:

where
,
. Here
are k×1 vectors containing, stacked, the g rows of the matrices Bit and Cit, whereas Yt and Et are NG×1 vectors containing the endogenous variables and the disturbances of the model.
If δit varies with cross-sectional units in different time periods, it is impossible to obtain meaningful estimates using classical methods. Here, we view each coefficient as random (as we have done with TVC models) and assume that:

where Ξ1 is a N·G·k×N matrix of ones and zeros, Ξ2 is a N·G·k×1 vector of ones, and Ξ3 is a N·G·k×G matrix of zeros and ones. Let θt=(αt, λt, ρt) and rewrite (7) as δt=Ξθt+ut where Ξ=[Ξ1, Ξ2, Ξ3]. We further assume
- Conditional on Mt, Et has a normal distribution with covariance ΣE=Σ[otimes ]H, where Σ is N×N and H is G×G, both positive definite and symmetric matrices.
- The NGk×1 vector ut is normally distributed with covariance ΣE[otimes ]V, where V is a k×k matrix of the form V=σ2Ik.
- θt has a structure of the form:

where
is a full-rank known matrix and

where
,
, and γ1, γ2 are known. ut, ηt, Et are mutually independent.
Using (5) into (6) we can write the model as:

where At=MtΞ1, Wt=MtΞ2 and Zt=MtΞ3.
In equation (10) the NG×1 vector Yt depends on a N×1 vector of unit specific coefficients αt, a common coefficient λt and a G×1 vector of variable specific coefficients ρt (for a total of N+G+1 as opposed to the original NGk coefficients). Additional indices relating, for example, to the lags, or combination of all the previous ones (e.g. country-variable, country-lag, etc.) can be similarly added. Because the regressors in equation (10) are particular combinations of the lags of the VAR variables, the coefficients λt, αt, ρt can be interpreted as “factor loadings” and measure the impact that different linear combinations of the lags of the right hand side variables have on the current endogenous variables. Hence, we have reparametrized the panel VAR model to have a hierarchical structure composed of (10)–(8)–(9), which is convenient to estimate.
Posterior estimates for θt can be obtained using Monte Carlo Markov Chain methods after appropriate prior distributions for
are selected. The Gibbs sampler is particularly useful in our case because a vector of conditional posteriors can be easily obtained. Details on the algorithm are shown in Appendix B.
Stock and Watson (2002), Cristadoro et al. (Forthcoming), and others have examined panel models where either N or G or both are large. Their approach is to set up the problem so that it can be handled in the context of (dynamic) factor models with classical methods. Three features differentiate our approach from their: first, indices are a priori determined by the interest of the researcher through a hierarchical prior. Second, the coefficients on our indices are allowed to vary over time. Third, posterior distributions are exact even in small samples, whereas their approach requires N or G to be large for estimates to be meaningful.
Although the first difference is probably minor, the second could be important in forecasting inflation and the third relevant when, as it is the case here, both N and G are small. To assess the importance of these two features, we also considered a factor model where the seven inflation rates are regressed on the lags of a (subset) of the static factors obtained from the same variables used in the panel VAR. We use Bai and Ng's (2002) ICp1 criteria to select the number of factors and, conditional on the results, the SIC criteria is used to select the lag length of the regressions.
THE FORECASTING STATISTICS
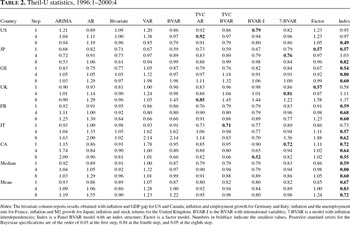
To compare the performance of the various specifications and the improvements obtained by the addition of each feature, we report a linear statistic (Theil-U statistics at one, four, and eight quarters ahead, or ratio of MSE of the model to the best univariate model at these three horizons) (Table 2) and a nonlinear one (turning point predictions). In comparing Bayesian models, we supplement the analysis by computing predictive Bayes factors, that is, we compute
, where
, where
is model i=1, 2 and Di its parameters, numerically drawing Di from the posterior
and averaging over draws.
Turning point predictions can be computed from the predictive density of future observations. We define turning points as follows:
DEFINITION 3.1 A downward turn for unit i at time t+h+1 occurs if
the reference variable, satisfies for all h
. An upward turn for unit i at time t+h+1 occurs if the reference variable satisfies
.
Similarly, we define a nondownward turn and a nonupward turn:
DEFINITION 3.2 A nondownward turn for unit i at time t+h+1 occurs if
satisfies for all h
. A nonupward turn for unit i at time t+h+1 occurs if
satisfies
.
Although there are other definitions in the literature [see, e.g., Lahiri and Moore (1991)] this is the most used one and suffices for our purposes. Let
be the marginal predictive density for the variables of unit i after integrating the remaining variables and let
be the marginal predictive density for inflation, which we order first in the list for unit i.
We compute turning point predictions one, four, and eight quarters ahead, using the information available at each t. Then, given the marginal predictive density
, the probability of a downturn in unit i is

and the probability of an upturn is

Using a numerical sample from the predictive density satisfying
, we can approximate these probabilities using the frequencies of realizations which are less then or greater then
. With a symmetric loss function, minimization of the expected loss leads us to predict the occurrence of turning point at t+1 if PDt>0.5 or PUt>0.5.
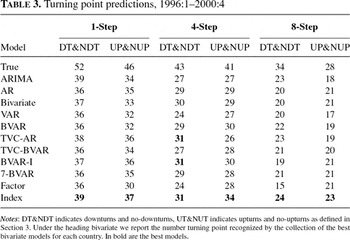
Because some methods are univariate and other multivariate, a comparison country by country may be inadequate. Therefore, we report turning point predictions for the seven countries as a whole in each procedure. That is, for the 20 periods in the forecasting sample, we compute forecasts and check whether at each date they satisfy the required condition for each country. Table 3 reports the number of correct signals found.
THE RESULTS
In the working paper version [Canova (2002)] we described in details the features of the distribution, the autocorrelation and the cross correlation function of inflation in various countries. To summarize, there are instabilities in all the statistics we collect when comparing the estimation sample (1980–1995) and the forecasting sample (1996–2000). The largest differences appear to be in the autocorrelation function of inflation and in the cross-correlation function of inflation rates across countries. Although these differences may be a result of the smaller size of the latter sample, they are suggestive of the difficulties that models may face in forecasting inflation rates over time.
AR models improve the MSE of the naive no-change model in six of the seven countries at the shortest horizon but appear to be consistently superior to a random walk only for Canada, where the gains are, on average, about 10%. Bootstrapping the forecasting residuals, 1000 times, we find that the probability that the Theil-U at the one-step horizon is greater or equal to one is negligible for all countries but Italy.1
To conduct the bootstrap exercise we have tested for serial correlation and heteroscedasticity in the residuals of the AR model for each country using standard Q and Breusch and Pagan tests. If the null was rejected, residuals were prewhitened and scaled before the bootstrap was performed.
Despite these shortcoming, both models are surprisingly accurate in predicting turning points. On average about two-thirds of the turning points are recognized: the ARIMA model is somewhat better at one step and the AR model more accurate at the four-step horizon. At the eight-step horizon, the two models have similar performance.
Can Theory-Based Models Improve Atheoretical Ones?
The answer is “it depends.” There are countries where theory-based bivariate models improve the MSE of univariate specifications and countries where the opposite is true. Furthermore, situations where bivariate models are worse than the naive no-change model are also present. For example, in the United Kingdom (Japan) at the one-step horizon, six (four) of the nine bivariate models improve in MSE sense univariate models, whereas for the United States none of the bivariate models beats a AR model or a no-change model. Results also depend on the horizon. The best bivariate U.K. model produces a MSE, which is 10% lower at the one- and four-step horizons but higher then the one of an ARIMA model at the eight step horizon. By contrast, in Italy, France, and Canada the best bivariate model is superior to the best univariate specification at long horizons by more than 10%. On average or in the median, the outcomes confirm to be far from uniform and only at longer horizons the performance of bivariate models becomes more encouraging.
The collection of the best bivariate models is roughly equivalent to AR models in terms of turning point recognition at all horizons. Because these results are obtained employing the best specification in each country, it should be clear that using the same specification for all countries would do no better.
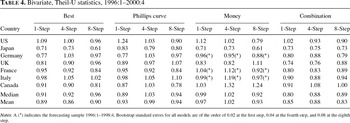
Because there is evidence that forecast combinations are preferable to single model forecasts [see Granger and Yeon (2004), Stock and Watson (2002), Wright (2003)], we also computed the MSE produced by equally weighting the output of the nine bivariate models. As Table 4 indicates, it is possible to improve over individual models in certain countries and at certain horizons. Nevertheless, it is remarkable that a random walk is still best in the United States at the one-quarter horizon.
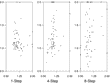
Stock and Watson (1999) argued that when a bivariate model has an edge over other specifications in a sample, it typically performs poorly in others, suggesting that forecasting relationships are tenuous. This lack of robustness is partially confirmed here. In Figure 1, we plot the MSE of each model relative to the MSE of the best univariate model for each of the three horizons. On the vertical axis we report the relative MSE obtained when data up to 1995 is used to estimate the models and data from 1996 used to forecast. On the horizontal axis, we plot the relative MSE obtained when data up to 1990 is used to estimate the models and data from 1991 to 1995 is used to forecast. If the forecasting performance is robust the points should line up, approximately, on the 45 degree line. All other configurations indicate tenuous forecasting power. Although there are instances where relative MSEs line up approximately on the 45 degree line (in particular for Italy or Canada) instabilities in the relative MSE ordering are present at all horizons and few cases in which the “last-will-be-the-first” exist, primarily at long horizons.

Relative MSE: bivariate vs univariate model. Vertical axis 1996–2000, horizontal axis 1990–1995.
Are Phillips curves useful for forecasting inflation? The evidence is mixed. Among the models we tried, we found that a specification loosely based on a traditional Phillips curve is preferred in MSE at the one-quarter horizon in France, Germany, and Italy, whereas in Canada and the United States pairing the output gap with inflation gives the best results. In the United Kingdom, traditional Phillips curves are systematically inferior to models that use financial market indicators to forecast inflation. This outcome is roughly independent of the forecasting sample and of the horizon except in the United States, where a model that uses the slope of the term structure dominates in the 1990–1995 sample. Table 4 confirms the results of Atkeson and Ohanian (2001): Phillips curve models do not have an hedge over univariate models in forecasting inflation in the US in the short run. However, in the other G-7 countries, some gains are present.
Fuhrer and Moore (1995) indicated that the New Keynesian Phillips curve has a hard time to account for the in-sample dynamics of inflation. Gali and Gertler (1999) breathed new life into the specification by pointing out that the theory implies a relationship between real marginal cost and inflation. Using ancillary assumptions to proxy for unobservable marginal costs, they concluded that inflation dynamics in the United States are well approximated by a model with sticky prices (à la Calvo) with a five quarters average period between price changes. Do real marginal costs help in forecasting inflation? The answer is negative. Using the income labor share (as in Gali and Gertler) to proxy for these costs we find that in only three countries such a bivariate model improves over univariate specifications, but it no case it is the preferred specification. Apparently, the predictive power of real marginal costs is negligible once lags of inflation are included.
Is money a leading indicator for inflation? Only in Japan do money growth measures turn out to be the most useful variable to predict inflation when lags of inflation are included in the specification. As a matter of fact, A bivariate model with money growth is worse than Phillips curve models in four countries at the one-step horizon. At the longer horizons, specifications that use money growth or real balances growth are competitive with the best model in three countries (see Table 4).
Three conclusions can be drawn. First, theoretically based bivariate models improve over atheoretical univariate ones, both in terms of MSE and turning point recognition only at long horizons. Consistent with the works of Cecchetti et al. (2001) and Benerje et al. (2003), we find that superiority of one specification depends on sample and the horizon. Phillips curve relationships (both traditional and New Keynesian types) are relatively stable in the 1990s but not very useful to forecast inflation in the G-7. Second, money has forecasting information for inflation primarily at long horizons. However, even at these horizons there are real or financial indicators that are as good as money. Third, there is no bivariate specification that is useful to forecast inflation in all G-7 countries and is consistently superior in both samples considered.
Is There Information in Other Domestic Variables?
Having examined the ability of variables typically suggested by theory, we have conducted a search over the variables listed in Section 2.3, whose relationship with inflation has not been necessarily highlighted by any theory, to examine whether the forecasting performance of univariate models can be improved upon. The search was marginally successful: as shown in Table 2, in France the performance of univariate models can be significantly improved at all horizons, whereas in the United States MSE improvements are visible at some horizon. These tendencies are not general: in fact, both median and mean measures are worse than those obtained with univariate models at all horizons. A weakly restricted BVAR is generically superior to an unrestricted VAR, and it is at short horizons that the prior helps most (the exception is France). Interestingly, a BVAR model is best among all the models so far considered at all horizons in the United States. However, the record of turning point recognition of both the UVAR and the BVAR model is unimpressive.

In sum, the addition of variables to univariate/bivariate specifications reduces the mean square error in a few instances but in others it introduces noise that increases the variability of the forecasts and clouds the ability of the model to track the actual path of inflation. Statistically, searching for good predictors of inflation is a worthwhile exercise when relationships are stable and the informational content of predictors robust. However, given the instabilities present in the inflation series, atheoretical models that are flexible and adapt quickly to a changing environment, may be more efficient forecasting tools than either theory-based or statistically based fixed coefficient specifications.
Does Time Variation in the Coefficients Help?
The instabilities present in the distribution, autocorrelation, and cross-correlation properties of inflation suggest that there are potential gains from using time-varying coefficient models. The question of interest is whether these gains are quantitatively important. Tables 2 and 3 indicate that for the AR model, MSE improvements are sizable but not necessarily uniform in magnitude across countries or horizons. For example, a TVC-AR model produces better MSE than a fixed coefficient AR model for Italy at all three horizons, whereas for Canada improvements are marginal. Also, although on average, or in the median, a TVC-AR model is better in MSE terms than a fixed coefficient AR model, the record of turning point predictions is similar, except at the one-step horizon.


The picture is different for BVARs. In fact, for four countries, the optimal amount of time variations is zero, whereas in the others improvements are visible only at certain horizons. Time variations reduce mean and median Theil's U relative to a basic BVAR, but at all horizons the performance of a TVC-BVAR is similar to the one of a TVC-AR model. Italy is the only country where major MSE improvements are noticeable. In fact, the Theil's U at the two-year horizon is about half of the one of univariate AR or ARIMA models and 15% smaller than the one of a random walk. Time variations appear to produce important improvements in terms of predictive densities. In fact, the predictive Bayes factor is 1.12 when we compare a TVC-BVAR to a fixed coefficient UVAR and 1.23 when we compare to a TVC-AR to a fixed coefficient AR. However, they not help in turning points detection: the TVC-BVAR model recognizes roughly the same number of turning points as a fixed coefficient BVAR, and it is inferior to a TVC-AR model at all three horizons.
Why is it that time variations help more in univariate than in multivariate models? We have already mentioned that the auto- and cross-correlation function of inflation with other domestic macrovariables is unstable over the sample. Our results indicate that modeling time variations in the parameters describing the autoregressive structure produces larger gains than modeling time variations in domestic cross-variable relationships.
One should stress that the amount of time variation our procedure selects is small and only for the United Kingdom does the best univariate model require significant variations in the coefficients. These results should be compared with those of Stock and Watson (1996), who found that time variation does not help in forecasting a multitude of U.S. time-series. Two important points need to be made. First, if there are long cycles in the data, what shows up as time variation in a sample of 20 years could be captured with mean reversion over longer periods of time. Second, because small deviations in value chosen produce dramatic changes in the forecasting performances of both models, unless time variation is optimally chosen, forecasting gains may fail to materialize.
We also have studied whether general time variation patterns, where the variance of the coefficients is also allowed to evolve, help in forecasting. Because there are countries where inflation displays leptokurtic behavior and volatility clustering appears to be pervasive, modeling heteroscedasticity has the potential to improve the forecasting performance in some of the countries. It turns out that this is not the case: the MSEs of models where parameters regulating heteroscedasticity in the coefficients are chosen to maximize the predictive density are practically identical to those reported in Table 1. In fact, the estimated parameters imply that homoscedasticity is nearly optimal in six countries. Moreover, turning point detection is largely unchanged.
To conclude, despite the evident structural changes in the process for inflation, the contribution of time variations in the coefficients to the forecasting performance of multivariate models is limited. Consistent with the results of Marcellino (2002), however, some gains are noticeable with univariate models, primarily at longer horizons.
Is There Information in the Cross-Section?
Historically, inflation rates significantly comoved across G-7 countries. This was true of the high inflation decade of the 1970s, of the subsequent deflationary period of the 1980s, and of the more stable period with declining trends experienced since the beginning of the 1990s. Hence, whatever helped, say, to forecast inflation in the United Kingdom should, in principle, have helped to forecast inflation also in France. This commonality seemed to have changed in the late 1990s and, except in a few cases, movements in inflation rates appear to be driven by idiosyncratic and national factors. Hence, although there seems to be room to improve the in-sample performance by adding international variables to domestic specifications, it is open to question whether cross-country information will help in forecasting out-of-sample.
As mentioned, the first two specifications come short of fully modeling interdependencies across countries and variables. The first specification, which treats international factors as predetermined in each of the seven domestic specification, represents a rough short cut in two ways: first, it assumes that cross-sectional information can be summarized with a small number of observable variables. Second, it assumes that each G-7 country can be modeled as a small open economy, which takes international information as independent of the domestic one, an assumption that has somewhat less appealing content. In the second specification the seven inflation rates are directly interrelated but only a small number of (hopefully common) factors captures the main features of domestic interdependencies.
Ideally, one would like to estimate a model were both national and international interdependencies are fully accounted for. However, there are computation costs; degrees of freedom limitations are important, and substantial noise may be added to the equations with no clear forecasting gains. Also, a panel VAR requires that the same variables are used in each country. Hence, unless the dimensionality of the model is large, it maybe impossible to accommodate the idiosyncrasies of the national inflation rates. The panel index model allows, in principle, for a rich set of interdependencies across variables in all country, but a priori collapses complicated feedbacks into a index structure with time-varying coefficients. The index structure averages out noise; limits the dimensionality of the parameter vector; and allows the estimation of a large-scale model. However, it is worth stressing that the index structure forces substantial similarities across countries and may be suboptimal when significant heterogeneities are present.
The first specification (BVAR-I in the tables) produces interesting results. For example, in the United States the model produces the lowest MSE at one quarter horizon of all specifications: the addition of international variables reduces the MSE of a domestic model by about 10% at this horizon. Gains are also evident on average and in the median at longer horizons. The fact that international information helps in medium-run forecasts of inflation is not surprising: whereas short-term inflation movements are generally dominated by national factors, it is international conditions that play the largest role in determining inflation dynamics in the medium run. Adding international factors is important also in turning point detection: the BVAR-I model produces an improved record of turning point recognition relative to previous VAR models.
The performance of the second specification (7-BVAR in the tables) is equally interesting. The model produced the smallest MSE at the four-quarter horizon for Japan and the United Kingdom and, excluding Italy, the MSE at longer horizon is at least as good as the one of a BVAR-I model. Note also that the largest gain appear for the United Kingdom and Canada at the one-quarter horizon. Because these are two small open economies with similar trade links, it is comforting to find that a model where inflation interdependencies are fully modeled is appropriate. This model also improves over domestic BVAR models at long horizons and it is roughly equivalent in turning point recognition to a BVAR model with carefully selected international links.
The performance of panel-index specification is encouraging. For France and Germany, substantial MSE improvements are evident at all horizons and MSE reductions of 10% are common. Major improvements also obtain for Japan, Italy, and Canada at two of the three horizons, whereas for the United States the MSE at the eight-quarter horizon is about 40% smaller than the one obtained with other specifications. The United Kingdom is the only country where the performance of the model is unsatisfactory. Apparently, although there are forecasting gains for European countries when one averages the information contained in lagged G-7 variables [as in Benerjee et al. (2003)], little improvements are recorded in the United Kingdom, where the evolution of inflation has important idiosyncratic components.
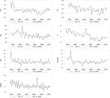
Roughly speaking, the cross-section provides information for forecasting medium-run trends of inflation: in fact, there are countries where the MSE at the eight-quarter horizon is lower than the MSE at the one-quarter horizon. These improvements are reflected in more accurate turning point predictions. In fact, this model has the best record of turning point predictions at all horizons. Figure 2 suggests that this occurs because the model tracks well the timing and, in several cases, also the magnitude of the peaks and throughs of actual inflation in all countries but the United Kingdom.

Four quarters ahead inflation forecasts, panel VAR index model.
Because both a model with time-varying coefficients but without interdependencies and a model with interdependencies and without time variations are nested in our specification, we can easily evaluate which of the two features help most. The predictive Bayes factors of the two restricted models are 0.88 and 0.90, respectively, suggesting that it is the combination of these two features that improves inflation forecasts across countries.
This conclusion is confirmed by comparing the performance of the factor model and of other international models. The factor model, which only exploits cross-sectional information, is somewhat inferior on average and in median MSE not only to the panel-index model (at all three horizons) but also to the BVAR-I and 7-BVAR models and to a domestic TVC-BVAR model. The record of turning point predictions is reasonable but still substantially inferior to the one of the other four models, which also allow for time variations in the coefficients.
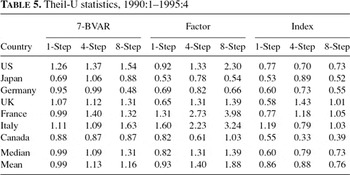
Figure 2 also indicates that the performance of the index model is robust to changes in the forecasting sample and its ability to track inflation in the G-7 is similar in the first and second half of the 1990s. This is not necessarily the case for other models of this class. For example, had we used the first part of the 1990s to forecast, the MSE of the BVAR-I would have been worse in some cases by up to 10–15%. Table 5 elaborates on the issue of robustness by presenting the Theil-Us for the 7-BVAR, for the factor, and the index model over the 1990–1995 sample. It is clear that, on average, cross-sectional information is more important than time variations in forecasting inflation over this sample. Moreover, taking a short cut to model interdependencies does not imply robust forecasting performance. Consistent with the visual impression of Figure 2, the panel-index model maintains superiority at all horizons also in this sample.

To summarize, adding international interdependencies to domestic models helps to forecast national inflation rates, primarily at longer horizons. However, the largest gains are obtained interacting time variations with cross-sectional information. With such a specification, inflation forecasts appear to be good and sufficiently robust throughout the 1990s.
CONCLUSIONS
This paper addressed four interrelated questions. First, we studied how models that loosely rely on the existence of a Phillips curve or other theoretical relationships fare relative to univariate (a-theoretical) models in the G-7. Second, we investigated whether there is information in other domestic variables (which may or may not have theoretical underpinning) useful for predicting inflation. Third, we examined whether drifts in the parameters improve the forecasting performance. Finally, we evaluated whether cross-country information helps to forecast domestic inflation.We show that theory-based bivariate models improve over univariate a-theoretical specifications at long but not at short horizons and that the performance depends on the country. We also show that, among bivariate specifications, Phillips curve models do not necessarily have an edge. In fact, a New Keynesian Phillips curve is never best in the race, whereas in France, Italy, and Germany, where a traditional Phillips curve is preferred, the MSE at the one-step horizon is broadly equivalent to one of univariate specifications. As in Stock and Watson (1999), we find that conclusions concerning the relative ordering of bivariate models are tenuous: changing the forecasting sample at times alters the ranking of models and their MSE performance relative to univariate ones. Finally, the collection of best bivariate models are roughly equivalent to univariate models in terms of turning point predictions at all horizons.
Trivariate UVAR and BVAR models improve over univariate or bivariate specifications in some countries and at some horizon but turning point recognition does not improve. Adding a Bayesian prior helps. However, on average, a BVAR is hardly better than an univariate AR model and a UVAR is actually worse.
The added flexibility of time variations in the coefficients helps to reduce the MSE of the forecasts of univariate AR models and turning point recognition improves, primarily at the one-quarter horizon. Adding time variation to the BVAR model systematically reduces the MSE of the forecasts only in two countries. Some improvements, on average, are noticeable at all horizons, but a TVC-BVAR model is hardly better than a univariate TVC-AR model.
Adding international variables makes some difference. With the simplest specification, the MSE improvements are visible, both over univariate models and domestic BVAR models, primarily at longer horizons. This improved performance is also matched by more appropriate turning point detection. The second specification is roughly equivalent in MSE, on average, to the first one but differences across countries are present. Also, the turning point recognition performance of this specification is reasonably good. The index model produces the best overall MSE of the forecasts at all horizons for Germany, France, and improvements are visible at two horizons in Italy, Canada, and Japan. MSE gains are pronounced and robust across samples: in fact, the forecasts produced by this model one and two years ahead track reasonably well actual inflation in the G-7, with no visible change in the performance across the two halves of the 1990s. The MSE superiority is also matched by the record of turning point predictions, which is the best of all. We show that having only time variations or cross-country information does not produce either systematic or robust gains. In fact, it is only when cross-sectional information is used in conjunction with time variations in the coefficients that large and stable forecast improvements are obtained.
In conclusion, although forecasting inflation rates is difficult and the temptation to rely on naive models is widespread, shrewdly chosen models do improve over univariate ones. The forecasting performance of standard or modified Phillips curve models and of other small-scale fixed coefficients specifications, which exploit only domestic interdependencies, is not very appealing in the majority of the G-7 countries. However, multivariate models with time-varying coefficients and some international linkages improve on univariate models both with fixed and time-varying coefficients. Economically, this is reasonable: the inflation process displayed changes over the sample and there appears to be a common component in the international swings of inflation over time. Our results show that taking into account these two factors may turn around the standard bias-variance trade-off that favors simple and parsimonious models in prediction. Models with these features are useful because they provide information about the time varying (local) trends present in almost all G-7 countries. Although this conclusion is naturally tentative, models with time variations and interdependencies are potentially of great use in tracking time-series featuring varying local trends and unstable relationships with the rest of the economy and, for this reason, they should be attractive to practitioners who are engaged in both unconditional and conditional prediction activities.
The results we obtained should do not suggest that economic theory should be dispensed of when forecasting. What we showed is that some theories that rely on a time invariant and a closed economy point of view are inadequate to capture the dynamics of inflation. Theories that make inflation dynamics functions of economic and policy conditions and consider interdependent economies could, in principle account for the results we obtain.
It is also important to stress that our effort complements those of Cristadoro et al. (Forthcoming), Wright (2003), Granger and Yeon (2003), and Inoue and Kilian (2004) who have emphasized that methods that combine the information coming from many predictors are typically superior in forecasting inflation than models which employ single predictors. This paper enriches this literature by showing that there are gains to be made by combining cross-country information with time varying coefficients. Clearly, one would like to know more about the properties of models with time-varying coefficients and cross-country interdependencies. In particular, one would like to know how they perform when the DGP displays breaks in the intercept or Markov switching patterns and what kind on international correlations are needed to obtain measurable gains from flexibly modelling cross countries interdependencies. Furthermore, a thorough comparison among different ways to pool cross-sectional/country information may indicate whether one method is preferable to all the others. We leave all these investigations for future research.
Although this paper has concentrated on the problem of forecasting inflation rates unconditionally, it also may be interesting from the policymakers point of view to conduct conditional type of forecasts. The machinery developed by Waggoner and Zha (1999) makes this task feasible even in the hierarchical panel BVAR models we consider.
APPENDIX A: THE DATA
The data used comes from the OECD database. Inflation rates are calculated annualizing quarterly rate of growth of the consumer price index. We also have considered, as an alternative, inflation rates computed using GDP deflator and we have verified that both the qualitative and the quantitative conclusions we have reached are robust. We also have computed annual growth rates by taking the rate of change in the consumer price level over four quarters. Although some of the quantitative conclusions are altered by this alternative measure, the general conclusions are robust also to this change. The rate of growth of money and of output are similarly computed. We use in all cases a broad definition of money: M2 is employed in all countries but France where M3 is used. Note that money supply data for European countries is available only up to 1998:4. Therefore, the forecasting statistics produced by bivariate models where money growth is used cover only the 1996:1–1998:4 period. The output gap is computed using a one sided exponential smoothing algorithm. We choose this specification, as opposed to a more standard Hodrick and Prescott (HP) filter, because the time-series for the gap retains the timing of information of the original series, a feature not produced by the HP filter because of its two-sided nature. Because this measure is statistically based, the usual questions about the economic meaning of this gap can be raised. Note that the measure we constructed is highly correlated with the output gap generated with a Beveridge-Nelson decomposition. The slope of the term structure is calculated by taking the difference between the annualized long-term interest rate (of maturities varying from 5 to 10 years, depending on the country) and the annualized short-term one (typically, a three-month rate). The unemployment rate measures are standardized unemployment figures as provided by the OECD. The employment growth series measures the number of workers seeking jobs that have found a job in the quarter under consideration, annualized as the other variables. The rent price index measures the costs of housing and its growth rate is computed in a similar fashion. All the other variables we have tried (unit labor costs, capacity utilization, employment, wage rate, nominal exchange rates, real effective exchange rates in levels, and growth rates) are the standard ones provided by the OECD data bank. Stock prices are obtained from the BIS data bank. We use in the exercise the SP500 index for the United States, the Nikkei 225 index for Japan, the Toronto 300 composite index for Canada, the DAX composite index for Germany, the CAC 40 index for France, the FT100 index for United Kingdom, and the MIB index for Italy.
Some of the inflation series (especially those for the United Kingdom and Japan and marginally the one for Germany) display residual seasonal variation despite being labeled as “seasonally adjusted.” To take care of these predictable variations, this residual seasonality is removed using time-varying seasonal dummies. This appears to be sufficient as the autocorrelation function of the adjusted series does not show any significant seasonal coefficients. Some seasonal variations also are present in the monetary aggregates of some countries. Therefore, we also purge monetary aggregates from residual seasonal variations before they are used in bivariate forecasting models.
Levin and Piger (2002) prefilter the G-7 inflation series to take into account predictable variations because changes in VAT and other sale taxes. None of our series display significant predictable changes at the dates they suggest (UK 1990:2, Canada 1991:1; 1994:1, and 1994:2, Germany 1993:1, Japan 1997:2). Therefore, we conjecture that OECD statisticians have already made these adjustments or that these changes produce jumps in prices but no changes in the inflation series.
APPENDIX B: GIBBS SAMPLER
For our application, it turns out that C=I is optimal. Hence, the model we use has the structure:

where
. To compute posterior distributions we need prior densities for (Σ, σt, B0, θt−1). Because we want to minimize the impact of our choices on the posterior distribution of the indicators, we specify rather loose priors.
We let B0i=bi*I, i=1, 2, 3, where bi is a vector of parameters that controls the tightness of the variance of factor i and we let
with

where N stands for Normal, W for Wishart, and G for gamma distributions,
denotes the information available at time t−1, and
. The last conditional distribution also implies that
, where
and
. We also assume
and set σ2 equal to the average of the estimated variances of NG AR(p) models, Q1 to the estimated variance-covariance in the time invariant version of (B.1), whereas θ0 is initialized with a sequential OLS on (B.1) in a training sample.
To calculate the posterior distribution of
we combine the above priors with the likelihood of the data, which is
, where YT=(Y1, …, YT) denotes the data. Using Bayes rule, we have p(ψ[mid ]YT)=p(ψ)L(YT[mid ]ψ)/p(YT)∝p(ψ)L(YT[mid ]ψ). Given p(ψ[mid ]YT), the posterior for the components of ψ, p(Σ[mid ]YT), p(bi[mid ]YT), p(σt[mid ]YT) and p(θt[mid ]YT), can be obtained by integrating nuisance parameters out of p(ψ[mid ]YT).
For the model considered in this paper, it is impossible to compute p(ψ[mid ]YT) analytically, but the Gibbs sample can be used if p(Σ[mid ]YT, ψ−Σ),
,
and p(θt[mid ]YT, ψ−κ), where ψ−κ denotes the vector of ψ excluding the parameter κ, are available. The conditional distributions of interest are

where
and
are the one-period-ahead forecasts of θt and the variance-covariance matrix of the forecast error, respectively, and are obtained as:

where
and
is the ith-subvector of θ, with i=1, 2, 3.
Because we are not directly sampling from the posterior, it is important to monitor that the Markov chain induced by the sampler converges to the ergotic (posterior) distribution. The result we present are based on chains with 24,000 draws: 600 blocks of 40 draws were made and the last draw for each block is retained after the discarding the first 4000. This means that a total of 500 draws is used at each t to conduct posterior inference.
I would like to thank two anonymous referees, the associate editor of this journal and the participants of seminars at the ECB, the Bank of England, the Riksbank, Ente Einaudi, Tilburg, Oxford, Bocconi, ULB, York, Warwick, and CERGE for comments and suggestions.