The research on voter turnout in America is impressive in quantity and
quality, but it lacks breadth. National and state elections have received
most of the attention, while the myriad of other elections, from municipal
contests to policy referenda, have often been ignored. As a result, we know
a great deal about turnout in state and national elections, and much less
about turnout in other races. The temptation is to generalize the state and
national conclusions to other elections, but this is risky. For example, in
a recent aggregate-level study of small town elections in Iowa, Rice and
Schlueter (2004) report a relationship that runs
contrary to virtually all of the state and national literature: education
and turnout are negatively correlated; that is, the citizens in
better-educated communities vote in local elections at lower rates than the
citizens in less-educated communities. This finding exposes the limitations
in our understanding of voter turnout. If all we want is to speak with
assurance about turnout in state and national elections, then the current
literature is very helpful. If, however, we want to be able to speak more
generally about turnout (and speak more specifically about turnout in
elections other than state and national contests), then we need to study
more types of elections.
There is certainly no shortage of elections to examine. Americans are asked
to vote more often and for a much wider range of political offices than the
citizens of any other nation. In a four-year span, the typical American
faces at least a dozen “election days.” Additionally, many people are asked
to vote in a variety of private elections, such as contests to select
leaders and set policy at work, churches, service clubs, and so on.
Obviously, compiling a full account of voter turnout in America is a
daunting task, and well beyond the scope of this study. The purpose of our
research is simply to move us in that direction. To that end, we provide the
first systematic analysis of voter turnout in undergraduate student
government elections at America's colleges and universities.
At first blush, studying turnout in student government elections may seem
trite. After all, student governments exercise very little control over the
affairs of their schools. There are, however, several good reasons for
studying student elections. For one, the regulations that govern these
elections vary substantially from school to school, providing us the
opportunity to examine how these differences influence turnout. The lessons
learned from student elections should help us understand how turnout in
other elections would be affected by changes in regulations. As an example,
the experiments with online voting that some schools are conducting should
provide clues about how online voting would influence turnout in more
traditional elections. A related reason for examining student elections is
that they may give us ideas for how to increase turnout, especially among
young people. Perhaps schools with high turnout rates have electoral
environments that could be replicated in other settings with similar
results. Another reason for looking at campus elections is that this
research may help increase student interest in elections. By making the
study of turnout more proximate to their daily lives, students may become
more curious about elections specifically and the political process more
generally. The last reason for studying student elections takes us back to
our original point: a comprehensive understanding of turnout requires that
scholars examine a wider array of elections than they have to date. Studying
undergraduate student government elections, which are held annually at
hundreds of colleges and universities across the nation, will help build
this comprehensive understanding.
Research Design
We focus on American colleges and universities that offer four-year
degrees. These include four-year degree schools that also offer two-year
degrees and four-year schools that also offer graduate degrees.
According to a list compiled by US News and World Report (2004), approximately 1,400 schools meet our
criterion. From this list, we drew a random sample stratified by
undergraduate enrollment. There are far more small schools than large
schools, so if we selected randomly our sample would be skewed in favor
of small schools. We divided the schools into four enrollment
categories: 0–2,000; 2001–5000; 5001–10,000; and greater than 10,000
students. One hundred schools were randomly chosen from each of the
categories and these schools served as our sample.
We used email to send a survey to the student government at each of the
schools. For most schools, we were able to find either a general email
address for the student government or a specific email address for the
student government president. In many instances, however, we were forced
to use a school's general email address. When this was the case, we
prefaced our request for information by asking the recipient of the
email to forward it to the student government. About one-quarter of the
schools were emailed in November of 2003 and the other three-quarters
were emailed in February and March of 2004. Schools that did not respond
to our first email received a second email, and those that did not
respond to the second email, received a third. Even with these multiple
requests, our response rate was only 23.5%; 94 schools returned usable
information. Of these schools, 21 have enrollments between 0 and 2,000,
19 have enrollments between 2,001 and 5,000, 28 have enrollments between
5,001 and 10,000, and 26 have enrollments larger than 10,000 students.
The major reason for the low response rate probably lies in the
part-time nature of student government. Most student government offices
are staffed by an ever-changing cadre of student volunteers. Many
requests for information—especially nonessential off-campus requests
like ours—are probably misplaced or disregarded. With such a low
response rate, it is important to confirm that our 94 schools are
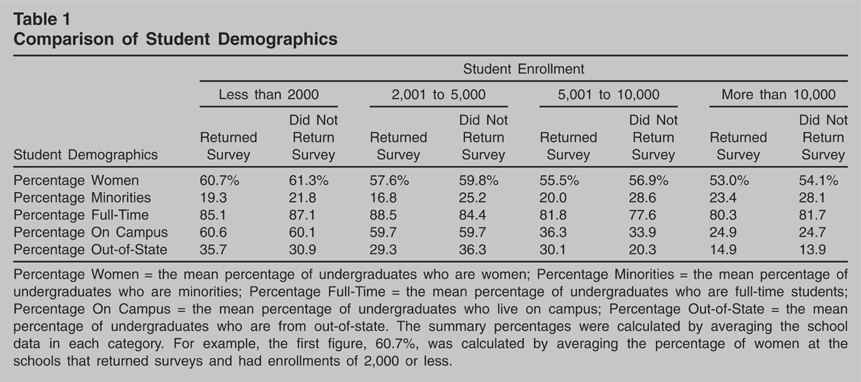
similar in characteristics to those schools that did not reply. In Table 1, the undergraduate student demographics
for our schools are compared to the demographics of the other schools,
and the results show that the demographics are very similar in every
instance. Thus, we can be confident that the schools for which we
received survey data are representative of all of the schools.
Comparison of Student Demographics
The email we sent to each school included a survey that asked many
questions about the school's student government elections. Central among
these was a query about how many students voted in the school's last
student government presidential election. In addition, we asked how many
candidates ran for president and the vote totals for the top three
candidates. The other questions we asked included: 1) whether part-time
students and graduate students were eligible to vote; 2) whether
students could vote online; 3) how many days the polls were open; and 4)
what types of campaign materials and activities were used during school
elections (e.g., posters, web pages, and debates). The full text of the
survey is in the Appendix. Along with the information from the surveys,
we collected an assortment of potentially relevant aggregate data on
each of the schools.
Analysis
We begin our analysis with an examination of the voter turnout rates at
the schools. Next, we focus on accounting for the variations in turnout
rates across the campuses. Several of the factors that may influence
turnout are quantified in order to serve as independent variables.
Multiple regression analysis is used to determine the relationship
between these independent variables and turnout.
Student Government Election Turnout Rates
Each school's student government election turnout rate was derived by
dividing the total number of students voting in the undergraduate
student government presidential race by the total number of eligible
students. The total number of students voting came directly from
information provided by the schools in survey. Determining the total
number of eligible students was a two-step process. From information
provided in the survey, four voter eligibility categories were
developed: 1) only full-time undergraduate students (9 schools); 2)
full-time and part-time undergraduate students (33 schools); 3)
full-time undergraduate and graduate students (8 schools); and 4)
full-time and part-time undergraduate and graduate students (44
schools). We then consulted Peterson's Four-Year Colleges
(2004) and other sources to determine how
many students were in the eligibility category of each school. With this
information, we were able to compute the voter turnout for each school.
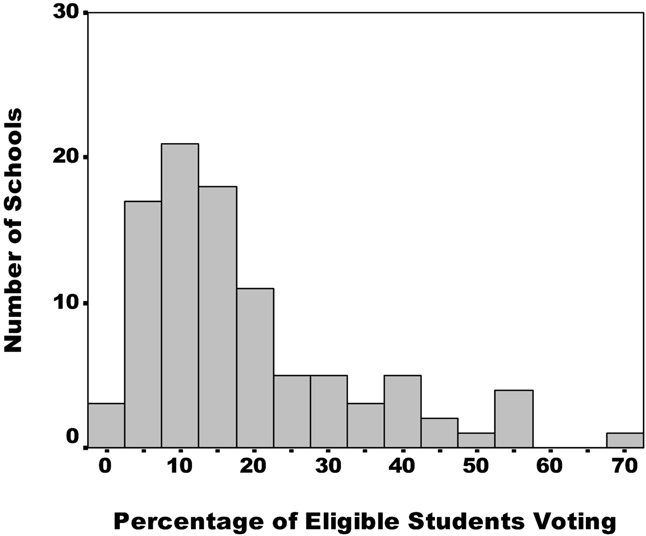
The results are displayed in Figure 1. The
skewed distribution shows that most of the schools had turnout rates of
less than 25%, although a few had substantially higher rates. Overall,
turnout ranged from less than 1% to almost 70%, with a mean of 18.8% and
a standard deviation of 14.7.
Distribution of Turnout in Student Government Presidential
Elections
How do these student government turnout rates compare to the rates in
other American elections? The turnout rates in recent United States
presidential races have averaged a little over 50% and the rates in
recent mid-term congressional elections have averaged near 40%, so the
student rates are considerably lower. Compared to other races, however,
the student rates do not look so low. Turnout rates in urban mayoral
races have averaged between 30% and 35% in recent decades (Morlan 1984; Wood
2002), and the turnout rates in small towns have been even lower
(Rice and Schlueter 2004). Primary
election turnout rates vary sharply, but in many statewide primaries the
percentage of eligible people voting is below 25% (Wright 1989). In the recent 2004 presidential primaries,
turnout rates were often below 20% (McDonald
2004). In all, then, student turnout rates tend to be
substantially lower than the rates in national and statewide general
elections, but the student rates are similar to the rates in many other
types of elections. We now examine the differences in student government
turnout rates across campuses.
Independent Variables
Studies of turnout have long distinguished between the background
contextual variables that influence voting, such as education levels and
election rules, and election specific variables that influence voting,
such as the closeness of the race and campaign mobilization efforts
(Campbell, Converse, Miller, and Stokes
1960; Patterson and Caldeira 1983;
Rosenstone and Hansen 1993). Turnout in
student elections should also be influenced by both long-term contextual
and short-term election variables.
Contextual Variables
We divided the contextual variables that may influence student
election turnout into three types: institutional characteristics,
student demographics, and election rules. The institutional
characteristics are variables that have to do with the school as an
institution, such as whether it is public or private and whether it
is in a rural or urban setting. The student demographics are
variables that describe the student body, such as the gender mix and
the students' residential preferences. Some variables, such as
admission rates, straddle the line between institutional
characteristics and student demographics, and we have placed these
variables in the category that seemed most appropriate. The
elections rules are variables that have to do with the schools'
policies regarding student government presidential elections, such
as who is eligible to vote.
Seven institutional characteristics were operationalized for
empirical testing and the information necessary to construct these
variables came from Peterson's Four-Year Colleges (2004). Public schools were coded as a “0”
and private schools were coded as a “1”. Schools in the South were
coded as a “0”and all other schools were coded as a “1” (the South
was considered the 11 states of the old Confederacy). Schools in a
rural setting were coded as a “0”, those in a small town setting
were coded as a “1”, and those in an urban or suburban setting were
coded as a “2”. The size of the school electorate was coded as the
log transformation (base 10) of the number of students eligible to
vote in undergraduate student government presidential elections. The
log transformation was needed because even though we stratified our
sample by school size, the number of eligible students was still
skewed in favor of small schools. By logging eligibility, we reduce
the skewness statistic from 1.69 to −.27. The difficulty of getting
admitted to the schools was measured using Peterson's (2004) five-point scale, where the
noncompetitive schools were coded as a “1”, the minimally difficult
schools were coded as a “2”, the moderately difficult schools were
coded as a “3”, the very difficult schools were coded as a “4”, and
the most difficult schools were coded as a “5”. Entrance difficulty
was also measured using the percentage of applicants who were
granted admission. Lastly, for a measure of the contact between the
faculty and students, we used the number of students per faculty
member.
We also used information from Peterson's Four-Year Colleges
(2004) to construct the five student
demographic variables used in Table 1.
These variables are the percentage of students who are women, the
percentage of students who are minorities, the percentage of
students who are enrolled full-time, the percentage of students who
live in campus housing, and the percentage of out-of-state students.
Lastly, we used information from US News and World Report
(2004) and other sources to create a
dummy variable to indicate the presence of a Greek system. Schools
with no social fraternities or sororities were coded as a “0” and
schools with social fraternities or sororities were coded as a
“1”.
From information in the surveys we constructed seven independent
variables that measure differences in the rules that govern student
elections (three of these variables test eligibility differences).
Schools that hold their student government presidential election at
a different time than their other student government elections were
coded as a “0” and those schools that hold their presidential
election in conjunction with other student elections were coded as a
“1”. Schools that elect their president and vice president
separately were coded as a “0” and schools that elected their
president and vice president as a ticket were coded as a “1”.
Schools that do not use online voting were coded as a “0” and
schools using online voting were coded as a “1”. Schools where the
polls are open for only one day are coded as a “1”, schools where
the polls are open for two days are coded as a “2”, and schools
where the polls are open for more than two days are coded as a “3”.
As described earlier, we devised four categories to measure who is
eligible to vote: 1) only full-time undergraduate students; 2)
full-time and part-time undergraduate students; 3) full-time
undergraduate and graduate students; and 4) full-time and part-time
undergraduate and graduate students. To operationalize the
categories, we created four dichotomous variables, one for each
eligibility category. Each variable was coded as a “0” for schools
that are not in that particular eligibility category and as a “1”
for schools that are in that category. For example, the variable
signifying the schools where only full-time undergraduate students
can vote was coded as a “0” for all of the schools in the other
eligibility categories and as a “1” for all of the schools where
only full-time undergraduate students can vote. The omitted variable
that serves as the baseline for our test of the effect of
eligibility is the full-time and part-time undergraduate and
graduate category.
Before turning to the election specific variables, it is important to
note that many of the contextual variables probably serve, in part,
as proxy measures for the socio-economic status of the students'
parents. When we entered all of the independent variables, including
the election specific variables, in a principal component analysis
(varimax with Kaiser normalization) the first factor had seven
variables with coefficients greater than .50 (or less than −.50).
These variables, all contextual variables, are whether a school is
public or private, the Peterson's difficulty index, the admission
rate, the number of students per faculty member, the percentage of
full-time students, the percentage of students living on campus, and
the percentage of out-of-state students. We suspect that the reason
these variables load heavily on the same factor is that they are
tapping the socio-economic status of the students' families. Parents
who are relatively well-to-do and well-educated should be, on
average, more likely than other parents to prepare and encourage
their children to attend private schools, schools with tough
admission standards, out-of-state schools, schools where most
students live on campus, schools where most students are full-time,
and schools with low student-teacher ratios. These same parents are
likely to be active politically and to have children who are active
politically (Jennings and Niemi 1981).
This is not to say that the contextual variables are only serving as
surrogates for the socio-economic backgrounds of the students. It
seems reasonable to assume, for instance, that living on campus will
lead students to take more interest in student government. On-campus
students should be more integrated into campus activities than
off-campus students, and they are more directly affected by many of
the issues that student governments address, such as dormitory
regulations and campus cafeteria matters. Likewise, it seems
reasonable to assume that full-time students will be more integrated
into campus life than part-time students. As another example,
private schools often take more time than public schools to
assimilate students to campus, and this may foster more interest in
student government. And, out-of-state students, freed from the
distractions of family and hometown friends, may be more engaged in
campus activities than in-state students. It is even possible that
interest in campus life is enhanced in schools with low
student-teacher ratios. The point is that these contextual variables
may have an influence on student government election turnout beyond
simply serving as surrogate indicators for the social-economic
status of the students' families.
Ideally, we would have a more direct school-level measure of the
socio-economic status of the students' parents than the contextual
variables. Such a measure would help us sort out to what degree the
contextual variables are capturing the influences of socio-economic
status and to what degree they are capturing the influences of
variables they are directly measuring. Unfortunately, an extensive
search did not uncover any useful measures of the socio-economic
status of the parents. Many schools are reluctant to report these
data and no organization makes a concerted effort to compile a
comprehensive summary of the data. Every year, the Higher Education
Research Institute interviews thousands of first-year college
students at approximately 700 schools and collects information on
parental socio-economic status, but the Institute does not make
these data available by school. Even if the data were available,
many of our schools would undoubtedly not be in the Institute's
sample of schools. The United States Department of Education
compiles the percentage of students at each school who receive
federal aid. These data might seem to be a promising proxy for
parents' socio-economic status, but the data suffer from a number of
serious shortcomings. First, the data are not collected for all
schools. Second, the extent to which students apply for federal aid
is in part a function of how much state aid is available, and the
amount of state aid varies significantly across states. Third, the
extent to which students apply for federal aid also depends on how
aggressive schools encourage students to apply. We also considered
using mean SAT and ACT scores by school as a very rough proxy for
parents' socio-economic status, but many schools do not report these
data.
Election Specific Variables
We divided the election specific forces that may influence turnout in
student elections into two types: electoral competition and campaign
activity. The information to construct these variables came from the
surveys. Two variables measure electoral competition: the number of
presidential candidates in the race and the percentage of the vote
received by the winning presidential candidate. Campaign activity
was also measured with two variables. One was created from the
series of survey questions that asked respondents about whether or
not each of the following five forms of campaign activity was used
regularly in campus elections: posters, flyers, t-shirts,
advertisements in student newspapers, and web pages. We formed a
composite index of advertising activity by assigning to each school
the number of advertising techniques used in its presidential
elections, with scores ranging from 0 (none of the five advertising
techniques were used) to 5 (all five techniques were used). In
addition to this index, a second campaign activity variable was
created to indicate whether organized debates are held between the
presidential candidates. Schools that do not hold debates were coded
as a “0” and schools that do hold debates were coded as a “1”. These
two variables provide a good gauge of the amount of campaign
activity on the campuses, and they also serve as surrogate
indicators of campaign mobilization efforts. Recent research shows
that turnout increases when citizens are contacted directly by
campaigns via canvassing, direct mail, and so on (Gerber and Green 2000), and when they are exposed to
campaign advertising, even negative advertising (Freedman and Goldstein 1999). In our campus elections,
it stands to reason that more students are exposed to campaigns—both
directly and through advertising—when more types of campaign
activity are used. Thus, more students should be mobilized to vote
when campaign activity takes many forms, everything else being
equal.
Determinants of Turnout
For a first look at the determinants of student turnout, we regressed
turnout rates on all of the independent variables simultaneously using
ordinary least squares regression. A check of the model diagnostics
revealed that one independent variable, the percentage of students who
live on campus, had a variance inflation factor score well above 5.00,
indicating that it was highly collinear with other independent
variables. When we dropped this variable and reran the equation we got
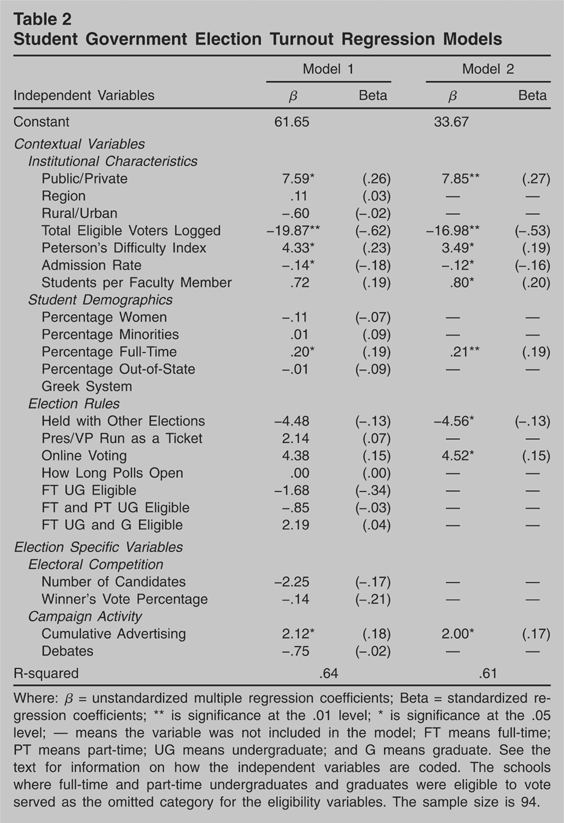
the results presented in Model 1 of Table 2.
The R-square value of .64 indicates that the model performs well
overall, but only six of the independent variables are statistically
significant. To try to improve on this, we reran the equation several
times, each time dropping the least significant variable, until only
statistically significant variables remained. The results of the final
equation are reported in Model 2, in Table 1.
The R-square remains strong and nine of the independent variables now
reach statistical significance.
Student Government Election Turnout Regression Models
Five of the nine significant independent variables are institutional
characteristics from the contextual category. The coefficients of four
of these variables are in the direction we anticipated and show that
student turnout tends to be higher at private schools, smaller schools,
schools that are more difficult to get into, and schools that admit a
higher percentage of their applicants. The one institutional variable
that fails to perform as we expected is number of students per faculty
member. The positive coefficient implies that schools with more students
per faculty member tend to have higher turnout. We do not have a good
substantive explanation for this relationship, but it is worth noting
that it emerges only after controlling for the other independent
variables. The bivariate correlation between the number of students per
faculty member and turnout is negative, as expected.
The only student demographic variable to reach significance is the
percentage of full-time students. The positive coefficient for this
variable indicates that turnout tends to be higher at schools with more
full-time students. Two of the election rules variables are significant.
The negative coefficient for the variable designating whether the
presidential election is held in conjunction with other student
government elections suggests that presidential election turnout tends
to be higher when the election is held at a different time than other
student government races. Online voting appears to increase turnout, as
indicated by the positive coefficient for this variable. The final
significant variable, and the only election specific variable to reach
significance, is the campaign advertising index. The positive
coefficient means that turnout tends to be higher on campuses where
student campaigns use many forms of advertising.
Discussion
The major conclusion from our research is that contextual variables
influence turnout in student government presidential elections far more
than election specific variables. For colleges and universities looking
to increase turnout, this is not particularly good news. Schools may
want to increase interest in student elections for many reasons, from
the bonds it may help forge between the students and the school, to the
positive and lasting effects it may have on the students' sense of
political efficacy, but the primary message from Model 2 is that this
will be a difficult task. The significant contextual variables measuring
whether a school is public or private, academic competitiveness,
admission rates, and the percentage of full-time students, are probably
in part proxies for the socio-economic status of students' parents,
suggesting that one way to increase turnout would be to attract more
students from well-to-do and well-educated families. This, of course, is
not easy because the pool of such students is fixed. Many of the
contextual variables probably also have an influence on turnout apart
from serving as proxies for parents' socio-economic status, and the news
is not especially good here, either. According to the coefficients for
six of these variables, turnout would increase if public schools went
private, the number of students eligible to vote was decreased, the
difficult of getting in was increased, fewer students were admitted, the
number of student per faculty member was increased, and the percentage
of full-time students was increased. All of these recommendations are
either difficult or impractical, or both.
Not all of the news is bad, however. Model 2 suggests that many schools
looking to increase turnout in student government elections would
benefit from changing two basic election rules and by encouraging more
campaign advertising. Based on the information in the model, schools
that now hold their student presidential elections at the same time as
other student elections would increase turnout more than 4% on average
if they held their presidential elections separately. Likewise, schools
that do not have online voting would increase their turnout over 4% on
average if they adopted this means of voting. And, schools that
encourage more campaign advertising—and a wider array of
advertising—would probably also see a modest increase in turnout.
Advertising can probably be increased if schools can generate more
interest in student government, and thereby, student elections. Although
it is beyond of the scope of our study to examine ways of increasing
interest in student government, we will suggest that schools should
think broadly, looking at everything from giving students incentives for
participating in student government (perhaps service learning credit) to
giving student governments more formal powers over campus decisions.
Our research is also relevant to a couple of contemporary debates about
how to increase turnout in America's public elections. In recent years,
many political observers and public officials have advocated allowing
voters to cast their ballots over the Internet as a way of increasing
voter turnout. Arizona experimented with online voting in its 2000
Democratic primary and Michigan used online voting in its 2004
Democratic primary, and in both instances heavy online voting
contributed to higher than usual turnout (Gibson
2001; Seelye 2004). But, in a
much-hyped online Republican presidential straw-poll in Alaska in 2000,
only 35 out of 3,500 eligible citizens voted (Gibson
2001). The results of our study are more in line with the
Arizona and Michigan experiences: we find solid evidence that the option
to vote online increases turnout in student government elections.
Another tactic implemented in recent decades to try to increase turnout
in public elections has been to lengthen the time that the polls are
open. In the beginning, this took the form of extending the hours that
the polls were open on Election Day, but it has now been expanded to
include “early voting” weeks before Election Day. Our research examines
an approach between these two. Some schools limit voting to one day,
others keep the polls open for two days, and some allow voting to
continue for even longer, although rarely for more than a week. The
existing research suggests that keeping polls open longer on Election
Day helped increase turnout (Wolfinger and Rosenstone
1980), but that allowing people to vote weeks before Election
Day has had little effect on turnout (Neeley and
Richardson 2001; Richardson and Neeley
1996; Stein and Garcia-Monet 1997).
The student government election data are consistent with the latter
conclusion: we find that keeping the polls open for more than a day has
no effect on turnout.
If we compare our findings more broadly to the literature on voter
turnout in public elections, what do we see? There are some
similarities. Most previous studies have found that contextual variables
have a larger influence on turnout than election specific variables, and
we find the same. Among the many contextual variables, socio-economic
status has often been found to be among the most important (Campbell, Converse, Miller, and Stokes 1960;
Rosenstone and Hansen 1993). We do not
have any direct measures of the socio-economic background of the
students, but if we assume that many of our contextual variables, such
as whether a school is public or private, are related to their
socio-economic upbringing, then our findings are consistent with the
literature. Well-to-do and well-educated parents are probably more
likely to send their children to private schools, schools that are
difficult to get into, schools with low student-teacher ratios, and so
on, and turnout tends to be higher at these types of schools. Also
consistent with the literature is our finding that campaign advertising
can have a positive impact on mobilizing turnout.
Not all of our research findings, however, buttress the existing
literature. Contrary to much of the previous work (Cox and Munger 1989; Gray 1976),
we find that close campaigns are not associated with higher voter
turnout. Perhaps this is because students do not have the benefit of
preelection polls to gauge the closeness of upcoming contests. We also
find no support for the notion that turnout will be higher if more
elections are held on the same day. Indeed, we find just the opposite:
turnout tends to be lower in student government presidential elections
if the contests are held in tandem with other student elections. Here
again, our student government elections provide an interesting and
constructive extension to the existing work on public elections.
To conclude, let us step away from discussing the determinants of turnout
and revisit the absolute level of turnout in student elections. With an
average turnout rate of approximately 20%, the student rates are far
below the turnout rates in national and statewide general elections. It
is easy to assume that this does not bode well for the voting rate of
today's young people as they age. We take a different view, however.
While it is true that the student rates pale in comparison to the rates
in most major public elections, the student rates are very similar to
the rates in many municipal elections and many statewide primary
elections. Given that students are only temporary residents of their
campuses and that student governments do not have extensive powers, we
find it encouraging that so many students vote. And, if we can find ways
to increase voting in campus elections, such as implementing online
voting, we may discover that turnout rates among young people in public
elections begin to rise, too.
Author Bios
Tom Rice is professor in the department of political science at the
University of Iowa. His research interests include voting behavior,
social capital, and local government.
Kimberly Lewis is a law student at the University of Iowa. She received
her B.S. in political science from the University of Iowa.