Introduction
Calcium phosphate (CaP)-based bioceramics are widely used as bone substitutes for reasons ranging from chemical similarity to natural bone, resorbability, and dynamically supporting bone cell activity [Reference LeGeros1, Reference Hwang, Park, Lee, Jung, Kim, Cho, Lee and Choi2, Reference Samavedi, Whittington and Goldstein3]. The compositional similarity of CaP to the mineralize bone matrix made it excellent biocompatible in both in vitro and in vivo conditions [Reference Hwang, Park, Lee, Jung, Kim, Cho, Lee and Choi2, Reference LeGeros4, Reference Detsch, Mayr and Ziegler5, Reference Jalota, Bhaduri and Tas6, Reference Yuan, van Blitterswijk, de Groot and de Bruijn7, Reference Ogose, Hotta, Hatano, Kawashima, Tokunaga, Endo and Umezu8, Reference Chazono, Tanaka, Komaki and Fujii9]. However, under physiological condition, CaP ceramics may undergo phase transformation into low-soluble hydroxyapatite (HA) and showed slow degradation and longer time frame to be replaced by host bone tissue [Reference Penel, Leroy, Van Landuyt, Flautre, Hardouin, Lemaître and Leroy10, Reference Bohner, Theiss, Apelt, Hirsiger, Houriet, Rizzoli, Gnos, Frei, Auer and von Rechenberg11, Reference Kanter, Geffers, Ignatius and Gbureck12]. As an alternative, magnesium-based bioceramics have gained attention due to their excellent biocompatibility coupled with higher resorption rate than CaP at in vivo conditions [Reference Kanter, Geffers, Ignatius and Gbureck12, Reference Klammert, Ignatius, Wolfram, Reuther and Gbureck13, Reference Tamimi, Nihouannen, Bassett, Ibasco, Gbureck, Knowles, Wright, Flynn, Komarova and Barralet14]. The dissolution product, Mg2+ ions, can inhibit the growth of low-soluble HA crystals [Reference Salimi, Heughebaert and Nancollas15] and is also essential for maintaining the bone health [Reference Castiglioni, Cazzaniga, Albisetti and Maier16]. The deficiency of Mg2+ ions in body may led to low bone growth rate, osteoporosis, and bone fragility [Reference Rude, Gruber, Wei, Frausto and Mills17]. These Mg2+ ions play a significant role in development of bone tissue by stimulating the adhesion and proliferation of osteoblastic cells by regulating cellular level signaling mechanism [Reference Zreiqat, Howlett, Zannettino, Evans, Schulze-Tanzil, Knabe and Shakibaei18]. The released Mg ions improve the adhesion of osteoblasts, enhance the vascularization process, and increase collagen type 1 and OPN expression, which leads to mature bone formation near the implantation site [Reference Cabrejos-Azama, Alkhraisat, Rueda, Torres, Blanco and López-Cabarcos19, Reference Cheng, Wahafu, Jiang, Liu, Qiao, Peng, Cheng, Zhang, He and Liu20]. Recently, Díaz-Tocados et al. reported that Wnt/β-catenin and Notch signaling are the two important pathways involved in osteogenesis. They found that presence of Mg upregulates osteogenic differentiation via activation of Notch1 signaling in mesenchymal stem cells (MSCs) [Reference Díaz-Tocados, Herencia, Martínez-Moreno, de Oca, Rodríguez-Ortiz, Vergara, Blanco, Steppan, Almadén, Rodríguez and Muñoz-Castañeda21]. Xue et al. showed that 1 wt% Mg-doped tricalcium phosphate was found to enhance the osteoblast cell proliferation and differentiation [Reference Xue, Dahlquist, Banerjee, Bandyopadhyay and Bose22]. Mg ions are also known for their effects on reduced pre-osteoclast cell proliferation and differentiation [Reference Wu, Luthringer, Feyerabend, Schilling and Willumeit23]. Therefore, there is an increased interest in developing magnesium phosphate (MgP)-based bioceramics for both bone regeneration and therapeutic applications.
Chemical and physical modifications of bioceramics through metal ion doping are a well-explored area. The fundamental concept is that due to metal ion doping, sintering kinetics changes, which results in controlled grain size, density, and eventually degradation kinetics. Along with that, presence of metal ions is also known for their significant effects on enhanced biocompatibility, both in vitro and in vivo. Silicon is a trace element that is essential for the early stage of bone mineralization [Reference Carlisle24]. The early series of experiments by Carlisle showed that Si has a crucial role in bone calcification process [Reference Carlisle25, Reference Carlisle26]. It is also found that Si has involvement in wound healing process [Reference Seaborn and Nielsen27]. At the cellular level, several studies, using osteoblast cells, were carried out to understand the role of silicon [Reference Reffitt, Ogston, Jugdaohsingh, Cheung, Evans, Thompson, Powell and Hampson28, Reference Kim, Bu, Sung and Choi29, Reference Arumugam, Ireland, Brooks, Rushton and Bonfield30]. Reffitt et al. reported that Si from 10 µM orthosilicic acid had positively stimulated type I collagen synthesis on MG-63 osteoblast-like cells and also enhanced their differentiation [Reference Reffitt, Ogston, Jugdaohsingh, Cheung, Evans, Thompson, Powell and Hampson28]. Schröder et al. reported that 3 µM concentration of silicate has a significant role in growth rate of SaOS-2 osteoblastic cells, whereas the growth rate of RAW264.7 osteoclastic cells was unaffected [Reference Schröder, Wang, Wiens, Diehl-Seifert, Kropf, Schloßmacher and Müller31]. Si-doped (0.2, 0.4, 0.8, and 1.5 wt%) HA shows early bone apposition compared with pure HA into distal femoral condyle of rabbits [Reference Hing, Revell, Smith and Buckland32]. The same study reported that 0.8 wt% of silicon supported more bone regeneration after 3 and 6 weeks than 1.5 wt% Si-doped HA. Tricalcium phosphate (TCP) doped with Si (1.5 and 3.0 wt%) showed high bone to implant contact area, high new bone formation, and increased stability with increasing concentration of silicon under in vivo condition [Reference Mate-Sanchez De Val, Calvo-Guirado, Delgado-Ruiz, Ramirez-Fernandez, Martinez, Granero-Marin, Negri, Chiva-Garcia, Martinez-Gonzalez and De Aza33, Reference De Val Maté-Sánchez, Calvo-Guirado, Delgado-Ruiz, Ramírez-Fernández, Negri, Abboud, Martínez and De Aza34, Reference Velasquez, Luklinska, Meseguer-Olmo, Mate-Sanchez De Val, Delgado-Ruiz, Calvo-Guirado, Ramirez-Fernandez and De Aza35]. Although the mechanism behind the osteogenic property of silicon is not well understood, it is postulated that Si plays a significant role in overall bone remodeling.
Owing to its versatile role in bone remodeling, Si was incorporated into MgP bioceramics to tune their in vitro and in vivo degradability and biocompatibility. The effects of Si doping on physicochemical properties were evaluated by X-ray diffractometer (XRD), scanning electron microscopy (SEM), and µ-CT analysis. In vitro degradability was assessed by immersing the ceramics in simulated body fluid (SBF) for varying time, followed by weight loss and µ-CT analysis. In vitro cytocompatibility was studied with MG-63 cells using alamar blue and live/dead imaging. In vivo osteogenesis was evaluated by implanting the samples in rabbit femur, followed by µ-CT, histology, and oxytetracycline (OTC) labeling characterizations.
Results
Phase formation analysis
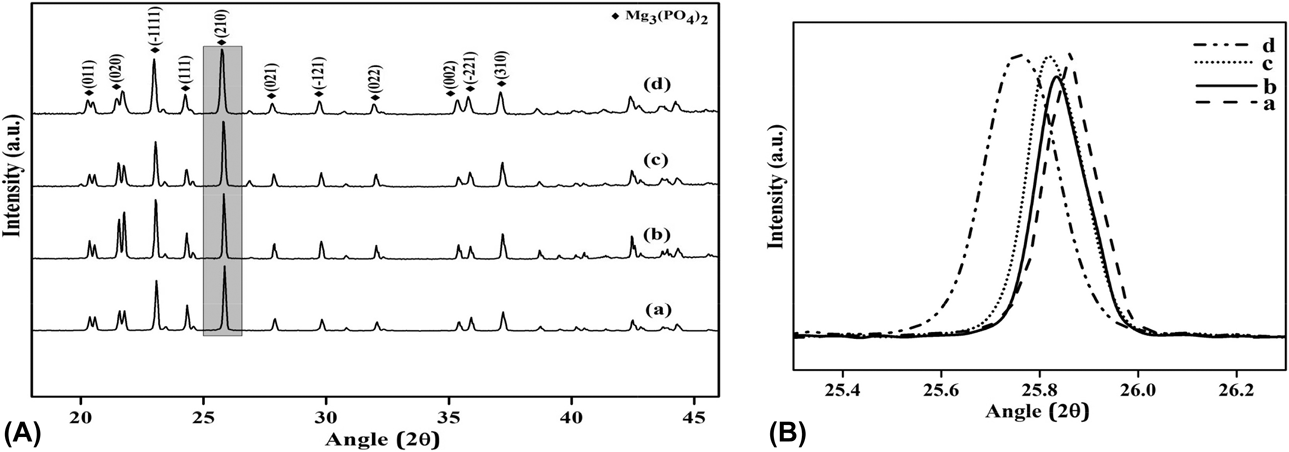
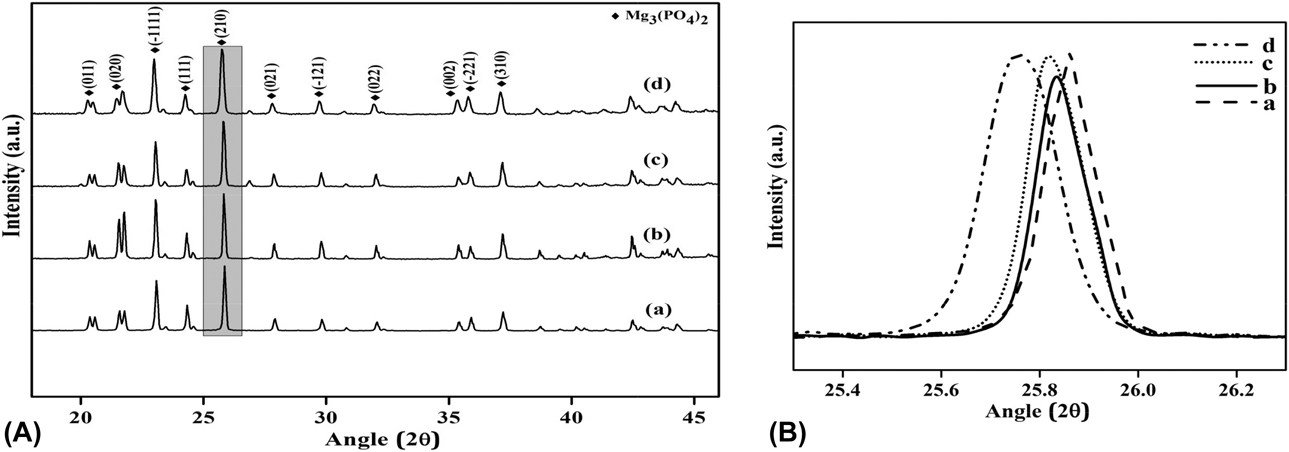
The XRD patterns of synthesized MgP and Si-doped MgPs are shown in Fig. 1. Major peaks within the diffraction angle of 2θ = 20–27° correspond to farringtonite phase (JCPDS #33-0876). Peak shift toward lower angle for Si-doped MgP compounds was observed. As shown in Fig. 1(B), the primary peak (210) of MgP (at 2θ = 25.85°) had shifted to 2θ = 25.83°, 2θ = 25.80°, and 2θ = 25.74° for MgP–0.5Si, MgP–1.25Si, and MgP–2.0Si, respectively.
(A) XRD patterns of Si-doped MgP samples: (a) MgP, (b) MgP–0.5Si, (c) MgP–1.25Si, and (d) MgP–2.0Si. (B) Si doping induced primary peak shift.
Density and microstructural analysis
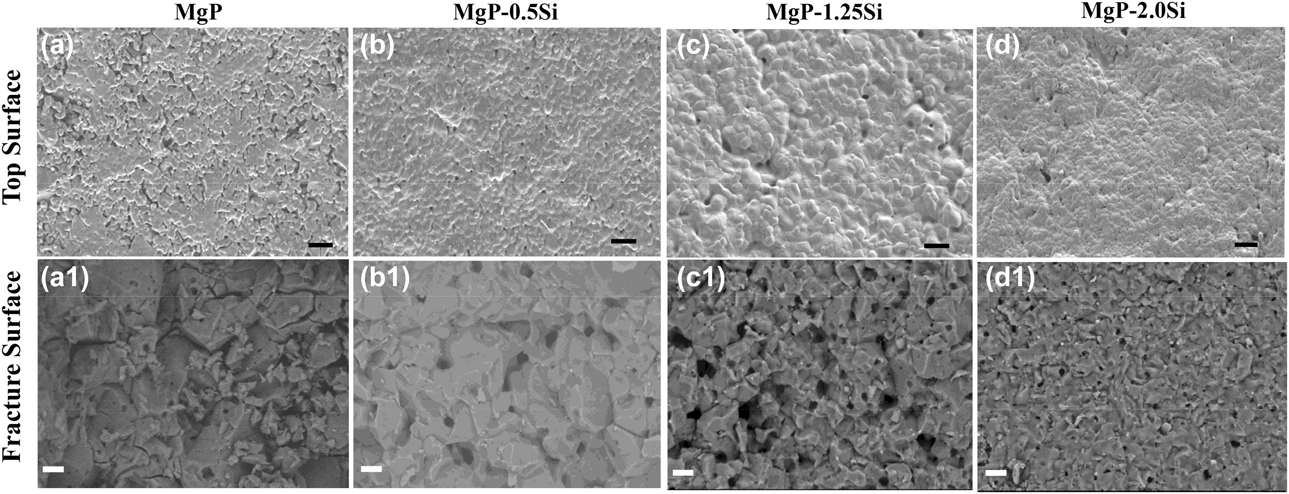
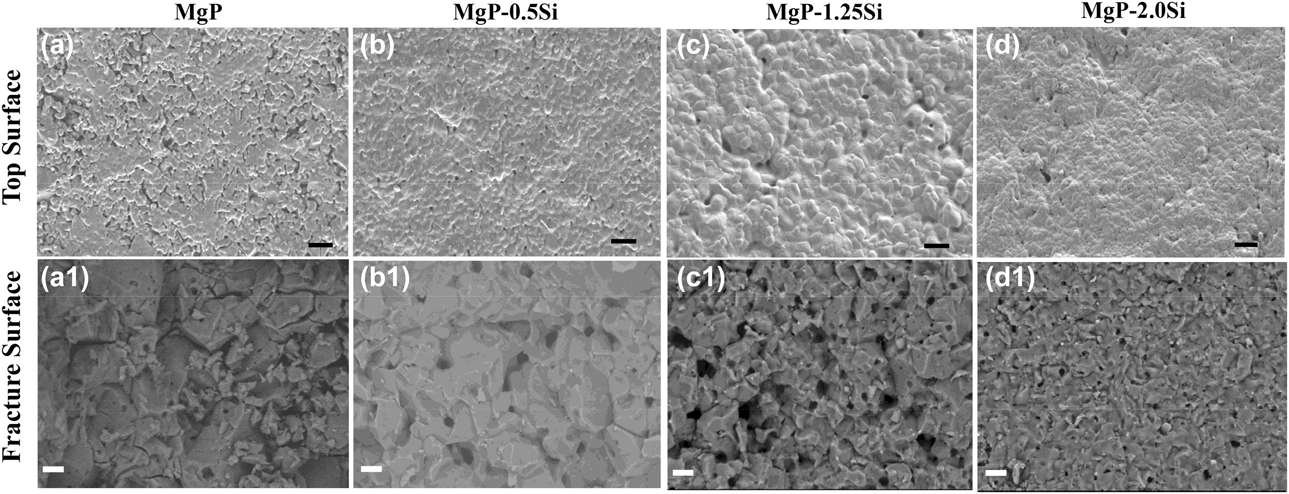
Table I shows the relative density of MgP, MgP–0.5Si, MgP–1.25Si, and MgP–2.0Si. Si-doped MgP bioceramics showed higher density than undoped MgP. Corroborating the density results, top surface SEM images showed denser microstructure for Si-doped samples, as shown in Figs. 2(a)–2(d). The surface texture showed grains are entangled in Si doped MgP. The mean grain size of these ceramics followed a decreasing trend with the increasing Si concentration. Table I shows open porosity (%) in the sintered ceramics, measured by Archimedes’ principle. Around 60% of pores were open in sintered MgP ceramics, whereas 49% of the pores in MgP–0.5Si samples were open pores compared to that of 35% for MgP–2.0Si samples. The grain diameter of pure MgP was 39.37 ± 13.25 µm, which became 14.16 ± 1.77 µm, 12.26 ± 1.58 µm, and 9.01 ± 0.96 µm for MgP–0.5Si, MgP–1.25Si, and MgP–2.0Si, respectively.
Relative density, grain size, and open porosity of pure and Si-doped MgP samples.

Top surface (a–d) and fracture surface (a1–d1) SEM images of the as-prepared undoped and Si-doped MgP samples (scale bar represents 20 µm).
In vitro degradation in SBF
Sample weight loss and degradation media analysis
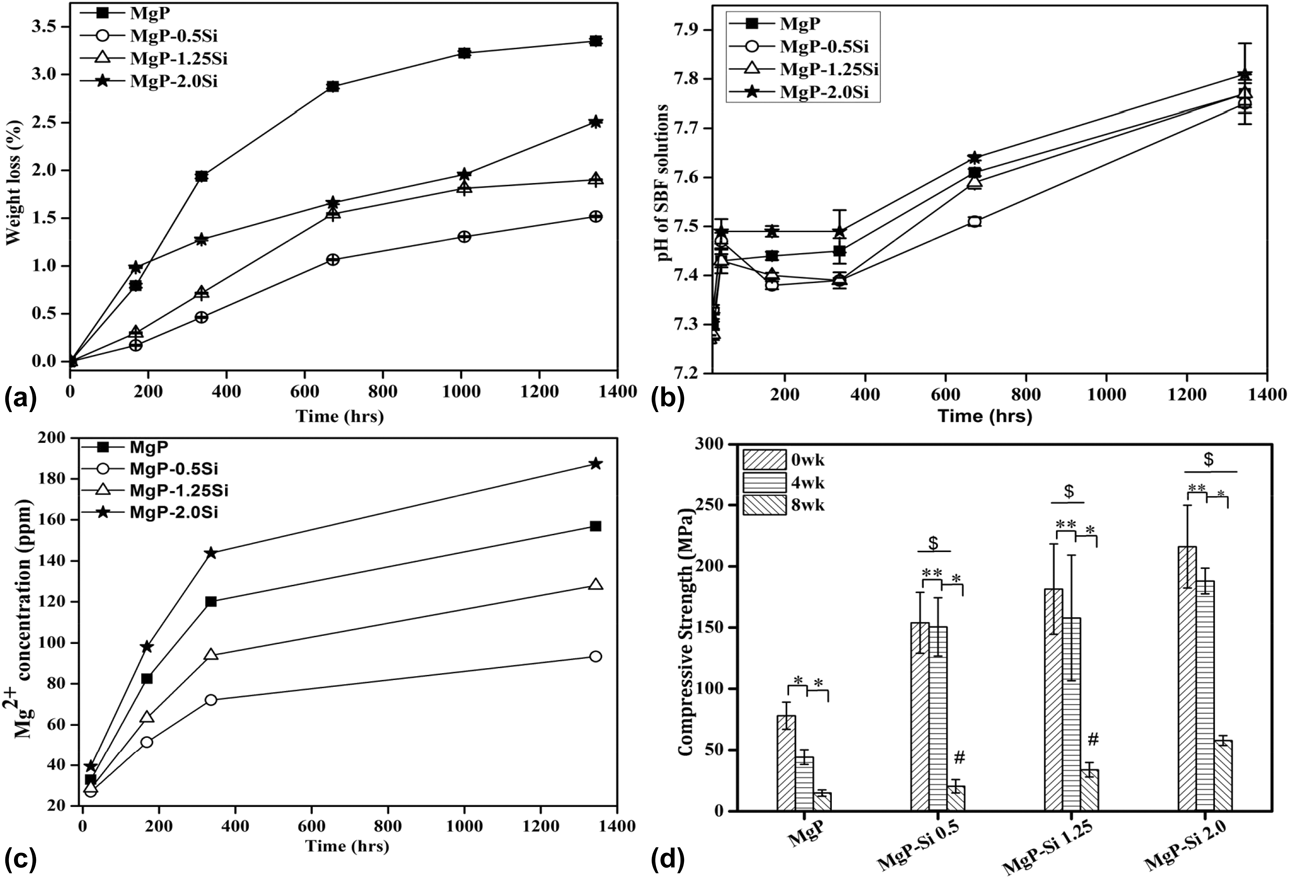
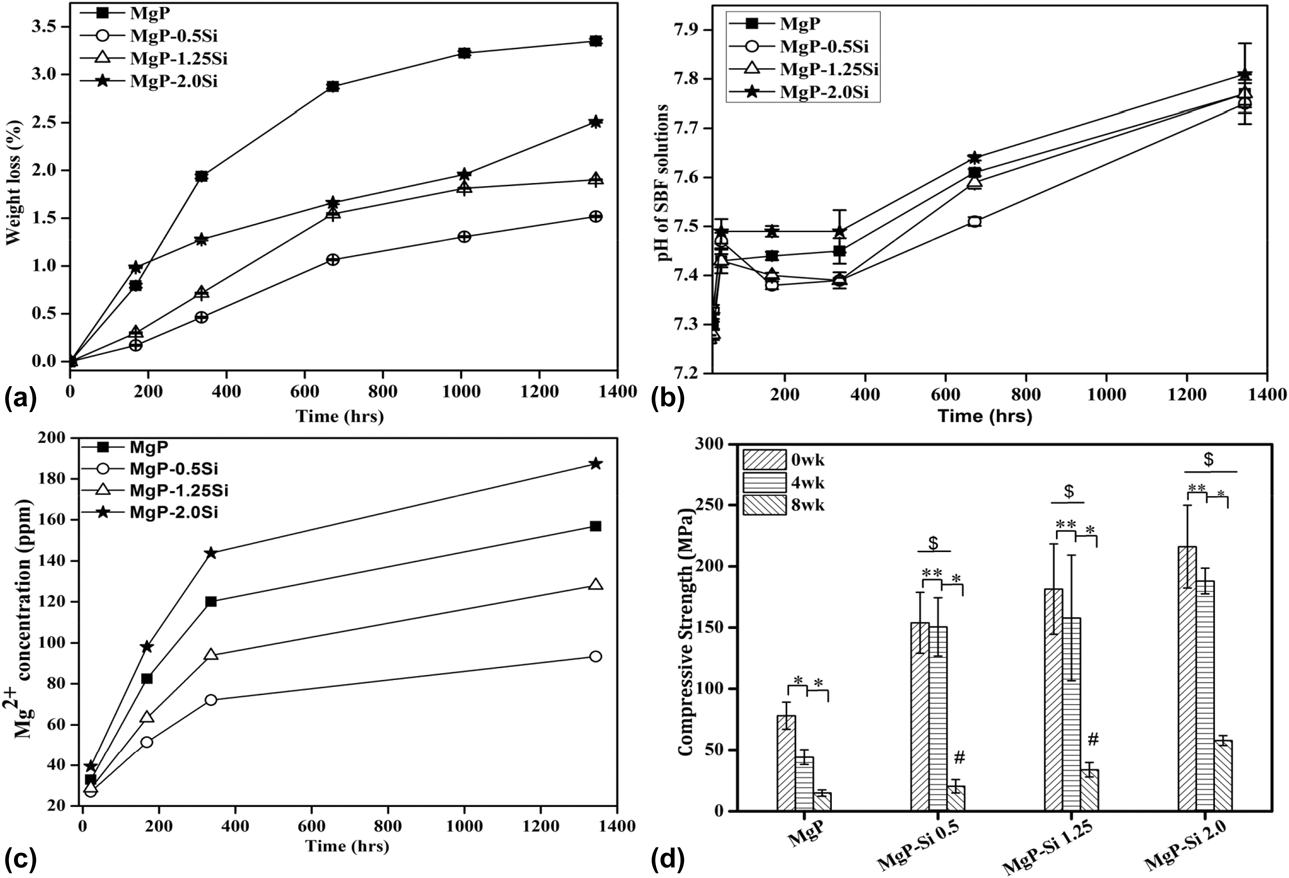
Degradation characteristics of all the MgP samples were studied by immersing in SBF for 8 weeks. Figure 3(a) shows weight loss behavior of MgP samples as a function of soaking time. All the samples lost weight during the immersion period. After 8 weeks, MgP, MgP–0.5Si, MgP–1.25Si, and MgP–2.0Si samples showed a weight loss of 3.35(±0.02)%, 1.52(±0.07)%, 1.9(±0.05)%, and 2.51(±0.01)%, respectively. Figure 3(b) presents the change in pH of the degradation media as a function of immersion time for MgP samples. The pH values were noted to be within the physiological range. After 8 weeks, the pH values were 7.77 ± 0.02, 7.75 ± 0.04, 7.77 ± 0.03, and 7.81 ± 0.06 for MgP, MgP–0.5Si, MgP–1.25Si, and MgP–2.0Si, respectively. Mg ion concentration in the degradation media also increased with time for all the MgP samples and is shown in Fig. 3(c). Mg2+ ion release was highest for MgP–2.0Si, while the lowest was for MgP–0.5Si samples.
(a) Weight loss, (b) change in solution pH, (c) Mg ion concentration in SBF, and (d) compressive strength as a function of immersion time. (* P < 0.05, ** P > 0.05, $ P < 0.05 compared with MgP, # P > 0.05 compared with MgP, n = 5).
Surface and surface deposition analysis
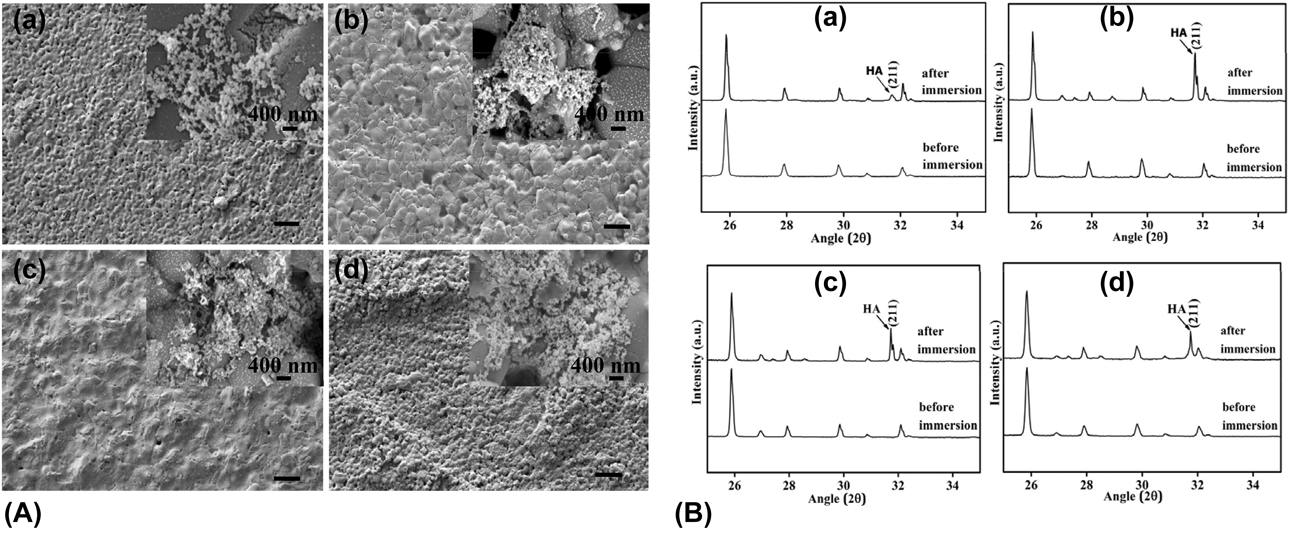
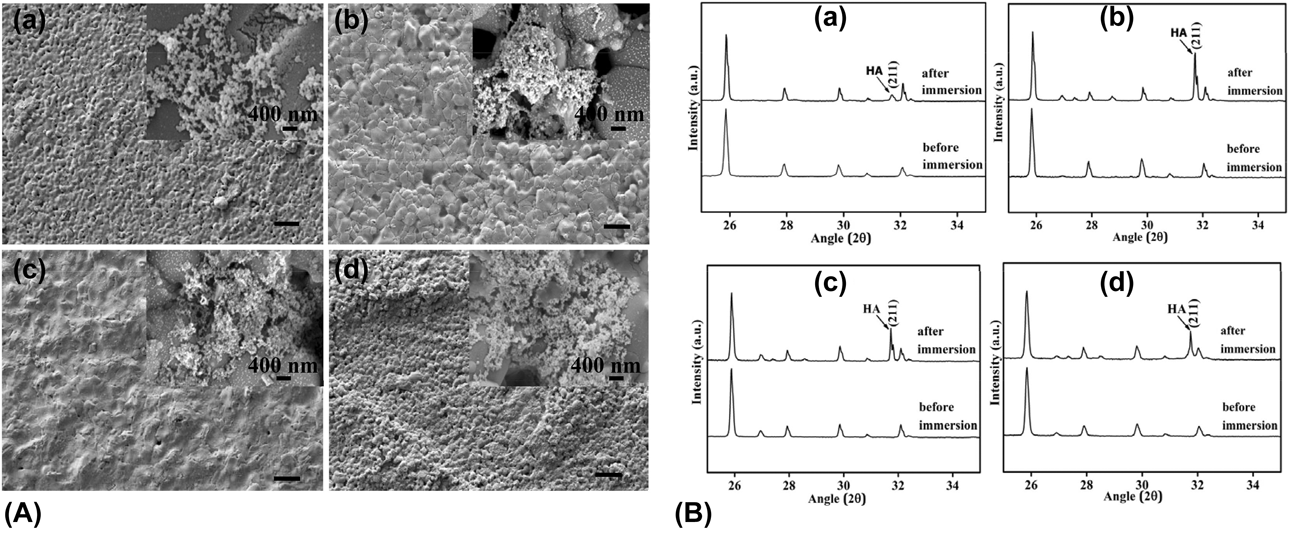
Figures 4(A)(a–d) show the surface features of the samples after soaking in SBF for 8 weeks. Morphological changes along with increased porosity were observed irrespective of composition. SEM analysis (inset images) showed that tiny ball-like apatite layer deposited at the degraded grain boundary regions. Energy dispersive X-ray spectroscopy (EDX) spectra (Fig. S1) also show the presence of Ca, which supports the claim that the deposition is HA. The surface depositions were further analyzed by XRD, and the results are shown in Fig. 4(B). Peaks corresponding to HA were found in the XRD spectra, confirming the deposits to be HA.
(A) Surface morphology of pure and doped MgP after 8 weeks of immersion (scale bar represents 20 µm). Inset shows deposition on surfaces. (B) Post-immersion XRD patterns of pure and doped MGP: (a) MgP, (b) MgP–0.5Si, (c) MgP–1.25Si, and (d) MgP–2.0Si.
Strength degradation in SBF
Figure 3(d) shows the measured compressive strength of undoped and Si-doped MgP samples. The strength was measured for before immersion and after immersion (4 and 8 weeks) in SBF. The as-sintered samples showed an increasing trend of strength with the increasing concentration of Si in MgP ceramics. The initial strength was 53.73(±18.22) MPa for pure MgP, which increased to 153.92(±24.83) MPa, 181.5(±36.85) MPa, and 216.08(±33.72) for MgP–0.5Si, MgP–1.25Si, and MgP–2.0Si, respectively. After soaking in SBF, all the samples showed decrease in strength with composition-dependent manner.
µ-CT analysis
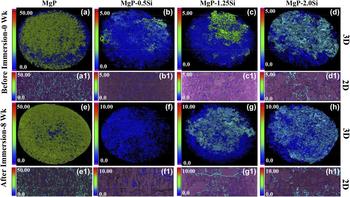
Porosity and their distribution in pure and Si-doped MgP samples were analyzed using µ-CT and are represented in Fig. 5. The 3D rendered images of the as-prepared samples [Figs. 5(a)–5(d)] showed that overall porosity was highest for pure MgP ceramics, which decreased with Si incorporation. The results are also supported by 2D µ-CT images of the respective samples. To access the increased porosity, 8 week immersed samples were also analyzed using µ-CT [Figs. 5(e)–5(h)]. As evident, porosity increased for all the samples, correlating to the weight loss results.
µ-CT images showing 3D (a–d) and 2D (a1–d1) pore distribution of MgP samples before immersion in SBF. (e–h) 3D and (e1–h1) 2D pore distribution after immersion of MgP samples in SBF.

In vitro cytocompatibility
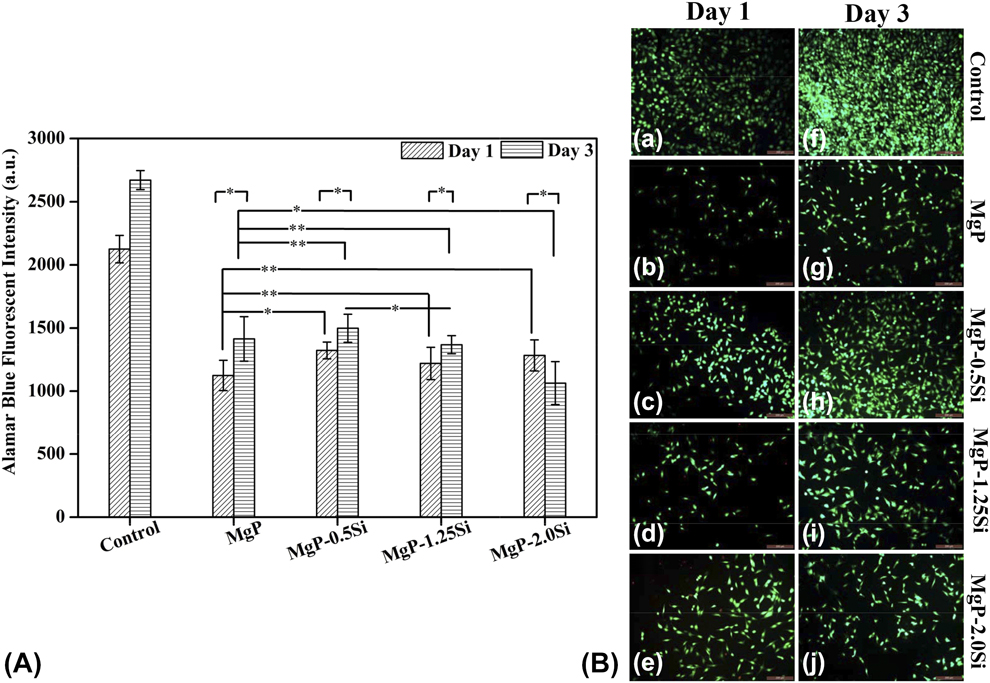
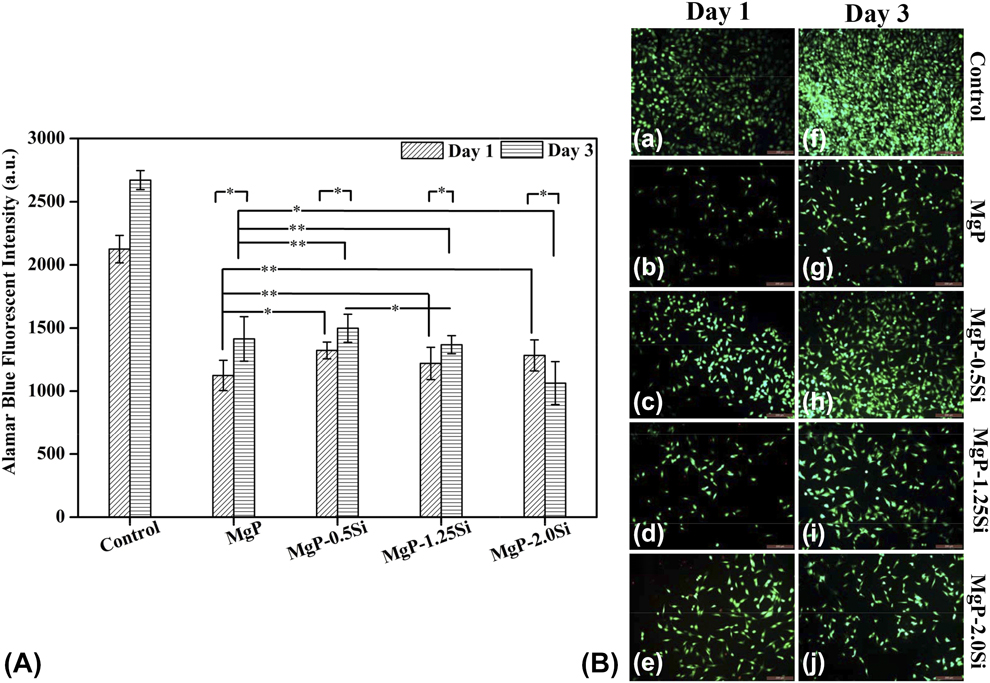
MG-63 osteoblast-like cells attachment and proliferation were evaluated at day 1 and day 3. Figure 6(A) shows cell proliferation for undoped and Si-doped MgP samples. Cell proliferation increased for doped samples compared with undoped MgP after day 1. At day 3, significantly enhanced cell proliferation was observed for MgP–0.5Si. The viable cells on the samples were visually verified by using live/dead imaging technique and are shown in Fig. 6(B). At day 1, high numbers of live cells were observed for Si-doped samples, while few dead cells can be seen for MgP–1.25Si [Fig. 6(B)(d)] and MgP–2.0Si [Fig. 6(B)(e)] samples. After day 3, highest numbers of live cells were observed for MgP–0.5Si among all the samples.
(A) MG-63 cell proliferation after 1 and 3 days of culture (* P < 0.05, ** P > 0.05, n = 9). (B) Live/dead imaging of MG-63 cells after (a–e) day 1 and (f–j) day 3 (scale bar = 200 µm).
In vivo bone regeneration
Radiography, SEM, and µ-CT analysis
Figure S2 shows the sequential radiographic images that were captured to locate the radiodense implants within the bone. No abnormal behavior in bone tissue was observed near the defect region. At 0 days, the control sample showed a radiolucent defect zone, while a radio dense cylindrical implant was appeared well fitted in the defect region. After 30 days of surgery, cortical line was observed over the defect site control specimen, and the radiographic images of undoped and Si-doped MgP samples had good association with the host bone. After 90 days of surgery, the defect without implant was filled with nonrigid osseous callus, while the radio-opaque ceramic implants found to be irregular at peripheral region with reduced size compared with the original implant size. This reduction in size indicates the dissolution of the implants in vivo.
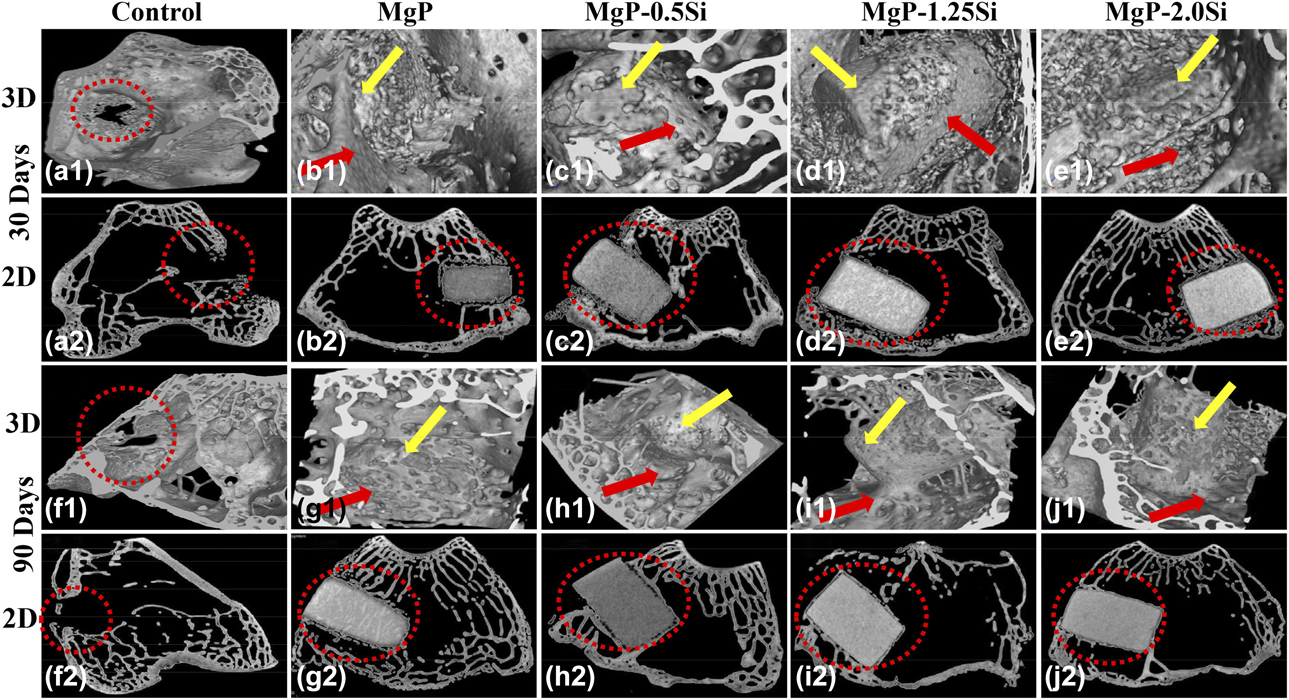
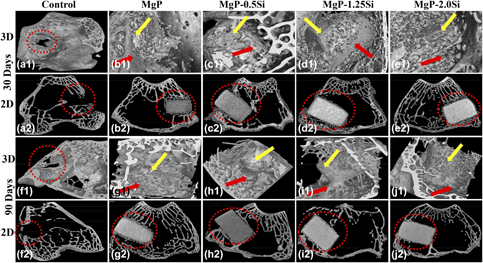
µ-CT technique was employed to study the bone material interaction of retrieved femoral bone specimens and is represented in Fig. 7. After 30 days of implantation, the 3D images show that the ceramic implants were partially covered by newly formed porous bone. The porous strut network formation was observed for pure and 0.5 wt% Si-doped samples. The representative 2D µ-CT images [Figs. 7(a2)–(e2)] also showed a thin layer of porous bone network formation around the ceramic implant, which indicates the bone regeneration ability of pure and Si-doped MgP ceramics in vivo. Bone material interaction after 90 days of the operation also studied. The control sample without implantation showed that the defect was not filled with new bone tissue after 90 days. The 3D µ-CT images showed that the implants were covered up from all the directions with the bone network [Figs. 7(f1)–(j1)]. The pure MgP sample showed that newly formed bone completely covered up the implant surface. The thickness of bone strut increased for Si-doped MgP compared with 30 days samples. Extended new bone area along with thicker strut was observed for MgP–0.5Si and MgP–1.25Si compared with MgP–2.0Si ceramics. The 2D µ-CT images [Figs. 7(f2)–(j2)] also represent the prominent bone formation and maturation around the implant.
3D (a1–e1) and 2D (a2–e2) µ-CT images of bone–implant interface of control, undoped, and Si-doped MgP after 30 days of implantation. (f1–j1) 3D and (f2–j2) 2D µ-CT images of bone–implant interface after 90 days (red dotted ring: defect site; yellow arrow: implant material; red arrow: new bone formation around the implant).

The gap bridging capacity between bone and implant material was studied by SEM images and is shown in Fig. S3. The 30 days images showed good bone and implant bonding for pure and 0.5 wt% Si-doped samples. At the same time point, a small fissure gap can be seen for MgP–1.25Si and MgP–2.0Si samples. After 90 days of the operation, the gap between bone and ceramic implant was completely filled up by the formation of new bone.
Fluorochrome labeling and histological analysis
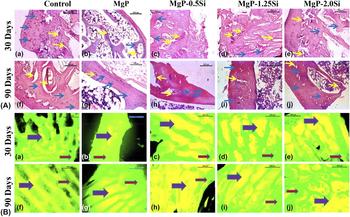
Figure 8(A) shows the histological analysis of interface of bone and the implant material to study the cellular level behavior. After 30 days, the histological hematoxylin and eosin (H&E) staining of control sample showed the osseous tissue consisting of scanty number of Haversian canals with peri-cortical lacunae and few sinusoidal spaces. The cement line formation was observed for undoped MgP sample. The histological analysis of MgP–0.5Si indicated that angioinvasion was prominent and medullary cavity had abundant RBCs, mononuclear cells, osteoblasts, and some fibrinous threads, whereas MgP–1.25Si and MgP–2.0Si samples showed moderate amount of angioinvasion. The medullary cavity contained RBCs, mononuclear cells, and few osteocytes, indicating moderate repairing process. After 90 days, histological analysis of MgP–1.25Si and MgP–2.0Si samples indicated newly formed bony matrix containing moderate amount of Haversian canal, bony lamellar structure, and fibrocollagenous mass. The medullary cavity had few adipose tissue and abundant mononuclear cells, RBCs, and fibrinous thread. The MgP–0.5Si samples after 90 days showed well-formed bony tissue containing sufficient amount of Haversian canal, bony lamellae, and fibrocollagenous structures. Few places were invaded by osteoblast for remodeling of bones, and the medullary cavity contained abundant RBCs, few fibrinous threads, and profuse mononuclear cells.
(A) Histological images of bone–implant interface at (a–e) 30 days and (f–j) 90 days (scale bar = 200 µm). (B) Fluorescence images of host bone–implant interface of undoped and Si-doped MgP for (a–e) 30 days and (f–j) 90 days (bright yellow region shows new bone formation and green region shows the old bone) (scale bar = 500 µm).
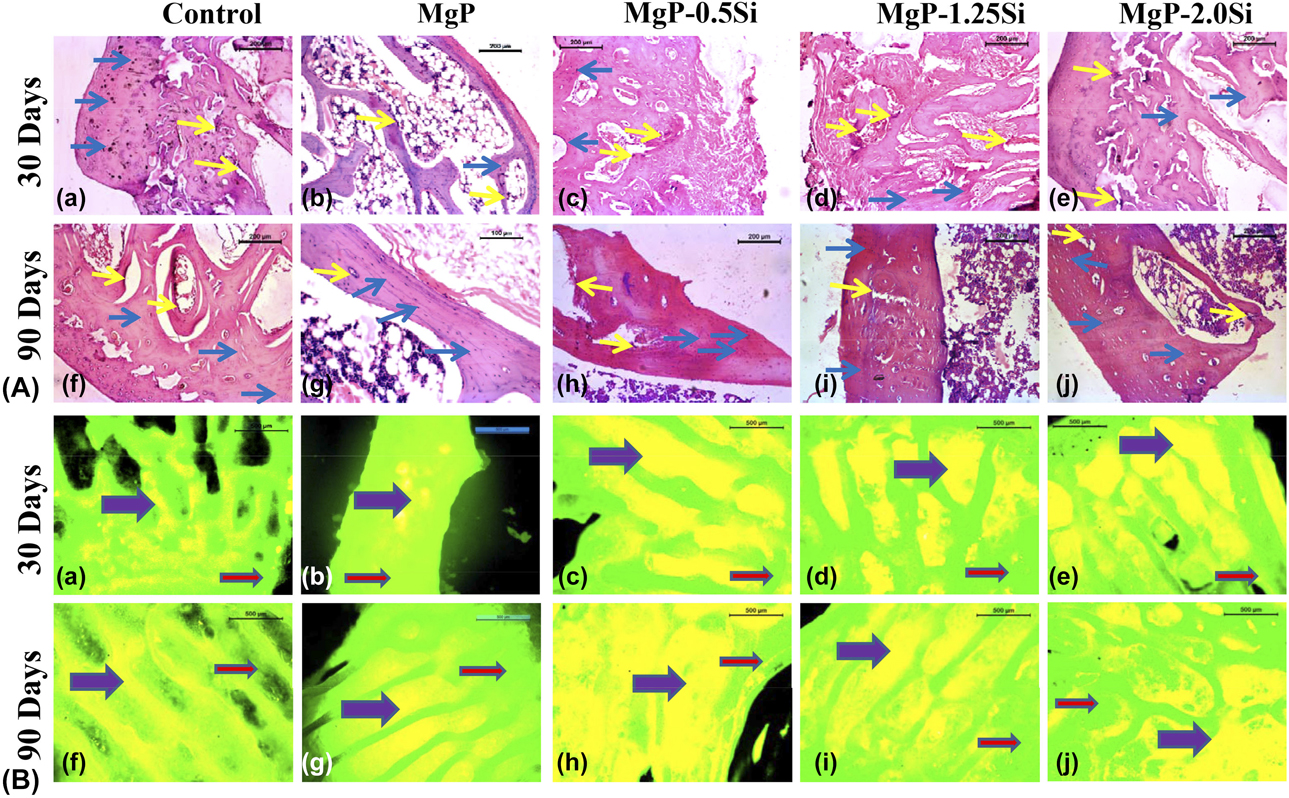
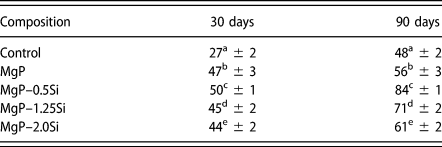
New bone formation was quantitatively measured by OTC labeling after 30 and 90 days of implantation and is shown in Fig. 8(B) and tabulated in Table II. Under ultraviolet (UV) radiations, the newly formed bone emits bright golden yellow fluorescence and old mature bone emits dark green fluorescence from the OTC-labeled samples. At 30 day, the control sample showed golden yellow plaques of tiny newly formed osseous tissue (27.35 ± 1.9%) in the field of deep sea green colored background. At the same time point, the 0.5 wt% Si-doped MgP bone section showed abundance of yellow fluorescence color from new osseous tissue (50 ± 1%) in the background by sea green colored host tissue. In the same time duration, the photomicrograph of MgP–1.25Si and MgP–2.0Si specimens showed 45 ± 2% and 44 ± 2% of newly formed osseous tissue in the healed area. After 90 days of surgery, the enhanced bone formation was observed for Si-doped MgP samples compared with pure MgP sample.
Percentage of new bone formation in defect site of undoped and Si-doped MgP samples.
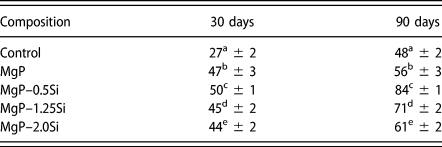
Means (n = 4) along with different letters (a–e) above each value differ significantly (P < 0.05) among the treatments (one-way ANOVA).
Discussion
To develop a degradable biomaterial, it is essential to study the degradation kinetics under physiological condition. The degradation rate should be most appropriate, so that the cell–material interface could expedite the bone remodeling process by recruiting enough number of cells. In the present study, the degradation rate of the samples was checked by measuring the weight loss after soaking in SBF. Addition of Si dopants increased the density of the MgP samples, which decreased the dissolution rate of the doped samples. SiO2 acts as sintering additives, which increases the lattice diffusions and reduces grain boundary migration. The overall result is increased densification. MgP–2.0Si was the densest (93.1 ± 0.87) sample, which showed 2.51% weight loss compared with that of 3.35% for pure MgP. The dissolution rate of the Si-doped samples decreased compared with the lesser dense undoped MgP samples. However, the degradation rate of the 2.0 wt% Si-doped samples was highest among the doped ceramics. The grain size became smaller with the increasing dopant concentration. The smaller grain size provides larger specific surface area for the interaction with the degradation media, which increases the dissolution rate. The strength of the samples showed increasing trend with the doping concentration because of the enhanced densification with composition-dependent manner. Substitution of ions is also confirmed by XRD analysis, which shows prominent peak shift due to doping. The less dense structure, confirmed by SEM and µ-CT analysis, enhances the degradation rate of undoped MgP, which results in 20.86 ± 6.24% open porosity after 8 weeks of immersion. Presence of large pores, as evident from fracture surface analysis, increases the degradation rate and generates large channeled open pores in undoped MgP ceramics. Small and isolated pores with high initial density in Si-doped MgP samples decreased the surface area for the interaction with degradation medium, which results in lower open porosity [6.41(±1.49)%, 7.33(±2.03)%, and 10.02(±0.65)% for MgP–0.5Si, MgP–1.25Si, and MgP–2.0Si, respectively, after 8 weeks of immersion]. Thus, the composition-dependent dissolution rate could be useful in designing tunable degradability according to the specific requirement. The slight increase in alkalinity in the degradation media, after 8 weeks, is due to ion exchange of cations from samples with H+/H3O+ ions of SBF. Surface analysis shows sporadic apatite crystal formation at the triple junctions. We believed that the degraded surface acts as isolated nucleation sites for apatite growth. However, the apatite layer did not deposit on the entire surface as the Mg ions might have restricted the growth of apatite crystal, as reported in literature [Reference Salimi, Heughebaert and Nancollas15]. Mg ion release from MgP–2Si was slightly higher than from pure MgP samples. One possible reason can be the surface deposition during dissolution in SBF. EDX spectra show that pure MgP samples have higher Ca and P deposition (in the form of HA most likely) than MgP–2Si. Higher HA deposition will also incorporate Mg ions in their crystal structure while reprecipitating on the sample surface. Therefore, it is possible that while MgP samples had higher degradation, it also had higher Mg incorporated HA deposition on the surface as well, which eventually resulted in lower effective Mg ions in the dissolution media. For resorbable ceramics, the strength starts to decrease with the dissolution of the material. So, it is important to assess the strength of the material for successful clinical application. In the present study, the compressive strength increased with the percentage of Si addition. The primary reason is the smaller grain size of the Si-doped samples. After immersion in SBF, significant drop in strength was noted with progression in time, which is primarily due to dissolution.
In vitro and in vivo biocompatibility of bioceramics is closely related to their chemical composition and degradation kinetics. Too rapid degradation often makes the bioceramic surface unsuitable for cell attachment and growth in in vitro conditions. In the present work, high initial adhesion of Mg63 cells followed by cell proliferation on MgP–0.5Si are due to lowest degradation rate coupled with the beneficial role of Si. Literature suggests that MG-63 cell proliferates at a higher rate when the culture medium is supplemented with Si ions [Reference Reffitt, Ogston, Jugdaohsingh, Cheung, Evans, Thompson, Powell and Hampson28]. The cellular proliferation is strongly dependent on the concentration of Si, and the following possible mechanisms are proposed in literature [Reference Shie, Ding and Chang36]. These Si ions are mitogenic for the bone cells. The presence of Si ions can enhance the DNA replication process and protein synthesis, which helps the cells to enter the stable phase and promotes proliferation. Also, Si ions can induce intracellular vacuoles formation by the process of internalization of the plasma membrane and molecules from the extracellular space. With progression of time, these vacuoles filled with nutrients coalesce to support the cell development and growth. Si ions also stimulate the secretion of prolyl hydroxylase for the synthesis of collagen. On the other hand, higher amount of Si ions concentration can show detrimental effect, which causes cellular detachment from any surface. Higher ionic concentration of Si increases the extracellular osmolarity, where the excessive osmolytes transport through the cell membrane, which eventually results in cell death. The synthesis of cell protein might have been inhibited by the amount of osmolytes and higher amount of Si ions. Highest degradation of MgP–2.0Si among the doped samples releases excess Si ions in the degradation media, which lead to cell death at day 3 from day 1 for these samples. Deleterious effect of the excess amount of Si ions on the cell attachment also reported in other literatures as well [Reference Zou, Ireland, Brooks, Rushton and Best37, Reference Han, Wu and Xiao38].
The present study involves bone regeneration properties of Si-doped MgP bioceramics. Histological evaluation of bone sections after 30 and 90 days of the operation suggests the cellular events in bone defect healing. Release of silicon ions from the doped MgP implants helps the bone marrow stromal cell differentiation along with osteoblastic proliferation, which is in usually apparent in bone histological study of all the doped implants at both time points. From the histological studies, it is evident that MgP–0.5Si sample, 30 days post-operatively, showed abundant osteoblast and angioinvasion, indicating initiation of reparative process, and at 90 days, the medullary cavity contained profuse mononuclear cells, few fibrinous threads, RBC, and abundant osteoclast, indicating a good reparative process. However, the other dopant concentration of the same Si series also showed the presence of actively proliferating osteoblasts indicative of ongoing remodeling episode. The outcome is the best in 0.5% Si dopant, which might be due to the stimulation of expression of the osteoblastic cells and angiogenesis by the ionic dissolution products. The lower degradation kinetics of MgP–0.5 samples and therefore the control release of Mg2+ and Si4+ ions had the stimulatory effect on osteogenesis process. Previous results have shown that the local release of these ions have significant role in increased bone formation. For example, Si-incorporated HA ceramics enhanced the bone regeneration in rabbit model [Reference Hing, Revell, Smith and Buckland32]. The local release of Si helps in early stages of nodule formation and biomineralization [Reference Gough, Jones and Hench39]. It is also a key element for the synthesis and stabilization of collagen, which helps in the osteogenesis process [Reference Reffitt, Ogston, Jugdaohsingh, Cheung, Evans, Thompson, Powell and Hampson28]. On the other hand, the local release of Mg2+ ions also has the stimulatory effect on bone formation. Mg2+ ions can bind protein molecules as it is the cofactor of different enzymes and stimulates the adhesion, proliferation, and differentiation of osteoblastic cells [Reference Wu, Feyerabend, Schilling, Willumeit-Römer and Luthringer40]. These ions also play an essential role in the stabilization of DNA and RNA structure and bone remodeling [Reference Rude, Gruber, Wei, Frausto and Mills17, Reference Maguire and Cowan41].
In the present study, µ-CT is used to assess detailed in-growth of bone on the sample surfaces. MgP–0.5Si showed enhanced degradation of the implant and increase in bone regeneration at 30 days and complete thick closure of the defect area at 90 days compared with other samples of this Si series, which might be due to controlled release of Si4+ and Mg2+ ions. These release ions played a significant role in increased bone formation. This higher bone formation around MgP–0.5Si samples is due to the stimulating effects of the released Mg2+ and Si4+ ions, as explained before. These ions are known to activate the differentiation of osteoblasts. Si4+ ion is specifically known for stimulating angiogenesis and neovascularization process, which results in better overall bone regeneration [Reference Mao, Xia, Chang, Liu, Jiang, Wu and Fang42]. The results are also supported by the quantitative fluorochrome labeling.
Conclusions
In the present work, Si-doped MgP bioceramics were prepared by solid state synthesis method. Si incorporation was confirmed by XRD analysis which showed composition-dependent peak shift. All the Si-doped samples showed higher densification than pure MgP; whereas density decreased as wt% of Si increased from 0.5 to 2.0%. In vitro degradability of the samples was studied in SBF for up to 8 weeks. MgP–0.5Si (density = 91.50 ± 1.54) sample showed only 1.52% weight loss compared with that of 3.35% for pure MgP (90.15 ± 0.91). The low degradation rate of MgP–0.5Si sample increased the MG-63 cell attachment and proliferation from day 1 to day 3. Excessive degradation and static nature of the cell culture resulted in cell death for MgP–2.0Si samples. When implanted in rabbit femur, no adverse effects of Si doping were noticed, which is primarily due to the dynamicity at in vivo conditions. Qualitative analysis through µ-CT showed good implant–bone integration at both 30 and 90 days for pure and Si-incorporated MgP samples. However, OTC labeling results showed that nearly 84% bone had regenerated for MgP–0.5Si sample compared with their pure MgP counterpart after 90 days. To conclude, it can be said that low Si doping in MgP modulates their degradability, cytocompatibility, and in vivo bone regeneration in such a way that the material can be used to treat small scale bone defect or bone scaffold fabrication for better bone regeneration.
Experimental
Powder synthesis
MgP powder was prepared by reacting magnesium hydroxide [Mg(OH)2, 99.98%; Loba Chemie, India] with magnesium hydrogen phosphate trihydrate (MgHPO4.3H2O, 99.98%; Alfa Aesar, U.K.). Silicon dioxide (SiO2; Loba Chemie) was used as the precursor for Si. The dopant used were 0.5, 1.25, and 2.0 wt%, which were denoted as MgP–0.5Si, MgP–1.25Si, and MgP–2.0Si, respectively. Preparation of the doped powders is explained in a previous work [Reference Sarkar, Kumar, Devi, Ghosh, Nandi and Roy43]. Briefly, precursor powder was mixed in PM400 planetary ball mill at 300 rpm for 2 h, followed by drying and calcination at 1150 °C for 5 h. Φ 8 mm disc samples were prepared by uniaxial pressing in steel die and sintered at 1200 °C for 2 h. Similarly, Φ 3.5 mm × 4.5 mm and Φ 8 mm × 12 mm cylindrical samples were prepared for in vivo and compression tests, respectively.
Surface characterization
Phase purity of the as-prepared MgP powder and Si-doped samples were determined by XRD (Bruker-D8 ADVANCE) using Cu Kα radiation. The X-ray scanning was carried out over the 2θ range of 10°–50° at a scan rate of 0.05°/s. SEM (MERLIN; Carl Zeiss, Germany) was used to study the top surface and fracture surface morphology. EDX analysis was done simultaneously to determine elemental compositions.
In vitro mineralization
Degradation behavior of the pure and Si-incorporated MgP samples was investigated after immersion in SBF at 37 °C (S/L = 150 g/L) [Reference Kokubo and Takadama44]. The media were changed twice a week and the samples were taken out after 1, 2, 4, 6, and 8 weeks, rinsed, and dried before the weight loss calculations. Concentrations of metal ions, in the degradation media, were determined using inductively coupled plasma mass spectroscopy (Agilent/7500ce, USA). Relative density and porosity of the samples were calculated by Archimedes’ principle.
3D µ-CT analysis
The 3D structure of the samples and internal porosity were studied using µ-CT (Phoenix V|tome|xs, GE, Germany). The scanning parameters were as follows: voltage 100 kV, current 90 μA, exposure time 500 ms, and voxel size 10 μm. For one 360° angular rotation, 1000 2D images were captured. The 2D images were compiled using specialized software (VG studio MAX 2.2) to construct the 3D rendered models.
Mechanical testing
Compressive strength of MgP ceramic samples was evaluated using a universal testing machine (UTM) (KS50-Tinius Olsen, U.K.). A cross-head speed of 0.2 mm/min was used during the compression test. Five samples of each composition was used for statistical significance, and the results are represented as mean ± SD.
Cytocompatibility
Cytocompatibility of the MgP samples was evaluated as described in previous work [Reference Sarkar, Kumar, Devi, Ghosh, Nandi and Roy43]. Briefly, MG-63 cells were used to determine cytocompatibility of MgP and Si-doped MgP samples. Culture media were minimum essential medium (HiMedia, Mumbai, India) with 10% fetal bovine serum (FBS), 50 mg/mL gentamicin, 100 U/mL penicillin, and 100 mg/mL streptomycin. Cell density of 1 × 10⁵ cells/mL was used for the cell culture study. Cell proliferation was calculated at day 1 and 3 using alamar blue (HiMedia) assay. The preparation process of alamar blue solution is given in our previous work [Reference Sarkar, Kumar, Devi, Ghosh, Nandi and Roy43]. 500 µL of alamar blue solution and 500 µL of cell culture media supernatant were added in a 48-well plate and incubated in dark for 2 h. 100 µL of the resulted solution was put in a 96-well plate (in triplicate) and read at 590/35 nm (excitation wavelength 530/25 nm) using a multimode plate reader (BioTek, USA). Live and dead cells were imaged using Live/Dead kit (Invitrogen, USA) after day 1 and 3. Imaging was done by inverted fluorescence microscope (Leica DM IL LED Fluo, Germany).
In vivo biocompatibility
All the animal experiments were done after obtaining ethical permission from IAEC (Institutional Animal Ethical Committee), University of Animal and Fishery Sciences (WBUAFS), West Bengal, India [Approval No. IAEC/67(V) dated 28.07.2017]. Detailed experimental protocol is published in previous work [Reference Sarkar, Kumar, Devi, Ghosh, Nandi and Roy43]. The experimental groups are as follows: gr-1, the control (only defect); gr-2, MgP; gr-3, MgP–0.5Si; gr-4, MgP–1.25Si; and gr-5, MgP–2.0Si. Xylazine hydrochloride and ketamine hydrochloride were used as anesthetizer.
In the present study, we have used 24 New Zealand White rabbits weighing around 1.5 kg body weight of either gender. The total animals were randomly divided into four groups of six animals each. Bilateral surgery was performed, where in one leg, no implant was placed, i.e., only defect was made in all the animals, and in other legs, different compositions of Si-doped MgP were placed. In each time point, we have euthanized three animals from each group. During the experiment, anesthesia was accomplished by xylazine hydrochloride @6 mg/kg body weight (Xylaxin®; Indian Immunologicals, India) and ketamine hydrochloride (Ketalar; Parke-Davis, Hyderabad, India) @33 mg/kg body weight intramuscularly. After clipping, shaving, and painting with povidone–iodine and 75% ethanol solution, a 5-cm-long skin incision was made in the lateral aspect of distal femur in each animal. The femur bone was exposed by separating muscles and periosteum. Cylindrical bone defect of 8 mm × 12 mm size was created using dental micro motor drill and the respective implants were press-fitted except control defects. During drilling, continuous irrigation of cold sterile normal saline was made to avoid thermal necrosis of bone. Before implantation, gentamicin solution was flushed inside the defect. Finally, the muscle and subcutaneous tissue were sutured using chromic catgut (3–0) and skin by nylon following the standard approach. Postoperatively, all the animals received an intramuscular injection of antibiotic cefotaxime sodium (Inj. Taxim®−125 mg; Alkem, India) twice a day at 12 h interval for five days, and to reduce pain, meloxicam (Inj. Melonex®4 mg/mL; Intas Pharmaceuticals, India) was given 0.1 mL/animal IM for three days. After operation, all the rabbits were kept freely in a cage.
In vivo degradation and bone regeneration
Sequential radiographic imaging was performed immediately after implantation and at 30 and 90 days to check the position of the implants. Retrieved bone samples were studied by µ-CT with a voxel size of 10 μm [Reference Devi, Tripathy, Kumta, Nandi and Roy45]. Bone–implant interface of the dried samples was studied using SEM (ZEISS, EVO 60).
Histological evaluations
OTC dehydrate (Pfizer India, India) was used on 5th/6th day and 13th/14th day for 30 days and 65th/66th and 73rd/74th day for 90 days sample for double fluorochrome labeling of newly mineralized bone at a rate of 25 mg/kg of body weight. 15–20 µm thick undecalcified bone sections were prepared using slow speed diamond saw and observed under ultraviolet light (Leica DM 2000; Leica Microsystems). Under the UV light, old bone emits sea green color, while the new bone is golden yellow. Quantification of new bone was done using ImageJ software (National Institute of Health, USA) [Reference Devi, Tripathy, Roy, Lee, Kumta, Nandi and Roy46].
For histological analysis, retrieved bone samples were fixed in 4% paraformaldehyde, decalcified by Goodling and Stewart’s solution, embedded in paraffin, and sectioned into 5-mm-thick sections [Reference Devi, Tripathy, Roy, Lee, Kumta, Nandi and Roy46]. Bone sections were stained with H&E and studied under microscope.
Statistical analysis
Results such as wt% loss, pH, compressive strength, and cell proliferation assay are presented as mean ± SD (n = 5). Student’s t-test was used to evaluate statistical significance, where P < 0.05 was considered statistically significant. To determine statistical significance of new bone regeneration results, Tukey’s post hoc test of one-way analysis of variance (ANOVA) was used among the treatment groups.
Supplementary material
To view supplementary material for this article, please visit https://doi.org/10.1557/jmr.2019.367.
Acknowledgments
M.R. would like to acknowledge the financial assistance from Science and Engineering Research Board (SERB-SB/FTP/ETA-0114/2014), India, and technical personnel at the Central Research Facility, IIT-Kharagpur, for their support in µ-CT analysis. S.K.N. would like to acknowledge the support from the Honorable Vice-Chancellor, West Bengal University of Animal and Fishery Sciences, Kolkata.