1. Introduction
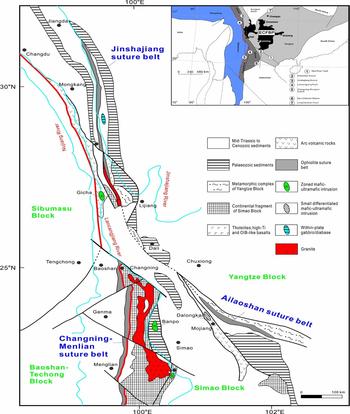
The eastern Palaeotethys oceans were generated by previous break-ups of the Gondwana supercontinent in the Southern Hemisphere during Late Palaeozoic time (Metcalfe, Reference Metcalfe1996, Reference Metcalfe2006, Reference Metcalfe, Hall, Cottam and Wilson2011, Reference Metcalfe2013; Mo et al. Reference Mo, Shen, Zhu, Xu, Wei, Tan, Zhang and Cheng1998; Zhong, Reference Zhong1998; Deng et al. Reference Deng, Wang, Li, Li and Wang2013). Relevant geological information has been well preserved in the Langcangjiang suture zone and the Ailaoshan–Jinshajiang suture zone (Metcalfe, Reference Metcalfe1996, Reference Metcalfe2006; Mo et al. Reference Mo, Shen, Zhu, Xu, Wei, Tan, Zhang and Cheng1998; Zhong, Reference Zhong1998; Wang et al. Reference Wang, Metcalfe, Jian, He and Wang2000a ; Yumul et al. Reference Yumul, Zhou, Wang, Zhao and Dimalanta2008; Zi et al. Reference Zi, Cawood, Fan, Wang and Tohver2012a , Reference Zi, Cawood, Fan, Wang and Tohver b , Reference Zi, Cawood, Fan, Tohver, Wang, Mccuaig and Peng2013; Lai et al. Reference Lai, Meffre, Crawford, Zaw, Halpin, Xue and Salam2013a , Reference Lai, Meffre, Crawford, Zaw, Xue and Halpin b ; Wang et al. Reference Wang, Wang, Chen, Yin, Wang, Zhang, Chen and Liu2013) (Fig. 1), rendering this region important in understanding the tectonic evolution of the Palaeotethys.
Index map for the continental blocks and suture zones of SW China (after Wang et al. Reference Wang, Metcalfe, Jian, He and Wang2000a ; Jian et al. Reference Jian, Liu, Kroner, Zhang, Wang, Sun and Zhang2009a ).

The eastern Palaeotethys oceans in southwestern China comprise the Langcangjiang, Jinshajiang and Ailaoshan oceans. Specifically, the Langcangjiang Ocean is the main ocean of the Palaeotethys which separated the Sibumasu–Baoshan Block from the Simao–Indochina Block (Metcalfe, Reference Metcalfe1996, Reference Metcalfe2006; Mo et al. Reference Mo, Shen, Zhu, Xu, Wei, Tan, Zhang and Cheng1998; Zhong, Reference Zhong1998). In comparison, the Ailaoshan and the Jinshajiang oceans are branch oceans (Mo et al. Reference Mo, Shen, Zhu, Xu, Wei, Tan, Zhang and Cheng1998; Zhong, Reference Zhong1998; Lai et al. Reference Lai, Meffre, Crawford, Zaw, Halpin, Xue and Salam2013a , Reference Lai, Meffre, Crawford, Zaw, Xue and Halpin b ) which separated the Simao–Indochina Block from the Yangtze Block. However, controversy surrounds the rift mechanism of the Ailaoshan Ocean. Metcalfe (Reference Metcalfe1996, Reference Metcalfe2006) suggested a subduction-related model in which the Ailaoshan Ocean developed from a back-arc basin due to the subduction of the main Palaeotethys Ocean plate, whereas Zhong (Reference Zhong1998) proposed a subduction-unrelated model in which the passive continental margin started to rift before the subduction of the main Palaeotethys Ocean plate.
Key to understanding the evolution of the Ailaoshan Ocean is investigation of the related ophiolite (Fan et al. Reference Fan, Wang, Zhang, Zhang and Zhang2010). Previous studies have divided the basaltic rocks (i.e. microgabbros and basalts) of the Ailaoshan ophiolite into two types (Zhang, Zhou & Li, Reference Zhang, Zhou and Li1995; Zhong, Reference Zhong1998): high-alumina type with >16% Al2O3 and low-alumina type with <16% Al2O3. However, the genesis of and relationship between these two types are still unclear. For instance, Mo et al. (Reference Mo, Shen, Zhu, Xu, Wei, Tan, Zhang and Cheng1998) and Shen et al. (Reference Shen, Qirong and Chenghuilan Mo1998a , Reference Shen, Qirong and Chenghuilan Mo b ) interpreted the two different types as having been generated by two series of magmas which derived from different-degree partial melting of a common source, while Zhang, Zhou & Li (Reference Zhang, Zhou and Li1995) suggested that their mantle sources were different.
In this paper, we present field, petrological and geochemical data for the basalts and microgabbros from the Shuanggou ophiolite, which is the best-preserved part of the Ailaoshan ophiolite belt. Elemental and Sr–Nd isotopic compositions indicate that the basalts and the microgabbros originated from different mantle sources. Overall, the Shuanggou microgabbros and basalts are suggested to be products of different genetic mechanisms: the microgabbros originated from moderate-degree partial melting of the asthenospheric mantle, whereas the basalts were the products of low-degree partial melting of a mixed lithosphere–asthenosphere source.
2. Geological background and petrography
The Ailaoshan suture zone is over 1000 km long, extending from northern Vietnam to northern Yunnan, SW China (Fig. 1) (Mo et al. Reference Mo, Shen, Zhu, Xu, Wei, Tan, Zhang and Cheng1998; Zhong, Reference Zhong1998; Yumul et al. Reference Yumul, Zhou, Wang, Zhao and Dimalanta2008; Lai et al. Reference Lai, Meffre, Crawford, Zaw, Halpin, Xue and Salam2013a , Reference Lai, Meffre, Crawford, Zaw, Xue and Halpin b ). It is the boundary between the Yangtze Block to the east and the Simao Block to the west, with hundreds of ophiolitic mafic-ultramafic rocks that lie between eastern metamorphic complexes and western arc-volcanic rocks.
The Simao Block, located southwest of the Ailaoshan suture zone, is bounded by the Langcangjiang tectonic zone to the west and the Ailaoshan suture zone to the east (Fig. 1). In this block, the basement is the Proterozoic metamorphic Damenglong and Chongshan complexes (Zhong, Reference Zhong1998; Wang et al. Reference Wang, Metcalfe, Jian, He and Wang2000a , Reference Wang, Fan, Zhang, Peng, Chen and Xu2006) with a Sm–Nd whole-rock isochron age of 1437±17 Ma (Wang et al. Reference Wang, Li, Duan, Huang and Chui2000b ). The oldest exposed sedimentary rocks are the Lower Palaeozoic metasediments which are uncomfortably overlain by Middle Devonian conglomerates. Further, all these units show similar lithology to those of the Yangtze Block, implying that the Simao Block was closely related to the Yangtze Block before Middle Devonian time (Zhong, Reference Zhong1998; Wang et al. Reference Wang, Metcalfe, Jian, He and Wang2000a , Reference Wang, Fan, Zhang, Peng, Chen and Xu2006).
The Ailaoshan ophiolite belt is exposed in the epimetamorphic belt between the Jiujia–Mojiang–Tengtiaohe fault and the Ailaoshan fault (Mo et al. Reference Mo, Shen, Zhu, Xu, Wei, Tan, Zhang and Cheng1998). It is associated with a high-grade metamorphic belt to the east and arc-volcanic rocks to the west. The eastern Ailaoshan high-grade metamorphic belt is composed of greywacke, schist, chert and exotic limestone which originated from the Yangtze continental margin (Leloup et al. Reference Leloup, Lacassin, Tapponnier, Schärer, Zhong, Liu, Zhang, Ji and Trinh1995; Searle et al. Reference Searle, Yeh, Lin and Chung2010). The western Ailaoshan volcanic belt exhibits significant tectonic links with the Indochina Block (Lai et al. Reference Lai, Meffre, Crawford, Zaw, Halpin, Xue and Salam2013a , Reference Lai, Meffre, Crawford, Zaw, Xue and Halpin b ). Many of the volcanic rocks are fault-bounded, disrupted and poorly defined (Fan et al. Reference Fan, Wang, Zhang, Zhang and Zhang2010; Lai et al. Reference Lai, Meffre, Crawford, Zaw, Halpin, Xue and Salam2013a , Reference Lai, Meffre, Crawford, Zaw, Xue and Halpin b ).
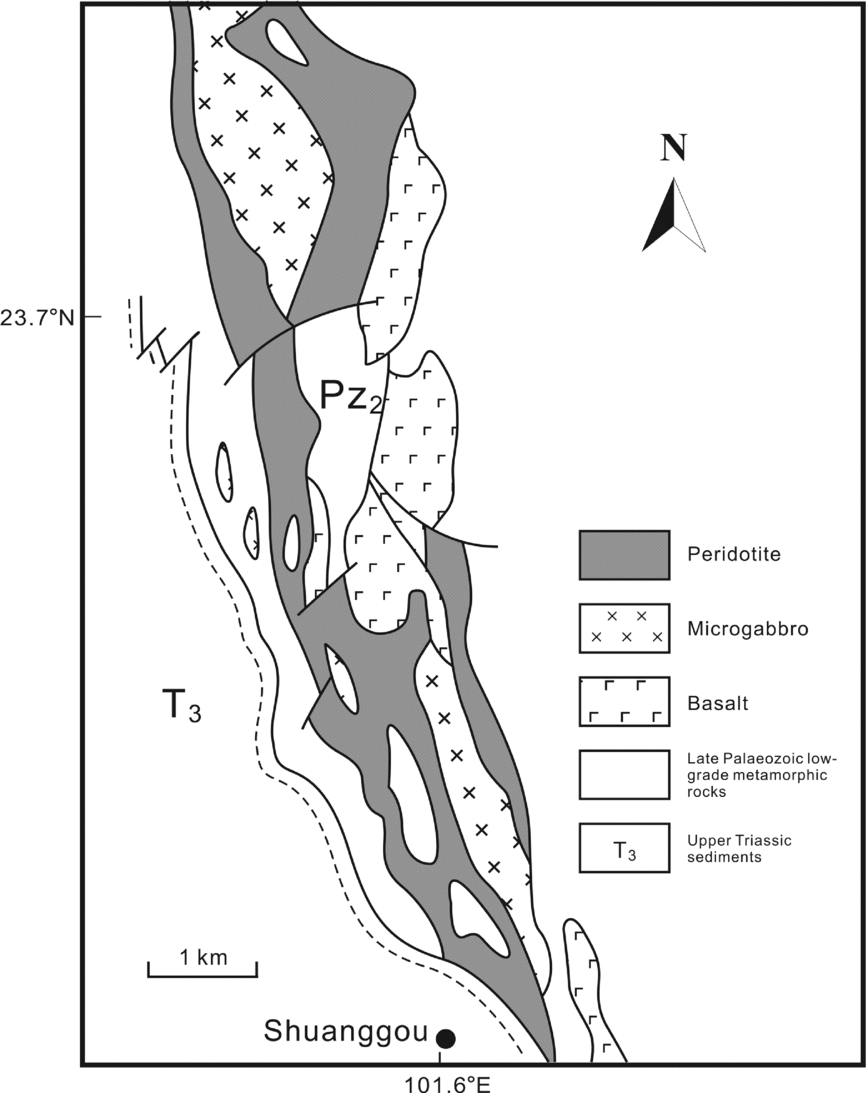
The Shuanggou ophiolite is the best-preserved part of the Ailaoshan ophiolite belt (Fig. 2). In the Shuanggou area, the ultramafic-mafic units have been properly preserved and studied. Specifically, the Shuanggou ophiolite contains typical tectonic peridotites (including lherzolite and harzburgite), gabbros, microgabbros and basalts (Mo et al. Reference Mo, Shen, Zhu, Xu, Wei, Tan, Zhang and Cheng1998; Shen et al. Reference Shen, Qirong and Chenghuilan Mo1998a , Reference Shen, Qirong, Huilan and Xuanxue b ). No layered gabbros or sheeted dykes have been recognized (Mo et al. Reference Mo, Shen, Zhu, Xu, Wei, Tan, Zhang and Cheng1998; Yumul et al. Reference Yumul, Zhou, Wang, Zhao and Dimalanta2008). The gabbro-microgabbros may directly cover the peridotites as the distance between peridotites and gabbro-microgabbros is only c. 0.5 m wide (Zhang, Zhou & Li, Reference Zhang, Zhou and Li1995). The basalts do not show any contact with the gabbro-microgabbros, but display fault contact with the peridotites (Zhang, Zhou & Li, Reference Zhang, Zhou and Li1995; Zhong, Reference Zhong1998). In summary, the Shuanggou ophiolite is quite different from those typical ophiolites (e.g. the Troodos ophiolite). Its thin crust and simple rock assemblage is probably due to the slow-spreading velocity and limited magma supply (Zhang, Zhou & Li, Reference Zhang, Zhou and Li1995; Zhong, Reference Zhong1998). A latest Devonian age for the ophiolite was obtained from lower concordia U–Pb intercept ages of 382.9±3.9 Ma for a gabbro sample and 375.9±4.2 Ma for a plagiogranite sample (Jian et al. Reference Jian, Liu, Kroner, Zhang, Wang, Sun and Zhang2009b ).
Geological map for the Shuanggou ophiolite (after Zhang, Zhou & Li, Reference Zhang, Zhou and Li1995).

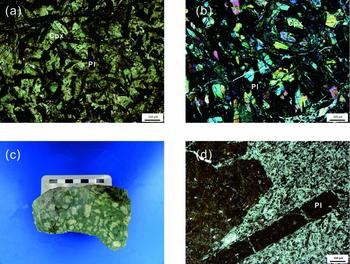
Results from eight microgabbro samples from dykes and seven basalt samples from lavas are reported in this study. All the rocks are slightly to moderately altered. The microgabbros exhibit typical ophitic texture and consist of plagioclase (c. 45%), clinopyroxene (c. 50%) and ilmenite (<5%) (Fig. 3a, b). Plagioclases range from subhedral to euhedral with small sizes. Clinopyroxenes are xenomorphic granular and have been altered to chlorite. The dominant crystallization order of the microgabbros is: plagioclase → clinopyroxene → ilmenite (Yumul et al. Reference Yumul, Zhou, Wang, Zhao and Dimalanta2008). The basalts have typical porphyritic texture with abundant plagioclase phenocrysts (5–40 modal %) (Fig. 3c, d). Groundmass ranges from microaphanitic texture to intersertal texture. The plagioclase phenocrysts are stripe-like and relatively large (1.0–4.0 mm in width; 2.0–9 mm in length). The main alteration types for the basalts are kaolinization, silicification and carbonatization.
(a) Microphotograph of the microgabbro (plane-polarized light) showing typical diabasic texture; (b) microphotograph of the microgabbro (perpendicular polarized light); (c) photographs of basalts with a large number of plagioclase phenocrysts; and (d) microphotograph of the plagioclase-phyric basalts (plane-polarized light).

3. Analytical methods
Major elements of whole rocks were determined in the ALS laboratory by using x-ray fluorescence spectrometry with <5% relative standard deviation. Trace elements of whole rocks were analysed by using an inductively coupled plasma mass spectrometry (ICP-MS) at the State Key Laboratory of Ore Deposit Geochemistry, Chinese Academy of Sciences (SKLODG) with an analytical precision better than 5%. The detailed procedure is described by Qi, Jing & Gregoire (Reference Qi, Jing and Gregoire2000).
Sr–Nd isotope analyses of whole rocks were performed on a Thermo Fisher Triton thermal ionization mass spectrometer (TIMS) at the SKLODG. The analytical procedures involves adding 0.11 g of rock powder to Teflon capsules with mixed HF+HNO3+HClO4. After complete dissolution of the sample, the solutions were then evaporated to dryness on a hot plate. A solution of 6 mol/L HCl was then added and evaporated to dryness (twice). The residue was dissolved with 1.5 mL HCl of 2.5 mol/L. After centrifugal separation, 1 mL supernatant was passed through a cation exchange resin (AG50W × 12) and 5 mol/L HCl to elute Sr. A solution of 6 mol/L HCl was used to elute rare Earth elements (REEs) and the solution was dried. A quantity of 0.1 mol/L HCl was passed through an anion exchange resin (P507), and 0.2 mol/L HCl was added to elute Nd. Mass fractionation corrections for Sr and Nd isotopic ratios were based on values of 86Sr/88Sr = 0.1194 and 146Nd/144Nd = 0.7219, respectively. Measured values for the NBS987 were 86Sr/88Sr = 0.710250±7 (2σ), and for BCR-2 and JNdi-1 standards were 146Nd/144Nd = 0.512612±8 (2σ) and 146Nd/144Nd = 0.512104±5 (2σ), respectively.
4. Analytical results
4.a. Major and trace elements
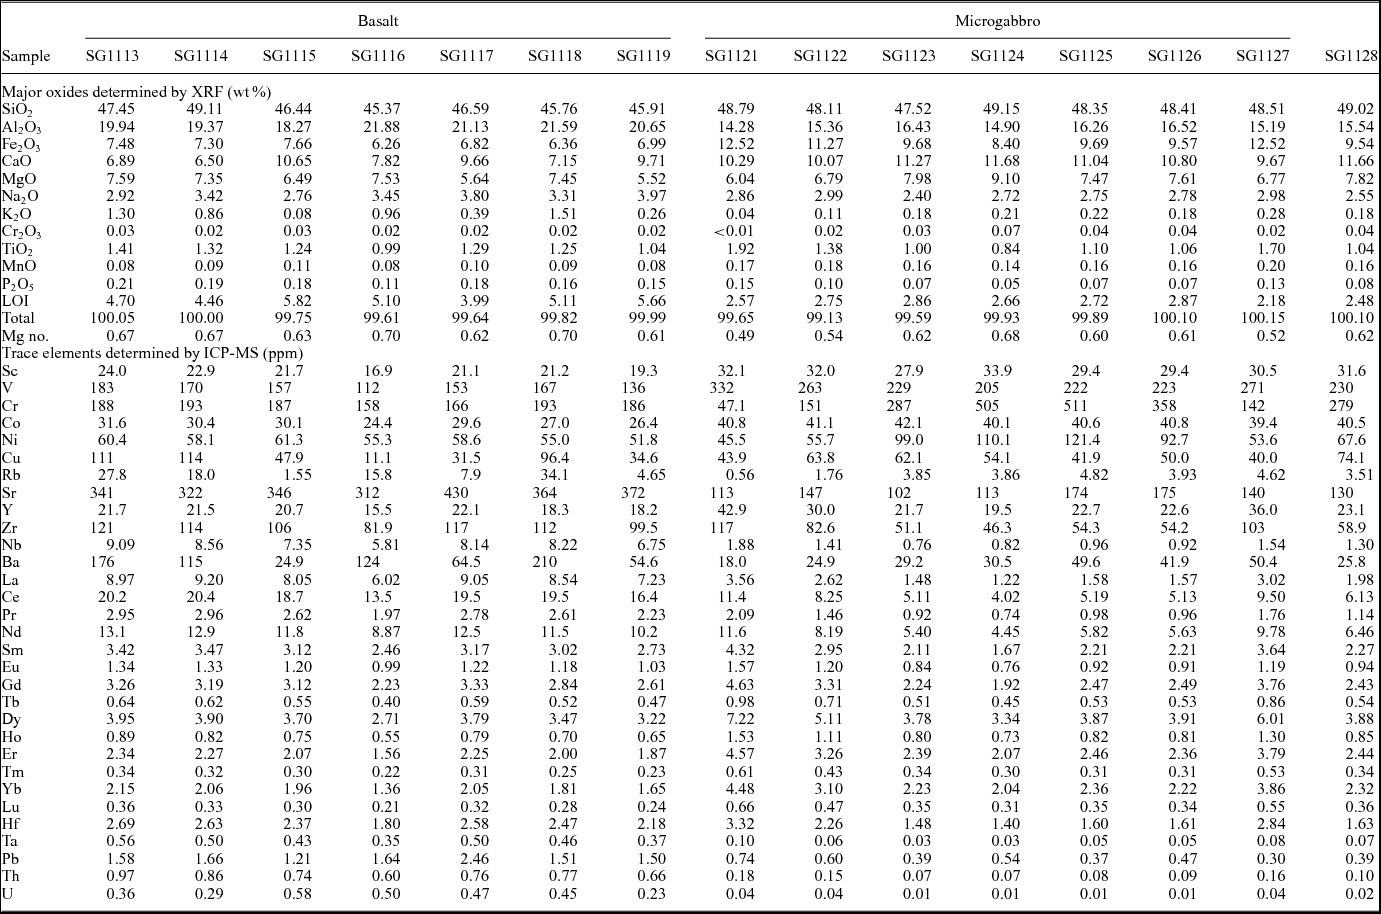
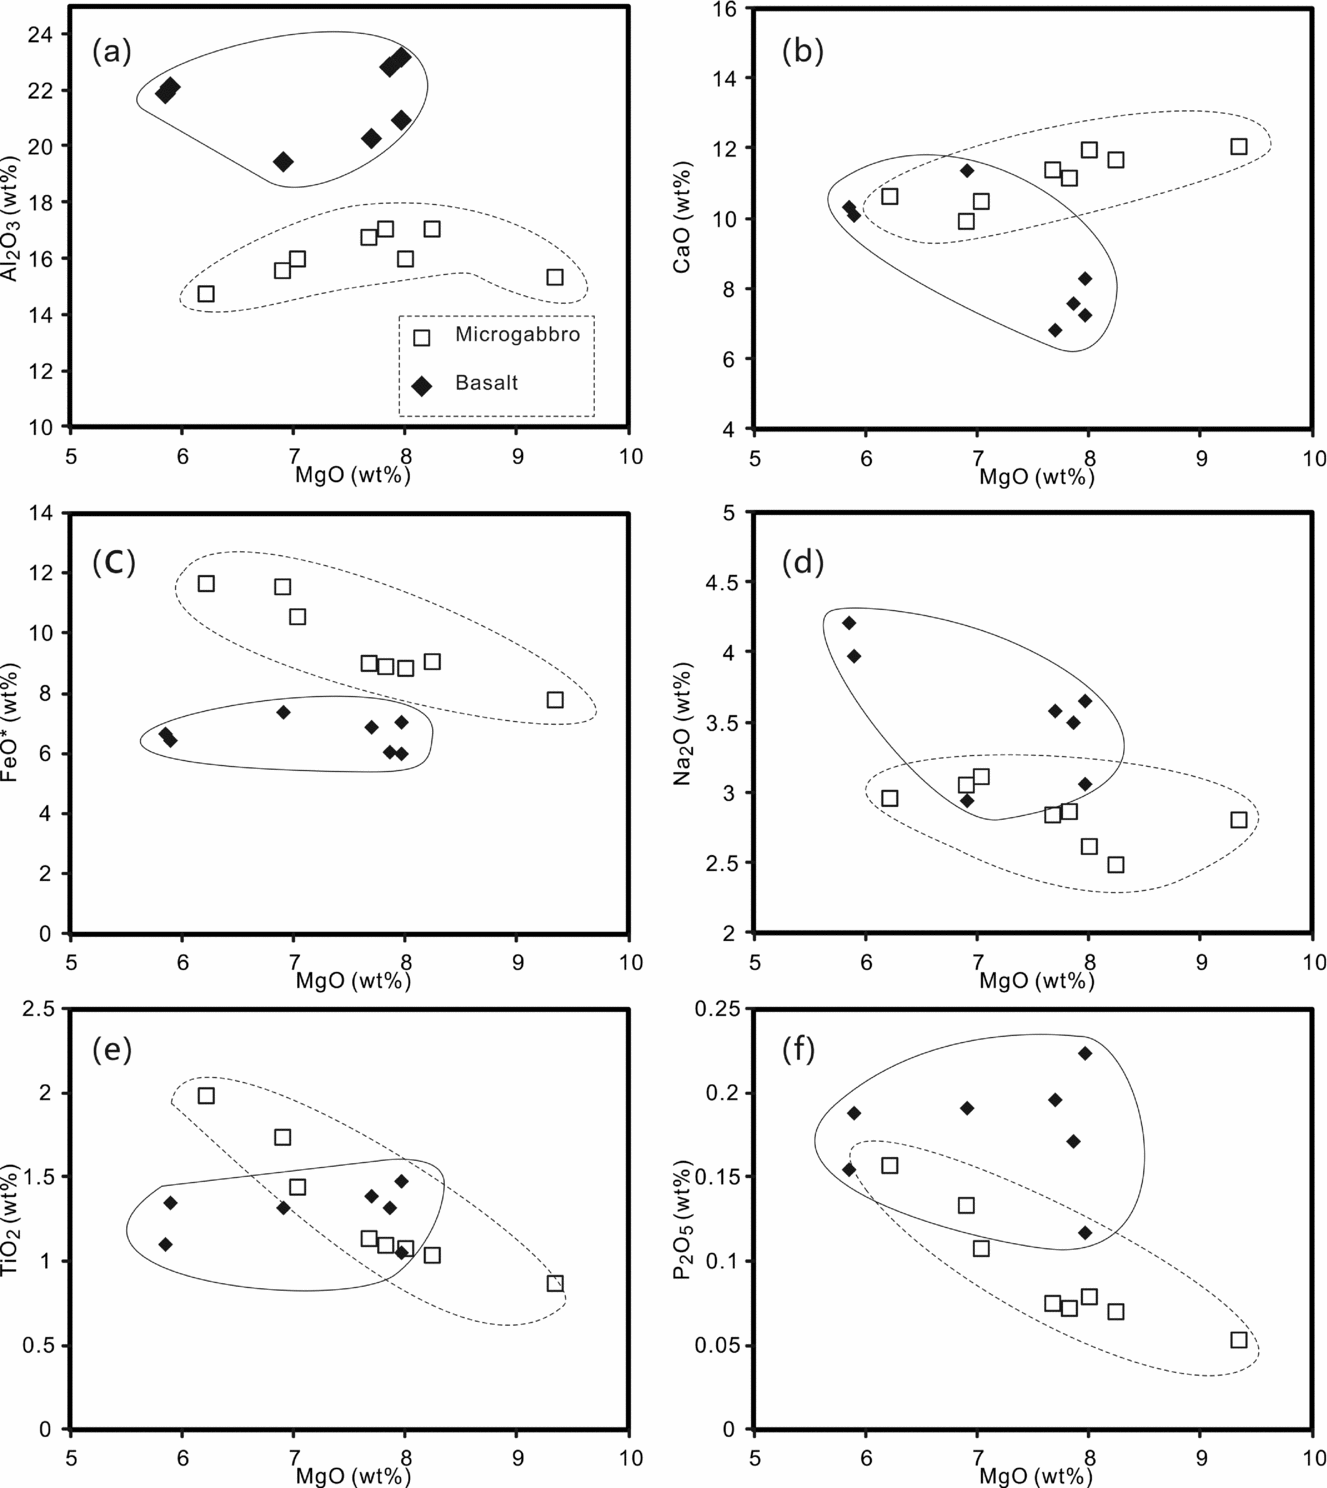
Geochemical data for major oxides and trace elements are listed in Table 1. In terms of alumina contents, the microgabbros (Al2O3 of 14.7–17.0%) belong to low-alumina type while the basalts (Al2O3 of 19.5–23.2%) belong to high-alumina type (Zhang, Zhou & Li, Reference Zhang, Zhou and Li1995; Zhong, Reference Zhong1998) (Fig. 4a). Selected major oxide contents are plotted versus MgO in Figure 4. The variations of MgO for the microgabbros (6.2–9.4%) are larger than those for the basalts (5.9–8.0%). For the microgabbro series, as MgO decrease both Al2O3 and CaO decrease while FeO, TiO2 and P2O5 increase. In contrast, these oxides show poor correlations for the basalt series.
Major oxide and trace element compositions of basalts and microgabbros from the Shuanggou ophiolite.

Diagrams of MgO versus selected major oxides for the Shuanggou basalts and microgabbros.

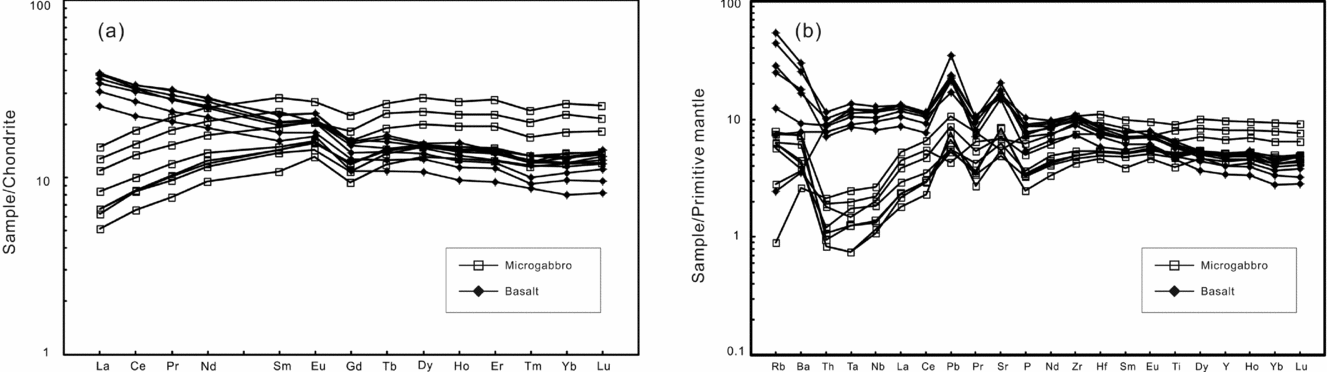
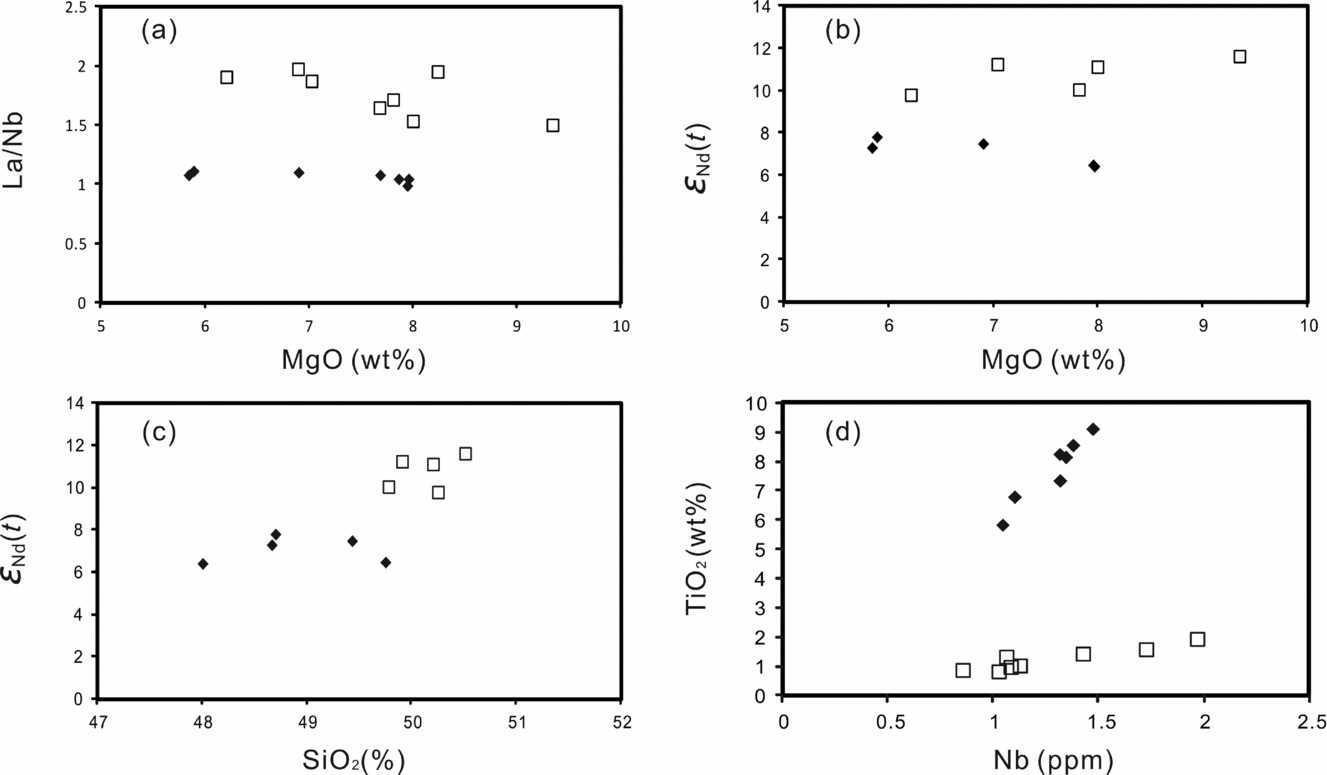
Chondrite-normalized REE patterns of the basalts and microgabbros are remarkably different (Fig. 5a). For the microgabbros, REE patterns are LREE (light rare Earth element) -depleted ((La/Yb)N of 0.43–0.61) with variable Eu anomalies (δEu of 0.97–1.29). For the basalts, REE patterns are LREE-enriched ((La/Yb)N of 2.95–3.20) with positive Eu anomalies (δEu of 1.14–1.27). Their primitive mantle-normalized trace element patterns are also different (Fig. 5b). Some microgabbros display slightly negative Nb–Ta anomalies, whereas other microgabbros and all the basalts do not exhibit any Nb–Ta anomalies. In addition, with decreasing MgO the ratios between trace elements vary in different ways; for instance, La/Nb ratios increase for the microgabbros but remain constant for the basalts (Fig. 6a).
(a) Chondrite-normalized REE diagrams and (b) primitive mantle-normalized incompatible element distribution spidergrams for the Shuanggou microgabbros and basalts. The normalization values are from Sun & McDonough (Reference Sun, McDonough, Saunders and Norry1989).

(a) MgO versus selected trace element ratios (La/Nb); (b) MgO versus ε Nd(t); (c) SiO2 versus ε Nd(t); and (d) Nb versus TiO2. Symbols are as for Figure 4.

4.b. Sr and Nd isotopes
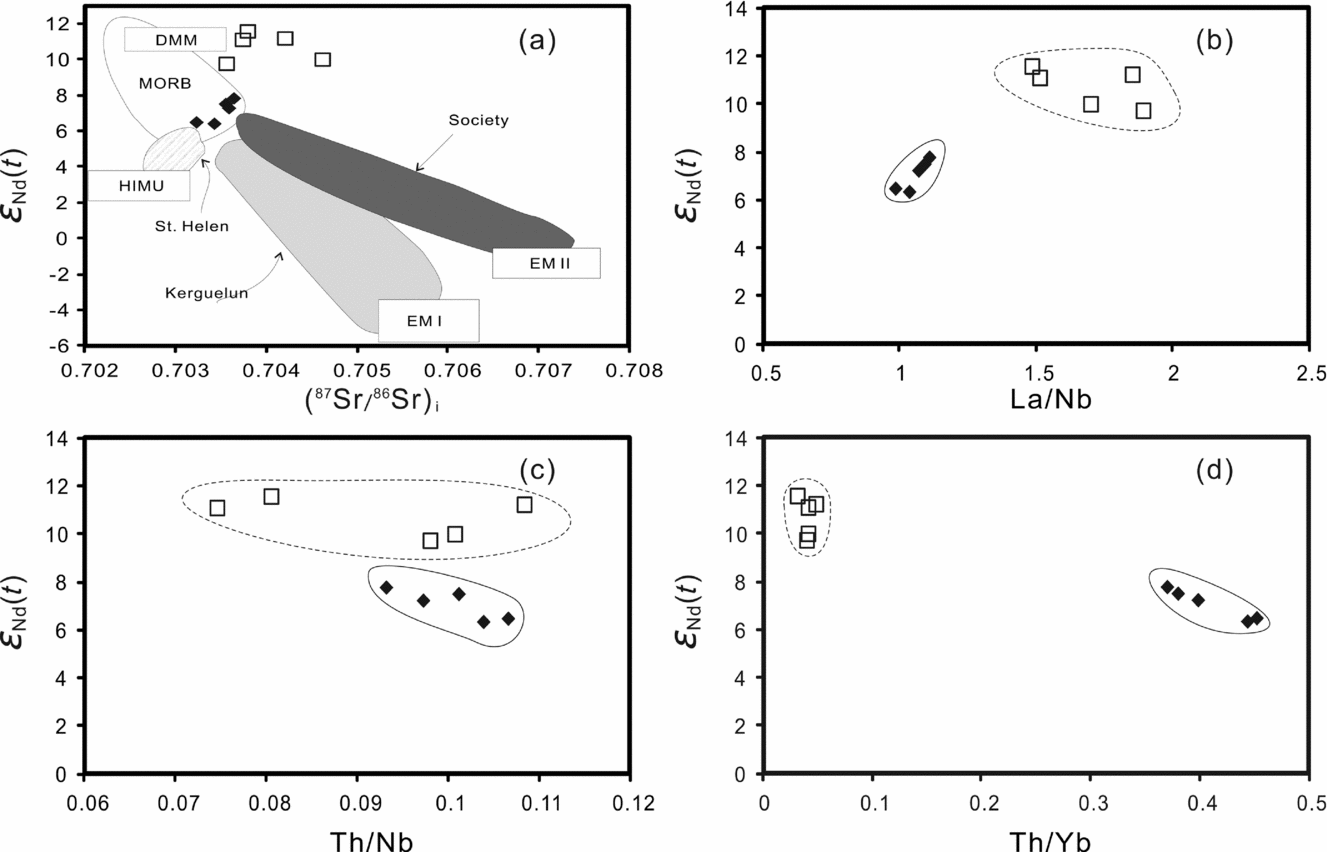
Sr–Nd isotopic compositions are listed in Table 2. Initial values are calculated by using the age of 382.9±3.9 Ma (Jian et al. Reference Jian, Liu, Kroner, Zhang, Wang, Sun and Zhang2009b ). The basalts exhibit restricted ε Nd(t) values from 6.4 to 8.0 and (87Sr/86Sr)i ratios from 0.7032 to 0.7036 (Table 2; Fig. 7a), while the microgabbros have higher ε Nd(t) (9.7–11.6) and variable (87Sr/86Sr)i (0.7036–0.7046; Fig. 7a).
Sr and Nd isotopic compositions of basalts and microgabbros from the Shuanggou ophiolite.

(a) ε Nd(t) versus (87Sr/86Sr)i; isotopic classes of oceanic basalts are after White (Reference White1985) and end-member compositions are after Zindler & Hart (Reference Zindler and Hart1986). (b) La/Nb versus ε Nd(t); (c) Th/Nb versus ε Nd(t); and (d) Th/Yb versus ε Nd(t). Symbols are as for Figure 4.

The basalts display linear correlations between trace element ratios and ε Nd(t) values, while the microgabbros do not show any clear trends (Fig. 7b, c, d). This linear correlation implies mantle heterogeneity or other complex processes such as crustal contamination. In addition, there is no clear correlation between ε Nd(t) and MgO or SiO2 for the microgabbros or for the basalts (Fig. 6b, c).
5. Discussion
As mentioned in the previous section, the Shuanggou basalts and microgabbros are strikingly different in their geochemical characteristics: (1) the microgabbros are of low-alumina type and have normal mid-ocean-ridge basalt (N-MORB) -like trace elemental features with positive ε Nd(t) values of 9.7– 11.6; (2) the basalts are of high-alumina type and have enriched MORB (E-MORB) -like trace elemental features with lower ε Nd(t) values of 6.4–8.0. The basalts and the microgabbros also show distinct relationships among elements or isotopes, indicating that they must have undergone different evolutionary processes. Consequently, the geneses of the microgabbros and basalts are discussed separately in the following.
5.a. Magma evolution and mantle source constraints from microgabbro geochemistry
From microscopic observation, the fractionation sequence of microgabbros is dominated by the crystallization of plagioclase prior to clinopyroxene (Fig. 3a, b). The positive correlations between Al2O3 (or CaO) and MgO (Fig. 4a, b) are due to the fractionation of plagioclase. In contrast, FeO displays a negative correlation with MgO (Fig. 4c); this implies that clinopyroxenes are Fe-depleted, consistent with previous research which revealed that most clinopyroxenes are magnesium diopsides (Mo et al. Reference Mo, Shen, Zhu, Xu, Wei, Tan, Zhang and Cheng1998). Moreover, the negative correlations between FeO or TiO2 and MgO (Fig. 4c, e) indicate that the amount of crystallized ilmenites was very minor.
Some microgabbros display slightly negative Nb–Ta anomalies, while other microgabbros do not exhibit any Nb–Ta anomalies. As a result, these Nb–Ta anomalies were most likely developed during the evolution of the magma rather than inherited from the mantle. This conclusion is further supported by the negative correlation between La/Nb and MgO (Fig. 6a). Normally, crustal contamination is the most common explanation for the negative Nb–Ta anomalies. However, ε Nd(t) values do not show any clear correlation with MgO or SiO2 (Fig. 6b, c). In other words isotopic values remain constant during the magma evolution, which is inconsistent with crustal contamination or other assimilation-related processes.
Instead, we prefer that these slightly negative Nb–Ta anomalies are caused by fractional crystallization of Ti- and Fe-bearing minerals (Tiepolo et al. Reference Tiepolo, Bottazzi, Foley, Oberti, Vannucci and Zanetti2001; Xiong, Adam & Green, Reference Xiong, Adam and Green2005; Klemme et al. Reference Klemme, Günther, Hametner, Prowatke and Zack2006). There are two reasons for this conclusion: (1) La/Nb ratios show negative correlation with MgO (Fig. 6a) and (2) Nb shows positive correlation with Ti (Fig. 6d). The variations of Nb are therefore controlled by the fractionation of Ti-bearing minerals, and crustal contamination is negligible. From this point, trace elements and Nd isotopes of the microgabbros reflect those of their parental magma. In contrast, the Sr isotopic system has been affected by later alteration, inducing a large range.
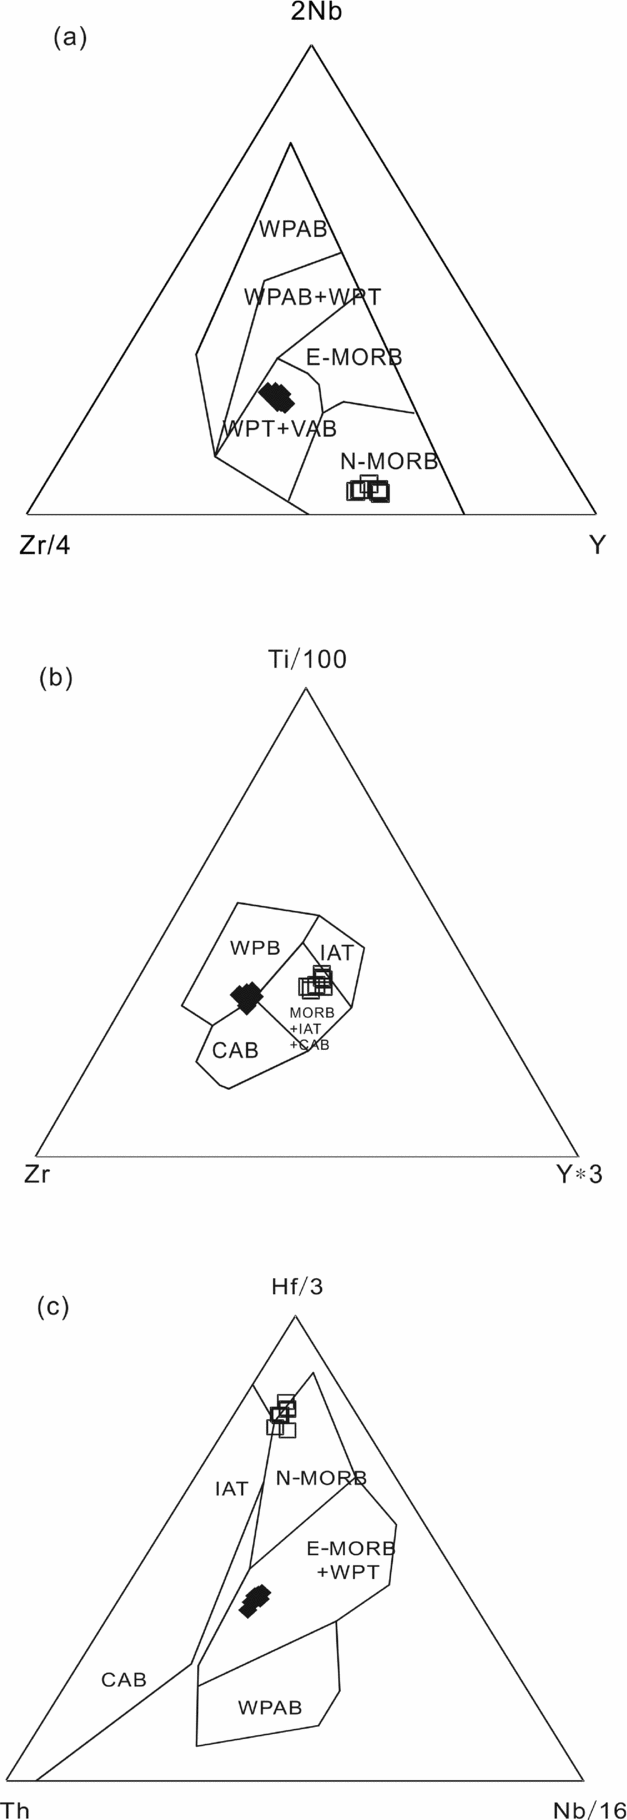
In summary, the microgabbros of low-alumina content were derived from a depleted source region (ε Nd(t) of 9.7–11.6). Moreover, the crystallization of plagioclase before pyroxene is similar to the sequence observed in MORB and the whole-rock geochemistry is generally similar to that of N-MORB (Fig. 8). As a result, we favour the theory that the microgabbros originated from the asthenospheric mantle at the mature stage of the evolution of the Ailaoshan Ocean.
Tectonic discrimination ternary plots: (a) Ti–Zr–Y (Pearce & Cann, Reference Pearce and Cann1973); (b) Hf–Th–Nb (Wood, Reference Wood1980); and (c) Nb–Zr–Y (Meschede, Reference Meschede1986).

5.b. Magma evolution and mantle source constraints from basalt geochemistry
5.b.1. Magma evolution for the basalts
As a special rock type, high-alumina basalt (HAB) is of special significance in understanding the genesis of the calc-alkaline igneous suite (Tilley, Reference Tilley1950; Kuno, Reference Kuno1960). MgO contents of HABs are noteworthy (Draper & Johnston, Reference Draper and Johnston1992); in terms of MgO values, HABs can be divided into two categories: (1) high MgO HABs (HHABs, MgO >7%) and (2) low MgO HABs (LHABs, MgO <7%). The HHAB type has been generated by anhydrous, low-degree (<10%) partial melting of peridotites at c. 10 kbar in previous petrological experiments (Fujii & Scarfe, Reference Fujii and Scarfe1985; Takahashi, Reference Takahashi1986; Falloon & Green, Reference Falloon and Green1987; Bartels, Kinzler & Grove, Reference Bartels, Kinzler and Grove1991). In contrast, two different models have been suggested for the genesis of LHAB: (1) primary magmas from large partial melting of subducted oceanic crust (Baker & Eggler, Reference Baker and Eggler1983; Brophy & Marsh, Reference Brophy and Marsh1986; Johnston, Reference Johnston1986) and (2) derivative magma which is generated by fractionation of mafic phases (Gust & Perfit, Reference Gust and Perfit1987; Bartels, Kinzler & Grove, Reference Bartels, Kinzler and Grove1991; Draper & Johnston, Reference Draper and Johnston1992; Sisson & Grove, Reference Sisson and Grove1993; Ozerov, Reference Ozerov2000; Eason & Sinton, Reference Eason and Sinton2006; Pichavant & MacDonald, Reference Pichavant and MacDonald2007; Wang et al. Reference Wang, Zhang, Fan, Peng, Zhang, Zhang and Bi2010) or plagioclase accumulation (Crawford, Falloon & Eggins, Reference Crawford, Falloon and Eggins1987; Brophy, Reference Brophy1989; Wagner, Donnellynolan & Grove, Reference Wagner, Donnellynolan and Grove1995).
The plagioclase accumulation model is appropriate for the Shuanggou HAB as the amounts of phenocrysts in our samples are large (Fig. 3c, d) and are directly related to the Al2O3 contents. This model is further supported by the chemical composition of the basalts. In comparison with HAB worldwide, the Shuanggou basalts not only have high Al2O3 contents (19.5–23.2%) but also high Mg number (0.61–0.70) with moderate MgO contents (5.9–8.0%). However, the slab-melting model could not account for the high Mg number and MgO content. The mafic-phase-fractionation model is also unsuitable, because both MgO content and Mg number would decrease during the process of mafic phase fractionation. Finally, both MgO and FeO would decrease during the accumulation of plagioclase while Mg number would remain unchanged.
A plagioclase accumulation model is therefore proposed. Specifically, the derivative magma captured plagioclase as phenocrysts and left mafic phases behind. The whole-rock concentration of each oxide (C WR i ) is therefore defined:
 \begin{equation*}
C_i^{{\rm WR}} = C_i^{{\rm Plg}} P + C_i^{{\rm Gr}} (1 - P)
\end{equation*}
where the subscript i refers to a particular oxide (e.g. MgO, FeO, etc.); C Plg i and C Gr i are the concentration of each oxide in phenocrysts and groundmass, respectively; and P is the mass fraction of phenocrysts. The concentration of groundmass is therefore defined:
 \begin{equation*}
C_i^{{\rm Gr}} = \frac{{C_i^{{\rm WR}} - C_i^{{\rm Plg}} P}}{{1 - P}}.
\end{equation*}
Groundmass of sample SG1116 is considered to be nearest to parental magma, because SG1116 has the highest and near-primary Mg number (0.70). Phenocryst mass fraction is estimated to be 30%, slightly lower than its volume percentage (c. 35%). On the basis of the above, the concentration of major oxides that are highly incompatible with plagioclase (e.g. MgO, FeO, TiO2 and Cr2O3) were calculated as:
 \begin{equation*}
C_i^{{\rm Gr}} = \frac{{C_i^{{\rm WR}} }}{{1 - P}}.
\end{equation*}
The MgO concentration is high (11.4%). The Al2O3 concentration must also be high; even by taking An100 as the concentration of plagioclase phenocrysts, a concentration of 17.4% is obtained. In summary, the parental magma of the basalts is characterized by high MgO and Al2O3 contents. It can therefore be classified as a high-MgO HAB (HHAB).
5.b.2. Mantle constraints for the basalts
Since the Shuanggou basalts have captured considerable amounts of plagioclase as phenocrysts, the issue of whether these basalts are representative of the original liquid composition ought to be considered.
To answer this question, we selected elements which are incompatible with plagioclase (e.g. high field strength and heavy rare Earth elements or HFSE and HREE). Their mass fractions decreased in proportion to the addition of plagioclases; ratios or ternary plots of these elements could therefore eliminate the ‘dilution effects’ and be indicative of the chemical characteristics of the original liquid. In addition, they are relatively immobile during later alteration.
Most selected trace element ratios exhibit linear correlations with isotopic data (i.e. ε Nd(t)) for the basalts (Fig. 7c, d), implying a mixing process (Pietruszka, Hauri & Blichert-Toft, Reference Pietruszka, Hauri and Blichert-Toft2009). This interpretation is however oversimplified and uncertain, because the ‘mixing’ could be either an assimilated fractionation process or source contamination. For the basalts of Shuanggou ophiolite, crustal contamination could be ruled out because of the absence of Nb–Ta anomalies. In this study, any assimilated fractionation processes are inappropriate as ε Nd(t) or elements ratios do not show any clear correlations with MgO or SiO2 (Fig. 6). We therefore suggest that the linear correlation corresponds to an inherited mantle signature, reflecting a mixed mantle source which comprises at least one depleted component and one enriched component. In Figure 7, the depleted component has higher 143Nd/144Nd and La/Nb ratios with lower Th/Nb and Th/Yb ratios; it is therefore reasonable to consider the asthenospheric mantle of the microgabbros as the depleted component because it meets these requirements well. In contrast, the enriched component exhibits lower 143Nd/144Nd and La/Nb ratios with higher Th/Nb and Th/Yb ratios. Recycled sediment, continental crust and related fluid are therefore ruled out as they have very high La/Nb ratios. Oceanic crusts are also unsuitable, as they generally have high 143Nd/144Nd ratios. Indeed, in the later discussion of tectonic nature (section 5.c) we describe how the formation of the Ailaoshan Ocean was unrelated to subduction. From the viewpoint of a subduction-unrelated environment, it is difficult to consider such components (i.e. recycled sediment, continental crust, oceanic crusts and related fluid) as having been injected into the mantle.
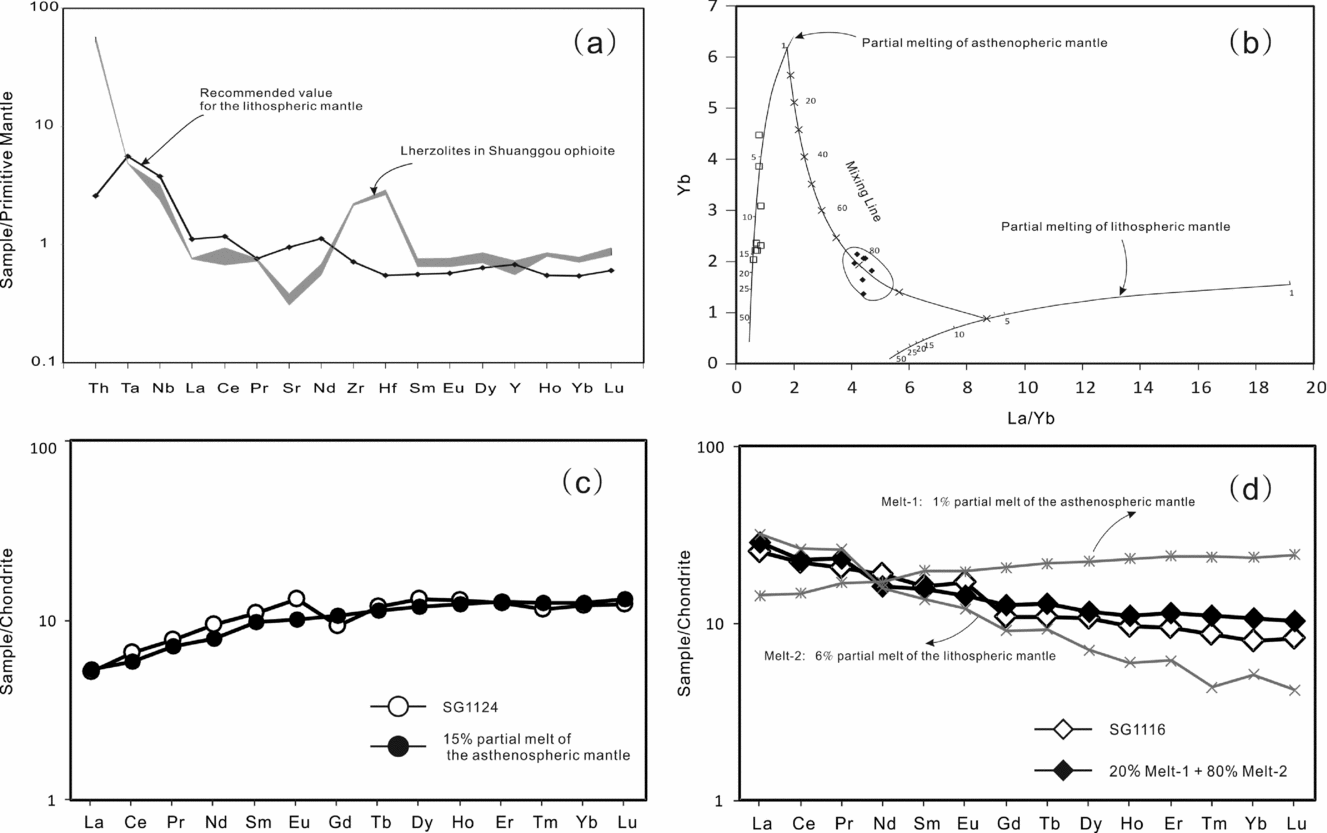
Instead, we prefer the simplest explanation which is that the enriched component was the continental lithospheric mantle. Continental lithospheric mantle is usually characterized by low ε Nd(t) and, on average, an incompatible element-enriched pattern (Fig. 9a) (McDonough, Reference McDonough1990). With the exception of the Th/Nb ratio, the ratios (La/Nb and Th/Yb) of the recommended concentrations of elements in the continental lithospheric mantle generally meet the requirements. More importantly, the lherzolites of the Ailaoshan ophiolite, the remnants of the lithospheric mantle, almost fit the requirements (Fig. 9a) (Mo et al. Reference Mo, Shen, Zhu, Xu, Wei, Tan, Zhang and Cheng1998). Specifically, for the lherzolites the La/Nb ratio is relatively low (0.2–0.5) while the Th/Nb (2.1–2.6) and Th/Yb (11.3–14.0) ratios are high. As a result, the continental lithospheric mantle is the best candidate for the enriched end-member.
(a) Primitive mantle-normalized incompatible element distribution spidergrams for the recommended value of lithospheric mantle (McDonough, Reference McDonough1990) and lherzolites of the Shuanggou ophiolite (Mo et al. Reference Mo, Shen, Zhu, Xu, Wei, Tan, Zhang and Cheng1998). (b) Plots of La/Yb versus Yb. (c) Chondrite-normalized REE diagrams for modelling melts and microgabbro. (d) Chondrite-normalized REE diagrams for modelling melts and basalt. Batch melting curves were calculated by using the equation of Shaw (Reference Shaw1970). Partition coefficients are from Mckenzie and O’Nions (Reference Mckenzie and O’Nions1991, Reference Mckenzie and O’Nions1995). Undepleted/flat heavy REE profiles suggest that both the lithospheric mantle and the asthenospheric mantle were in the spinel field. For the lithospheric mantle, the modes are (ol: 63%; opx: 24%; cpx: 11%; sp: 2%; McDonough Reference McDonough1990) and chemical compositions are from Mo et al. (Reference Mo, Shen, Zhu, Xu, Wei, Tan, Zhang and Cheng1998). For the asthenospheric mantle, the modes (ol: 57%; opx: 28%; cpx: 13%; sp: 11%) and chemical compositions are from Workman & Hart (Reference Workman and Hart2005). Melt modes (ol: –6%; opx: 28%; cpx: 67%; 11%) during partial melting of spinel-bearing peridotites are from Kinzler (Reference Kinzler1997).

The mixed mantle source was therefore most likely composed of the asthenospheric mantle and the continental lithospheric mantle. Along with this demonstration, a remaining uncertainty is the formation mechanism of the mixed source. In a modern ocean ridge system, high-Al and low-Si basalts are restricted to ridges with slow spreading rates (Eason & Sinton, Reference Eason and Sinton2006). Together with the fact that our samples show an affinity with E-MORB or within-plate basalt (Fig. 8), we suggest that the Shuanggou HABs formed in a continent–ocean transition setting, in which both the asthenospheric mantle and the adjacent continental lithospheric mantle could be activated by the lithospheric extension and form a mixed source.
REE characteristics were used to further constrain the partial melting process. Undepleted/flat heavy REE profiles suggest that both the lithospheric mantle and the asthenospheric mantle were formed in a garnet-absent field. Following the batch melting equation of Shaw (Reference Shaw1970), the basalts could be generated by low-degree partial melting of the mixed mantle (Fig. 9b, d) while the microgabbros were the products of melts derived from moderate-degree partial melting of the asthenospheric mantle (Fig. 9c). For the basalts, the calculated HREE contents are slightly higher than those determined for the sample while the calculated LREE contents fit the data well. This could be explained by the accumulation of the plagioclase. LREEs are slightly to moderately incompatible with the plagioclase, with distribution coefficient 0.33 (DLa) to 0.11 (DSm), while the HREEs are highly incompatible with distribution coefficient 0.066 (DGd) to 0.025 (DLu) (Mckenzie and O’Nions, Reference Mckenzie and O’Nions1991, Reference Mckenzie and O’Nions1995). The addition of plagioclase into the magma would therefore decrease the HREEs relative to the LREEs.
5.c. Tectonic nature of the Ailaoshan Ocean
Rock assemblage in the Shuanggou ophiolite is quite simple. Cumulated gabbros have not been found, and ferruginous sediments directly overlie the mantle peridotites in some cases. The microgabbros may also directly overlie the peridotites as indicated by the very short distance (c. 0.5 m) between the peridotites and the microgabbros (Zhang, Zhou & Li, Reference Zhang, Zhou and Li1995). The basalts do not demonstrate any contact with the microgabbros, but display fault contact with the peridotites in some outcrops (Zhang, Zhou & Li, Reference Zhang, Zhou and Li1995; Zhong, Reference Zhong1998). All these geological features indicate a thin crust with limited magma supply in a slow-spreading ocean (Zhang, Zhou & Li, Reference Zhang, Zhou and Li1995; Yumul et al. Reference Yumul, Zhou, Wang, Zhao and Dimalanta2008).
As discussed in the opening section, the issue as to whether the ocean was subduction-related or not is controversial. Indeed, the hypothesis of subduction-related back-arc basin is inappropriate for two reasons: (1) in terms of regional geology, the requisite associated arc for the subduction of the main ocean has not been located near the Ailaoshan suture zone. (Lai et al. Reference Lai, Meffre, Crawford, Zaw, Halpin, Xue and Salam2013 a, Reference Lai, Meffre, Crawford, Zaw, Xue and Halpin b ); and (2) in terms of geological time, the formation age of the Ailaoshan ophiolite (c. 380 Ma; Late Devonian) is much earlier than the time of subduction of main Tethys Ocean (c. 290 Ma; Early Permian) as demonstrated by a series of geochronological results (Jian et al. Reference Jian, Liu, Kroner, Zhang, Wang, Sun and Zhang2009b ).
Research results for the magma evolution and mantle sources of the Shuanggou ophiolite have important implications for the tectonic environment of the Ailaoshan Ocean. As shown above, neither of our two groups of samples exhibits subduction-related geochemistry.
The Shuanggou HAB is generally comparable to E-MORB in terms of geochemistry (Mo et al. Reference Mo, Shen, Zhu, Xu, Wei, Tan, Zhang and Cheng1998). More importantly, the absence of subduction-related signals (e.g. Nb–Ta anomaly) suggests that the Shuanggou HAB is independent of subduction. In a modern ocean ridge system, high-Al and low-Si basalts are restricted to ridges with slow spreading rates (Eason & Sinton, Reference Eason and Sinton2006). Overall, we prefer the theory that the Shuanggou HABs formed in a continent–ocean transition setting. The geochemical model indicates that the Shuanggou HABs were derived from low-degree partial melting of a mixed mantle composed of the asthenospheric mantle and the adjacent lithospheric mantle.
In contrast, for the microgabbros the crystallization sequence (plagioclase → pyroxene) is similar to that of MORB. Their chemical compositions are generally similar to those of N-MORB, implying that they were generated from the asthenospheric mantle at the mature stage of the evolution of the Ailaoshan Ocean. The microgabbros are also unrelated to subduction as their slightly negative Nb–Ta anomalies were due to the fractionation of Ti-bearing minerals.
Trigger mechanisms for partial melting can be categorized into three mechanisms as follows (Xu, Reference Xu2006).
-
1. A reduction in the liquidus temperature for partial melting, which is generally related to the addition of volatile (e.g. H2O and CO2). In this study however, we have demonstrated that the ocean was subduction-unrelated. The addition of volatile is therefore limited and might not be sufficient to cause the partial melting of lithospheric mantle.
-
2. An increase in mantle temperature; this also may not be the case due to the lack of evidence for the existence of a mantle plume near the Ailaoshan Ocean.
-
3. The adiabatic ascending of the mantle; in the Ailaoshan segment, high-grade metamorphic rock assemblage is considered to be representative of the continent–ocean transition zone. It is in fault contact with the Yangtze Block to the east and the olistostrome to the west. These geological characteristics are consistent with a non-volcanic rifted margin (Froitzheim & Manatschal, Reference Froitzheim and Manatschal1996; Hopper et al. Reference Hopper, Funck, Tucholke, Larsen, Holbrook, Louden, Shillington and Lau2004). On these grounds, Jian et al. (Reference Jian, Liu, Kroner, Zhang, Wang, Sun and Zhang2009b ) proposed a detach-rifting system which could have caused the thinning of the lithosphere and the exhumation of lithospheric mantle. Consequently, the lithospheric extension would have further induced the upwelling of the asthenospheric mantle.
In summary, we have determined that the opening of the Ailaoshan Ocean was subduction-unrelated (Zhong, Reference Zhong1998). Furthermore, we propose a two-stage model for the formation of the Shuanggou ophiolite.
First, at the continent–ocean transition stage (Early Devonian, before c. 400 Ma), the development of non-volcanic rifted margin caused the break-up of the Simao and the Yangtze blocks. During the continental rifting, detachment faulting removed crust (Jian et al. Reference Jian, Liu, Kroner, Zhang, Wang, Sun and Zhang2009b ) and caused the extension of the lithosphere. Consequently, the lithospheric extension induced the upwelling of the hot asthenospheric mantle to the root of the lithosphere. Together with the increase in temperature and the decrease in pressure, both the subcontinental lithospheric mantle and the asthenospheric mantle started to melt. With time, low-degree melts (6%) from the subcontinental lithospheric mantle (SCLM) mixed in variable proportions with smaller-degree melts (1%) from the adjacent asthenospheric mantle.
Second, when the Ailaoshan Ocean developed into the mature stage (c. 387–374 Ma; Jian et al. Reference Jian, Liu, Kroner, Zhang, Wang, Sun and Zhang2009a ), the Ailaoshan microgabbros were generated by moderate-degree (c. 15%) partial melting of the asthenosphere mantle, which was continually renewed by the mantle convection.
6. Conclusions
This paper provides new elemental and Sr–Nd isotopic data for the basalts and microgabbros from the Shuanggou ophiolite, demonstrating that the basalts and microgabbros were formed by different magmas from distinct sources. The Shuanggou microgabbros are generally comparable to N-MORB, suggesting they were derived from the asthenospheric mantle. In contrast, the Shuanggou HABs are the products of melts from a mixed mantle composed of the asthenospheric mantle and the continental lithospheric mantle. We also confirm that the formation of the Ailaoshan Ocean was not related to subduction.
Acknowledgements
The authors appreciate the assistance of Jing Hu, Yifan Yin and Xiaobiao Li with trace elements and Sr–Nd isotope measurements at the SKLODG. Dr G. P. Yumul, an anonymous reviewer and the editor Dr P. Leat are thanked for their constructive reviews of this manuscript. This study was jointly supported by the CAS/SAFEA International Partnership Program for Creative Research Teams (Intraplate Mineralization Research Team; KZZD-EW-TZ-20) and the 12th Five-Year Plan project of the State Key Laboratory of Ore Deposit Geochemistry, Chinese Academy of Sciences (SKLOG-ZY125–06).